This article assesses recent developments in monetary policy transmission with a special focus on transmission to banks’ deposit and lending interest rates since the introduction of the external benchmark linked lending rate (EBLR) regime in October 2019. Data collected from banks suggest the share of outstanding loans linked to external benchmarks increased from as low as 2.4 per cent during September 2019 to 28.5 per cent during March 2021, contributing to significant improvement in transmission on the back of persisting surplus liquidity conditions. Introduction Monetary policy transmission is a process through which changes in the central bank’s policy rate are transmitted to the real economy in pursuit of its ultimate objectives of price stability and growth (Acharya, 2017). Being the monopoly supplier of currency and reserves, when a central bank changes the rate at which these reserves are borrowed or lent by the commercial banks, that influence other market interest rates. A smooth transmission of monetary impulses to the long-term interest rate is essential to influence the aggregate demand (consumption and investment) and pursue the ultimate goals of monetary policy, though interest rate is not the only channel through which monetary policy works. In a country like India where the banking system constitutes a predominant segment of the financial system and plays a leading role in financial intermediation, efficient transmission to banks’ deposit and lending interest rates assumes significance. Taking cognizance of the key role of banks in the financial system in India, the Reserve Bank has endeavoured to address the impediments to improve transmission to banks’ lending rates, with the most recent one being the introduction of the external benchmarking regime for floating rate loans in select sectors.1 This article assesses monetary transmission to various segments of the financial system in response to the cumulative decline of 250 basis points (bps) in the policy rate during the current easing cycle (February 2019 – June 2021). It outlines the monetary policy transmission to money market rates and bond market yields in Section II. Section III assesses the transmission to deposit and lending rates of scheduled commercial banks (excluding regional rural banks and small finance banks). Section IV delineates factors that contributed to the improvement in transmission to lending and deposit interest rates. Section V outlines the impediments to monetary transmission and the last section concludes with key takeaways. II. Transmission to the Money and Bond Market The response of money and corporate bond markets to monetary policy changes has been highly elastic during the current easing cycle that began on February 7, 2019 and more so since March 2020, i.e. in the aftermath of COVID 19. The outbreak of COVID-19 triggered bouts of volatility in financial markets, but a slew of policy measures announced by the Reserve Bank ensured easy financing conditions and restored orderly functioning of markets. Across the overnight money market segment comprising call money, triparty repo and market repo, the transmission was almost instantaneous. Interest rates in the secondary market on short-term money market instruments such as 3-month certificates of deposit (CDs), 3-month commercial papers (CPs) and 91-day Treasury bills (T-Bills) too softened significantly compared to the policy rate easing, with the speed of the response increasing further since March 2020 (Chart 1). Deployment of conventional and unconventional monetary policy tools to augment liquidity, in fact, pushed short-term rates towards the bottom of liquidity adjustment facility (LAF) corridor.  In the corporate bond market segment, yield on AAA rated 5-year bond has softened cumulatively by 237 bps (up to June 30), in response to the policy repo rate cut of 250 bps effected through the easing cycle since February 2019. The corporate bond market experienced severe stress during March-April 2020 as yields surged after the outbreak of COVID-19. Surplus liquidity conditions engendered by targeted long-term repo operations (TLTROs), open market operations (OMOs) and “operation twist” auctions by the Reserve Bank, however, helped to push yields to decadal lows. These monetary operations also helped to revive investors’ interest as evident from the record primary market issuances during 2020-21 and the increased secondary market turnover. Unlike the corporate bond market, the transmission to the government securities market, particularly at the long end, has been less than complete reflecting the impact of higher supply of papers resulting from higher fiscal deficit. Since the G-sec yield curve serves as a key benchmark for term financing in the capital market, and also to ensure consistency of G-sec yield movements with the stated stance and forward guidance of monetary policy, the Reserve Bank augmented its liquidity measures and deployed secondary market G-sec acquisition programmes or G-SAPs during 2021-22 to anchor orderly evolution of the yield curve. III. Transmission to Deposit and Lending Rates of Banks The transmission of policy repo rate changes to deposit and lending rates of scheduled commercial banks (SCBs) has improved since the introduction of external benchmark-based pricing of loans (Chart 2). The transmission showed further improvement since March 2020 on account of sizeable policy rate cuts, and persisting surplus liquidity conditions resulting from various system level as well as targeted measures introduced by the Reserve Bank - cut in the cash reserve ratio (CRR) requirements, long-term repo operations (LTROs), TLTROs, refinancing window for All India Financial Institutions (AIFIs), sector/segment specific liquidity measures (Mutual Funds, Small Finance Banks, Micro Finance Institutions/Non-Bank Financial Companies), special open market operations and regular OMOs. Transmission at aggregate bank level In response to the cumulative reduction of policy repo rate by 250 basis points (bps), the 1-year median marginal cost of funds-based lending rate (MCLR) of SCBs declined by 155 bps during February 2019 to June 2021. Transmission to lending rates has improved considerably in the current easing phase (up to May 2021) and more so since October 2019 when there has been a complete pass-through of repo rate cuts to the weighted average lending rate (WALR) on fresh rupee loans. Further, the improvement in transmission to outstanding loans is also pronounced during the same period (Table 1). Since the rate cut cycle started in February 2019, more and more loans linked to MCLR, primarily in the 1-year bucket are getting reset since February 2020 contributing to the improvement in transmission to WALR on outstanding loans. In addition, the increase in the share of external benchmark linked loans in the total outstanding loans has also played an important role (details are discussed in Section IV). | Table 1: Transmission from the Repo Rate to Banks’ Deposit and Lending Rates | | Period | Repo Rate
(bps) | Term Deposit rates (bps) | Lending rates (bps) | | Median TDR - Fresh Deposits | WADTDR- Outstanding Deposits | 1 - Yr. Median MCLR | WALR - Outstanding Rupee Loans | WALR - Fresh Rupee Loans | | Feb 2019 - Sep 2019 | -110 | -9 | -7 | -30 | 2 | -40 | | Oct 2019 – Jun 2021* (EBLR Regime) | -140 | -178 | -152 | -125 | -113 | -176 | | Mar 2020 - Jun 2021* | -115 | -149 | -113 | -100 | -95 | -145 | | Feb 2019 – Jun 2021* | -250 | -211 | -159 | -155 | -111 | -216 | *: Latest data on WALRs and WADTDR pertain to May 2021.
WALR: Weighted Average Lending Rate; WADTDR: Weighted Average Domestic Term Deposit Rate.
TDR: Term Deposit Rate; MCLR: Marginal Cost of Funds-based Lending Rate.
Sources: RBI; and Authors’ calculations. | The adoption of external benchmark-based pricing of loans strengthened market impulses for quicker adjustments in deposit rates. The weighted average domestic term deposit rate (WADTDR) on outstanding rupee deposits has declined by 152 bps since October 2019 as compared to the decline of mere 7 bps during February-September 2019. Between October 2019 and June 2021, the moderation in median term deposit rate, which reflects the prevailing card rates on new deposits, has been of the order of 178 bps. Additionally, the reduction in deposit rates was also perceptible for saving deposits, which form nearly 33.6 per cent of the total deposits2 of SCBs. The saving deposit rates of five major banks dropped to a range of 2.70-3.00 per cent in June 2021 from 3.25-3.50 per cent that prevailed prior to the introduction of the external benchmark system (end September 2019). Transmission across bank groups Across bank groups, the transmission to deposit and lending interest rates has been uneven, reflecting idiosyncratic factors. The pass-through to deposit and lending rates is substantial for foreign banks during the external benchmark lending rate (EBLR) regime (Chart 3). This is due to the increased sensitivity of their deposit portfolios which is primarily made up of low cost and lower duration wholesale deposits.3 On the other hand, the public sector banks (PSBs) depend more on retail term deposits and face competition from alternative saving instruments like small savings, which constrains them from lowering deposit rates in sync with the policy repo rate.4 During the EBLR regime, private sector banks have exhibited increased pass-through to lending and deposit rates compared to public sector banks. This uneven transmission across bank groups is partly explained by the fact that the share of outstanding loans linked to external benchmark is more for private banks as compared to PSBs. 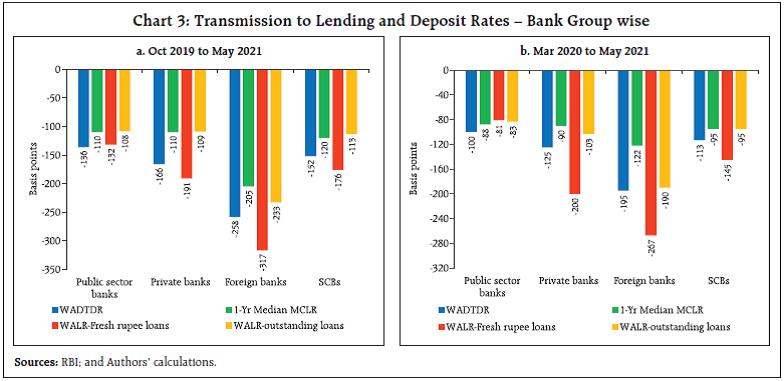 There has been an increase in spread (i.e., WALR on fresh rupee loans over 1-year MCLR) charged by PSBs during March to July 2020, declining thereafter, to an average level with the gradual return of normalcy in financial markets (Chart 4). Nonetheless, the WALR of PSBs (7.83 per cent) remained lower than that of private sector banks (8.27 per cent) during May 2021, due to lower MCLR and lower spread charged by PSBs. Transmission across sectors There is asymmetry in pass-through to lending rates across sectors due to their varied credit demand and risk profiles. The WALRs on fresh rupee loans to all sectors except rupee export credit declined in the period from April 2020 to May 2021. The decline was sharpest in case of education loans followed by MSME loans, housing loans and other personal loans. In case of outstanding rupee loans, lending rates declined across all sectors during the same period (Chart 5).
Spreads of WALRs on outstanding rupee loans and fresh rupee loans over 1-year MCLR were uneven across sectors reflecting their varied credit risk profiles and business strategies followed by banks (Chart 6). The spread was among the lowest in respect of housing loans, reflecting lower defaults and the availability of collaterals. Personal loans (other than housing and vehicle loans) are mostly unsecured and involve higher credit risk; hence, the spread charged was the highest for other personal loans. IV. What has Aided Transmission? The transmission of policy repo rate changes to deposit and lending rates of banks has witnessed significant improvement during the ongoing easing cycle, particularly after the introduction of external benchmark regime. Further, a combination of surplus liquidity conditions amidst weak credit demand has enabled banks to lower their deposit rates and hence the lending rates. Introduction of external benchmark system In pursuance of the recommendations of an Internal Study Group (Chairman: Dr. Janak Raj), the Reserve Bank mandated all scheduled commercial banks (excluding regional rural banks) to link all new floating rate personal or retail loans and floating rate loans to micro and small enterprises (MSEs) to the policy repo rate or 3-month T-bill rate or 6-month T-bill rate or any other benchmark market interest rate published by the Financial Benchmarks India Private Ltd. (FBIL), effective October 1, 2019. It was extended to medium enterprises, effective April 1, 2020. The inherent framework for pricing of loans under an external benchmark system is such that the transmission should work better vis-à-vis an internal benchmark system (Box I). External benchmarks are transparent as they are available in the public domain and hence easily accessible to the borrowers. Most banks have chosen the Reserve Bank’s repo rate as the benchmark rate. This brings uniformity across banks and facilitates product comparison. The information collected from banks suggests that most banks, i.e., 38 of the 58 banks that have external benchmark linked loans (out of a total of 71 banks that responded to our survey) have adopted the Reserve Bank’s policy repo rate as the external benchmark for floating rate loans to the retail and MSME sectors in May 2021. These include 28 banks in the public and private sectors. Five banks have adopted sector-specific benchmarks (Table 2). Box I: Internal vs External Benchmark System for pricing of loans The salient distinguishing features of the external benchmark linked rate (EBLR) regime vis-à-vis the internal benchmark (base rate or MCLR) regime in India are detailed below. -
Any change in the benchmark rate is mandated to be passed on to the lending rates for new borrowers on a 1-1 basis (if spread remains unchanged) under EBLR regime. -
For outstanding floating rate loans linked to an external benchmark, banks are mandated to pass on the changes in the benchmark rate to the existing borrowers within 3 months while the majority of loans are linked to 1-year MCLR (internal benchmark) and are reset annually. -
The EBLR framework prohibits banks from adjusting their spreads for existing borrowers for three years in the absence of a significant credit event. -
Under internal benchmark (MCLR) system, transmission to lending rates is indirect (since lending rates are determined on a cost-plus basis) and is contingent upon changes in deposit interest rates (RBI, 2017). However, under the external benchmark system, transmission to lending rates is not contingent upon change in deposit interest rates. As and when the Monetary Policy Committee (MPC) changes the policy repo rate, and with most banks using the policy repo rate as the external benchmark, lending interest rates will change - even for existing customers - on a 1-1 basis and that too, at the most within a quarter. -
The framework of EBLR regime, therefore, improves transmission to lending and deposit rates as benchmarks are exogenous to each bank and adjust automatically to the policy rate change (with the spread assumed to remain inflexible to the policy rate change). | Data collected from banks suggest an increasing share of outstanding loans linked to external benchmarks - more so for foreign banks followed by the private sector banks. The share of outstanding loans linked to external benchmark in total floating rate loans has increased from as low as 2.4 per cent during September 2019 to 28.5 per cent by the end of FY: 2020-21 (Table 3). Notably, the outstanding loans (linked to both fixed and floating interest rates) in personal and MSME segments accounted for 35 per cent of the outstanding loans as at end-March 2021. As discussed earlier, quarterly periodicity in re-setting interest rates for outstanding loans linked to external benchmark as against annual for MCLR linked loans has contributed to the improvement in pass-through to lending rates on outstanding loans. In case of sectors where floating rate loans are mandated to be linked to an external benchmark, MSME and personal loans witnessed significant increase in share of outstanding loans linked to external benchmark. The share of MSME loans and housing loans linked to external benchmark in total outstanding floating rate rupee loans in respective sectors stands higher at 58.5 per cent and 49.1 per cent, respectively, as at end-March 2021. Other sectors too recorded increases in their respective shares of floating rate outstanding loans linked to external benchmarks over the same period (Table 4). | Table 2: External Benchmarks of Scheduled Commercial Banks - May 2021 | | | Policy Repo Rate | CD | OIS | MIBOR | 3 Month T Bill | Sector Specific Benchmark*
(other than Repo) | Total | | Public sector banks (11) | 11 | | | | | | 11 | | Private banks (21)# | 17 | 1 | | | | 2 | 20 | | Foreign Banks (39)# | 10 | | 1 | 3 | 10 | 3 | 27 | | SCBs (71) # | 38 | 1 | 1 | 3 | 10 | 5 | 58 | *: Sector specific benchmarks include MIBOR, OIS, 10-Yr Govt. Securities, CD Rates.
#: 1 private bank and 12 foreign banks reported NIL.
Note: Figures in parentheses refer to the number of banks that responded to the survey.
Source: Information collected from banks. |
| Table 3: Share of Outstanding Floating Rate Rupee Loans of SCBs (in per cent): Interest Rate Regimes | | Bank Group | Base Rate | MCLR | External Benchmark | | Sep-19 | Mar-20 | Mar-21 | Sep-19 | Mar-20 | Mar-21 | Sep-19 | Mar-20 | Mar-21 | | Public Sector Banks (11) | 15.0 | 12.3 | 7.9 | 82.7 | 80.9 | 69.1 | 0.4 | 4.9 | 20.3 | | Private Sector Banks (22) | 8.3 | 6.8 | 3.9 | 86.7 | 74.9 | 52.6 | 4.6 | 17.3 | 42.7 | | Foreign Banks (42) | 6.8 | 5.2 | 2.7 | 67.3 | 56.7 | 30.7 | 25.7 | 37.9 | 66.6 | | SCBs (75) | 12.7 | 10.5 | 6.5 | 83.6 | 78.5 | 62.9 | 2.4 | 9.4 | 28.5 | Note: (i) Data is collected from 75 SCBs.
(ii) Figures in table do not add up to hundred because residual loans are linked to BPLR.
Source: Information collected from banks. | Monetary transmission to all new loans sanctioned in respect of select sectors where new floating rate loans have been linked to the external benchmark registered substantial improvement. The WALRs of domestic banks in respect of fresh rupee loans on housing, vehicle and other personal loans declined significantly during October 2019-May 2021. The decline was sharpest in the case of MSME loans (212 bps) followed by other personal loans (164 bps) (Chart 7). During the same period, the decline observed in WALR on fresh rupee loans for all sectors combined stood at 176 bps. As lending rates undergo frequent adjustments in accordance with the benchmark rate under EBLR regime, banks are incentivised to adjust their term as well as saving deposit rates to cushion their net interest margins. The median saving deposit rate for domestic banks which remained sticky at 3.5 per cent since October 2017, declined to 3 per cent in June 2020. Since the reduction in interest rates on saving deposits is pervasive as compared to term deposits which is applicable only to fresh term deposits, the former has instantaneous bearing in reducing the overall cost of funds for banks, and resultantly, the MCLR and lending rates on fresh rupee loans provided banks do not make offsetting adjustments in spreads (Chart 8). Consequently, the impact of introduction of external benchmark-based pricing of loans on monetary transmission percolates to sectors that are not linked to external benchmark loan pricing. | Table 4: Share of Outstanding Floating Rate Rupee Loans under Interest Rate Regimes: Sector wise | | (Per cent) | | Sectors | Sep-19 | Mar-20 | Mar-21 | | Base rate | MCLR | External benchmark | Base rate | MCLR | External benchmark | Base rate | MCLR | External benchmark | | MSMEs | 11.4 | 85.6 | 1.9 | 9.5 | 72.2 | 17.3 | 5.5 | 35.0 | 58.5 | | Personal Loans | 15.4 | 81.9 | 1.6 | 12.5 | 73.7 | 13.1 | 6.2 | 57.0 | 35.3 | | Housing | 17.6 | 79.2 | 2.2 | 14.6 | 68.3 | 16.2 | 7.3 | 41.9 | 49.1 | | Vehicle | 13.9 | 85.0 | 1.0 | 10.1 | 76.2 | 13.5 | 4.3 | 57.3 | 38.2 | | Education | 51.3 | 42.8 | 0.4 | 47.2 | 43.3 | 4.8 | 32.0 | 40.7 | 23.7 | | Other Personal Loans | 6.6 | 92.8 | 0.2 | 4.7 | 88.4 | 6.7 | 2.1 | 78.0 | 19.3 | Note: (i) The data is collected from 75 SCBs.
(ii) Figures in table do not add up to hundred because residual loans are linked to BPLR.
Sources: Information collected from banks. |
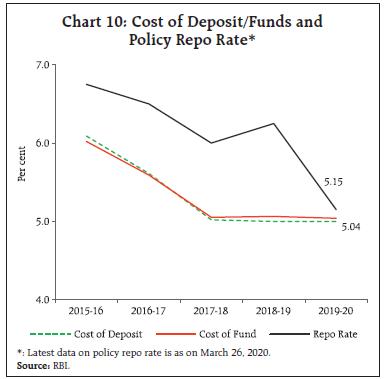
Surplus liquidity conditions amidst muted credit demand To support economic activity in the aftermath of COVID-19 and alleviate stress in financial markets, the Reserve Bank introduced liquidity augmenting measures such as TLTROs and reduction in CRR.5 Further, the Reserve bank also put in place secondary market G-sec acquisition programme (G-SAP) during 2021 to enable a stable and orderly evolution of the yield curve amidst comfortable liquidity conditions. These operations along with the Reserve Bank’s forex operations resulted in surplus liquidity conditions in the banking system with average daily liquidity absorption on a net basis increasing from ₹3.0 lakh crore in March 2020 to ₹4.9 lakh crore during June 2021. Liquidity has also been aided by robust deposit growth outpacing credit growth persistently (Chart 9a). Credit growth for banks decelerated sharply averaging 5.9 per cent during March 2020 - May 2021 reflecting weak demand and uncertainty in the wake of pandemic before improving thereafter. Further, deposits maintained robust growth at 10.5 per cent during the same period. This wedge is also evident in the credit to deposit ratio which had declined to 70.8 per cent in May 2021 from 76.0 per cent during end March 2020 (Chart 9b). During this period, banks garnered deposits amounting to ₹18.4 lakh crore of which less than half i.e. ₹7.0 lakh crore (38 per cent) was lent. A combination of abundant liquidity and weak credit demand amidst strong deposit growth prompted banks to lower their deposit rates across all tenors – often below the reverse repo rate for maturities up to three months.6 The lowering of deposit rates had resulted in the decline in cost of funds for SCBs, prompting banks to reduce their MCLRs, and in turn their WALRs. The decline in lending rate would have accelerated the credit growth in economy (Box II). However, subdued credit demand in low growth environment has prevented the credit offtake. Moreover, the muted demand for credit by corporates drags on credit offtake. The credit to large industry and services sector broadly represent loans to the corporate sector. The credit growth to large industry decelerated to (-)0.8 per cent in March 2021 from 0.6 per cent in March 2020; and that to the services sector decelerated to 1.4 per cent in March 2021 from 7.4 per cent in March 2020.7 During this period, corporates – majorly high rated borrowers – have used bond market issuances to raise funds, which was mainly used for deleveraging.8 In 2020-21, the corporates issued bonds to the tune of Rs. 7.72 lakh crore as compared to Rs. 6.75 lakh crore in 2019-20, taking advantage of the declining corporate bond yields and lower spreads across issuer categories and rating spectrum.9 Going forward, sharp economic recovery, along with a pick-up in private investment and capex demand may lead to a buoyant credit growth in the present lower lending rate environment. 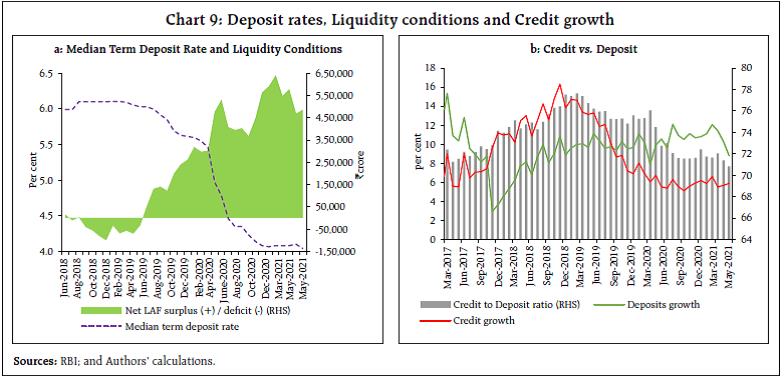 Decline in the cost of funds for SCBs The cost of funds and the cost of deposits for SCBs have been declining since 2015-16 and are now more closely aligned to repo rate reflecting improving sensitivity of banks’ balance sheet to policy rate changes (Chart 10). This reduction in the cost of funds for commercial banks augurs well for transmission to lending rates even in respect of sectors where loans continue to be linked to MCLR. Box II: Inter-relationship between Credit growth and Lending rates of banks In order to explore the nature of relationship among lending interest rates of commercial banks and credit growth, a structural VAR using a set of five endogenous variables are considered – Index of Industrial Production (IIP) growth rate; consumer price index (CPI) inflation; credit growth rate; repo rate; and weighted average lending rate (WALR) on fresh rupee loans sanctioned by banks. The period of study is from January 2014 to February 2020. The SVAR model having five endogenous variables is represented by the following equation: where, r’ = (IIP growth; inflation, repo, WALR, credit growth,)’, k is the order of lag length. Based on the set of conditions, we chose VAR framework with variables in level form. We chose the lag length of 2 based on Akaike Information Criteria. The regression diagnostics were found to be satisfactory, i.e. (a) there was no residual auto correlation and (b) all Eigen values were inside the unit circle. Results The impulse response function indicates that increase in lending rates of SCBs leads to decrease in credit growth. The change in lending rate impacts credit growth with a lag of four months and reaches its peak in seven months. The impact of change in lending rate on credit growth persists for nine months. |
 V. Impediments to Transmission The Reserve Bank has made several attempts to improve the effectiveness of monetary transmission by refining the process of interest rates setting by banks. The recent development in respect of transmission to deposit and lending rates has shown improvement. However, there are several factors which continue to impede monetary transmission to deposit and lending rates of banks. Mismatch of banks’ assets and liabilities: Term deposits have relatively long maturity profile and are contracted at fixed rates (Mitra and Chattopadhyay, 2020). When policy rate changes, the interest rate on term deposits are re-priced at the margin – i.e., only in respect of deposits that mature and get renewed. However, loans – though skewed towards the longer term – are contracted mostly at floating interest rates (Table 5), resulting in the duration mismatch of banks’ assets and liabilities. | Table 5: Shares of Fixed and Floating Rate Loans – Bank Group-wise | | (in per cent) | | Bank Group | Fixed rate rupee loans | Floating rate rupee loans | Others | | Sep-19 | Mar-20 | Mar-21 | Sep-19 | Mar-20 | Mar-21 | Sep-19 | Mar-20 | Mar-21 | | Public Sector Banks (11) | 13.4 | 13.3 | 13.1 | 84.4 | 85.0 | 85.0 | 2.2 | 1.7 | 2.0 | | Private Sector Banks (22) | 37.6 | 38.9 | 36.8 | 61.3 | 60.1 | 61.9 | 1.1 | 1.0 | 1.2 | | Foreign Banks (42) | 49.2 | 50.0 | 48.2 | 44.9 | 45.2 | 50.4 | 5.9 | 4.8 | 1.4 | | SCBs (75) | 24.1 | 24.2 | 23.4 | 74.0 | 74.2 | 74.9 | 1.9 | 1.6 | 1.7 | Note: (i) Figures in parentheses refer to the number of banks. (ii) Others include staff loans, DRI advances, internal PLR.
Source: Information collected from banks; and Authors’ calculations. | Internal benchmark for pricing of loans: Legacy of internal benchmark linked loans (BPLR, base rate and MCLR) - which together comprised 71.5 per cent of outstanding floating rate rupee loans as at end-March 2021 - impeded transmission. 8.6 per cent of floating rate rupee loans were still linked to the BPLR and base rate even though the Reserve Bank had moved to MCLR based regime over five years ago. The share of loans linked to MCLR stood at 62.9 per cent as of March 2021. The opacity in interest rate setting processes under internal benchmark regime hinders transmission to lending rates, although as noted earlier the EBLR regime is indirectly also leading to moderate improvement in transmission to MCLR based loan portfolio. Competitive pressure from small saving schemes: Higher interest rates offered by competing saving instruments such as small saving schemes and debt mutual fund schemes have impeded transmission especially during the easing cycle. The interest rates on small saving schemes, administered by the central government, in principle are set with a lag on a quarterly basis since April 2016 and are linked to the secondary market yields on G-secs of comparable maturities. The interest rates on the various small savings instruments, after being lowered sharply during Q1:2020-21 in alignment with the formula-based rates, were left unchanged during the remaining quarters of 2020-21 and Q1, Q2 of 2021-22. The interest rates on various instruments were 46-179 bps higher than the formula based rates for Q2:2021-22, with implications for monetary transmission. Asset quality of SCBs: Deterioration in the health of the banking sector and the expected loan losses in credit portfolios induced large variability in spreads in pricing of assets, severely impacting monetary transmission (John et. al 2016). Heterogenous pricing methodology of NBFCs: Another factor contributing to weak transmission in the credit market is that NBFCs do not follow a uniform methodology in the pricing of loans. While some NBFCs use their own prime lending rates as interest rate benchmark, others use base rates or MCLRs of banks as external benchmarks; a few do not even have an interest rate benchmark for their loan pricing. VI. Conclusion Monetary transmission in the current easing cycle so far has been full across the money market segments and corporate bond market mainly on account of liquidity augmenting measures, including unconventional measures, taken by the Reserve Bank. The transmission in the G-Sec market, however, was hindered by elevated fiscal deficit resulting in high market borrowings in the wake of COVID-19. In the credit segment of financial markets, transmission to lending and deposit rates showed significant improvement since the introduction of external benchmark system in October 2019. The transmission improved further since March 2020 owing to persistent liquidity surplus amidst weak credit demand. Over the years, the Reserve Bank’s efforts in improving transmission to deposit and lending rates of banks have started to bear some fruits particularly with the introduction of the external benchmark system. The share of outstanding loans linked to external benchmark has increased from as low as 2.4 per cent during September 2019 to 28.5 per cent during March 2021. The external benchmark system has incentivised banks to adjust their term as well as saving deposit rates as lending rates undergo frequent adjustments in line with the benchmark rates, to protect their net interest margins thus broadening the scope of transmission across sectors that are not even linked to external benchmark. Nonetheless, several impediments to transmission to lending rates persist, which call for resolution on a fast clip. References: Acharya, V. V. (2017), “Monetary Transmission in India: Why is it important and why hasn’t it worked well?”, Inaugural Speech delivered at the Aveek Guha Memorial Lecture organised by Tata Institute of Fundamental Research (TIFR) at Homi Bhabha Auditorium, Mumbai, November 16. https://www.rbi.org.in/Scripts/BS_SpeechesView.aspx?Id=1049 John, J., Mitra, A.K., Raj, J. and Rath, D.P. (2016), “Asset Quality and Monetary Transmission”, Reserve Bank of India Occasional Papers, Vol 37 (1&2), 35-62. https://rbidocs.rbi.org.in/rdocs/Content/PDFs/02AQM02052018497C8F678B464E2CAA89D46CE2FDFEEA.PDF Mitra, A.K. and S.K. Chattopadhyay (2020), “Monetary Policy Transmission in India – Recent Trends and Impediments”, Reserve Bank of India Bulletin, March 2020. https://www.rbi.org.in/Scripts/BS_ViewBulletin.aspx?Id=18822. Reserve Bank of India (2017), “Report of the Internal Study Group to Review the Working of the Marginal Cost of Funds Based Lending Rate System”. https://www.rbi.org.in/Scripts/PublicationReportDetails.aspx?UrlPage=&ID=878. ………….. (2021), “State of the Economy”, Reserve Bank of India Bulletin, April 2021. https://www.rbi.org.in/Scripts/BS_ViewBulletin.aspx?Id=20202.
|