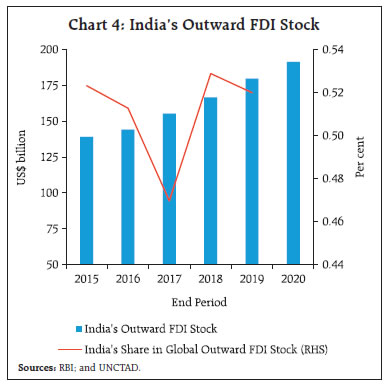
As India battles the ferocious rise of new infections, a strong policy response is building. Economic activity in India is holding up against COVID-19’s renewed onslaught. Apart from contact-intensive sectors, activity indicators largely remained resilient in March and grew beyond pre-pandemic levels. The resurgence in COVID-19, if not contained in time, risks protracted restrictions and disruptions in supply chains with consequent inflationary pressures. Pandemic protocols, speedier vaccination, ramping up hospital and ancillary capacity, and remaining resolutely focused on a post pandemic future of strong and sustainable growth with macroeconomic and financial stability is the way forward. In the fourth month of the Year of the Recovery (2021)1, humanity’s future hangs on a pendulum, oscillating between hope – vaccination – and despair – vaccine nationalism; and vaccine hesitancy. On the side of hope, there is a glacial and unequal pace – with 890 million doses administered as on April 21, 2021, only 11.3 per cent of the global population has been vaccinated (Chart 1a and 1b). If global herd immunity requires two doses of vaccine for 75 per cent of the world’s 6 billion adults, 9 billion doses have to be delivered of which 970 million have been supplied so far2. On April 1, India extended vaccination coverage to all citizens above 45 years of age and 18 years and above on May 1; still, the 300 million target by end-August will require an average of 3.5 million shots per day, about 13 per cent higher than the current pace. 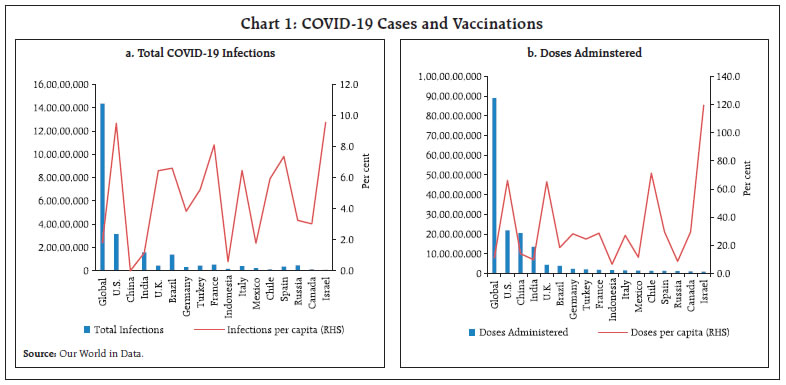 Meanwhile, the virus morphs and mutates, deadlier and faster with every new strain (Chart 2). Alarmed by rising daily caseloads and the frantic need to vaccinate nationally, export restrictions have begun, alongside propaganda. In fear, several countries have suspended inoculation rollouts and vaccine scepticism is rife, compounding what was already a highly unequal distribution, and undermining confidence in a shared COVID-free future. We must cooperate and immunise all of us. The pandemic will not be over until it is over everywhere. India, with 60 per cent of global vaccine manufacturing capacity, the third highest number of doses administered domestically, and exports to 95 countries, can show the way (Chart 3). 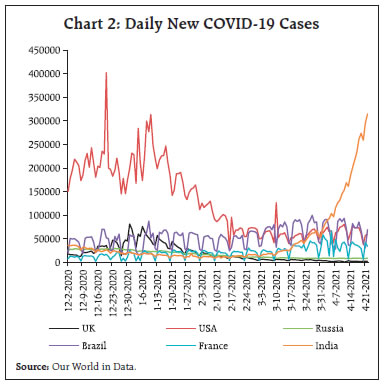 India is showing the way, as pointed out recently, in investing overseas. The stock of outward investment from India is small, just US$ 180 billion at end 2019, 0.5 per cent of global stock of foreign direct investment (FDI) (Chart 4). While global stock of outward FDI for end 2020 is unavailable, India’s outward FDI surged to US$ 191 billion by then. The Indian way shows that in foreign direct investment, it is never how much but how. India’s image is strengthened by its FDI being favourably perceived by the world relative to peers, not as a geopolitical scheme or hegemonic ambition (The Economist, April 17, 2021). A key difference lies in the fact that Indian investments are led by the private sector, which undertakes these ventures purely for commercial reasons, unlike state-controlled enterprises where business and political intentions inevitably get intertwined. On top of this, India’s large diaspora in these countries also adds positively to the image of India Inc. 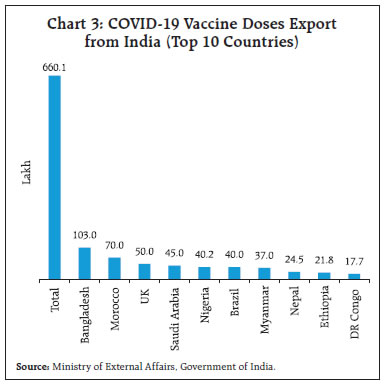
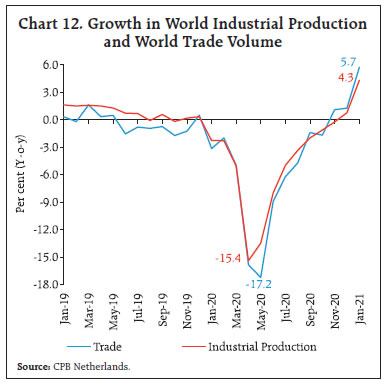
 Four markers watched stormy March3 give way to April’s spirit of youth4 that will keep hopes alive despite rising infections. First of all, the Central Government in exercise of the powers conferred by section 45ZA of the Reserve Bank of India Act, 1934 notified the inflation target for the period beginning from the first day of April, 2021 and ending on the March 31, 2026 in the Gazette of India as 4 per cent CPI headline inflation with an upper tolerance level of 6 per cent and a lower tolerance level of 2 per cent (Exhibit 1). By preferring continuity and consistency, the Government has ‘bailed in’ the gains in terms of a decline in inflation volatility and more credible anchoring of inflation expectations that has contributed to the macroeconomic stability and credibility it has earned since it instituted this monetary policy framework in 2016, including multilateral endorsement (Bauer, 2018). 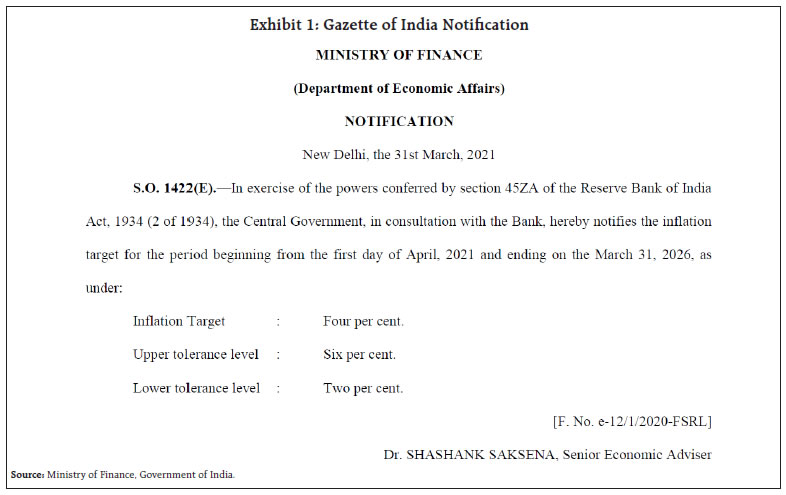 The monetary policy framework is a shining example of monetary-fiscal coordination in which the Government sets the target and the Reserve Bank achieves it. In that sense, the inflation target of 4 per cent becomes a joint responsibility. It is a flexible framework with tolerance bands and a dynamic accountability requirement that abjures ‘cold turkey’ and disruptive losses of output. With inflation aligned with the target over the period 2016-17 to 2019-20 (excluding the period of the COVID-19, which saw severely distorted macroeconomic outcomes) and remaining below the emerging market and developing economies’ (EMDEs’) average, India engages with the global economy with the confidence of price stability. The novelty is forward-looking behaviour, which enhances policy credibility and room for manoeuvre. Does the focus on inflation targeting mean a neglect of other objectives such as growth and financial stability? When inflation goes beyond the comfort zone, the exclusive concern of monetary policy must be to bring it back to the target. When inflation is within the comfort zone, authorities can look to other objectives – the objective of control of inflation is not independent of the objective of growth, and this is enshrined in the amended RBI Act5. Globally, monetary policy has entered a twilight zone and until clarity emerges on the shape of the future, it is important to entrench India’s nominal anchor at 4 per cent CPI headline inflation so that it can continue to perform its stabilising role. Threshold estimates work out to 6 per cent, beyond which tolerance of inflation can be harmful to growth and hence, the case for the current tolerance band of +/-2 per cent rests. The Government’s decision has been well received by the media, which has welcomed inflation targeting remaining the centrepiece of the monetary policy framework and sees it as a signal that the fiscal and monetary authorities are in lockstep in ensuring the primacy of price stability as the bedrock for all macroeconomic development6. Second, the RBI turned the page on an eight decades old tradition of reckoning its accounting year from July to June and on April 7, it released its first monetary policy statement for its new accounting year April-March 2021-22. Every monetary policy is different, but this one was unique. Complementing the decision of the monetary policy committee (MPC) to keep the policy rate unchanged and persevere with its stance maintaining it low for longer, Governor Shri Shaktikanta Das unleashed the Brahmastra and the RBI stepped off into hitherto uncharted terrain. Named G-SAP, it commits the RBI upfront for the first time to the acquisition of a specified amount of government securities in a specified period of time. It is different from open market operations in that the RBI cedes discretion in the interest of supporting the market; it delivers on the RBI’s promise of sustaining comfortable liquidity conditions in a flexible, state-contingent manner regardless of market movements; it helps market participants plan their engagement with the borrowing programme better. It is not monetisation of the budget deficit as it involves only secondary market operations. There are risks of asset bubbles, currency depreciation and capital flight associated with it, but the balance of risks lies in favour of G-SAP 1.0 engendering congenial prospects for financial conditions and paving the way for a durable economic recovery. It involved a testing judgment call; now, the die is cast. And it is named G-SAP7 1.0 with a purpose – it’s just a begining!8 It should bring about an ebbing of bond market tempests, especially the unwinding of trade positions caught offside and out of line with fundamentals (Chart 5). Policy makers know from painful experience that it is perilous to withdraw stimulus too soon; that inflation is less sensitive to demand pressures than once feared; that central banks will lean towards growth in pandemic times, knowing that inflation is still only catching up. But when markets cannot keep the faith and take the inverse bet - that monetary policy cannot stay loose for long – they are frontrunning the economy. By anticipating monetary policy tightening, markets may bring it about sooner than it is right. The most challenging moment can be as the recovery sets in - the hours before the dawn can be the darkest. Adam Smith saw markets as “living institutions, embedded in the culture, practice, traditions and trust of their day”9. With all central banks so heavily invested in the recovery, it is worthwhile for markets to pay heed to central bank speak. As Christine Lagarde, President of the European Central Bank, recently pointed out: “While we believe 2021 will be the year of the recovery, we don’t see it happening until the second half of 2021, and any yield increase that could act as a bit of a brake is undesirable.”10 With economic activity still reeling from the historic magnitude of the COVID-19 shock, rising borrowing costs will pivot the narrative from the speed of a post-pandemic recovery to its sustainability. Governments will target sustainable growth now and backstop entire sectors of the economy that have undergone long-term scarring through the pandemic even at the cost of running high debts and deficits. Central banks have provided the indispensable channel for this via purchases of government debt in a historic symbiosis of fiscal and monetary policy. 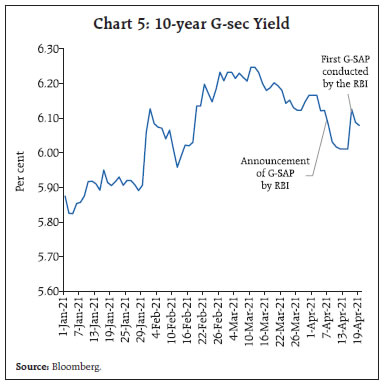 Third, the April 12 release of the reading on consumer prices for March 2021 showed retail inflation edging up to 5.5 per cent but still within the tolerance band. This has an important bearing on the setting of monetary policy. The pandemic caused elevation in inflationary pressures stemming from input and intermediate cost increases and widening margins that essentially reflect supply disruptions rather than release of pent-up demand. CPI data for April-June 2020 were regarded by the MPC as a break in the series since price relatives could not be collected and had to be imputed. Since then, there were two consecutive quarters during which inflation breached the tolerance band. In Q4 (January-March 2021) - the crucial third quarter in succession that could have triggered the accountability clause – the outcome breaks that morbid spiral: inflation has averaged 4.9 per cent during the quarter. This releases monetary policy from the ‘failure to maintain the inflation target11’ clause enshrined in Section 45ZN of the RBI Act. In the event of a failure, the Reserve Bank has to set out in a report to the Central Government (a) the reasons for failure to achieve the inflation target; (b) remedial actions proposed to be taken by the Bank; and (c) an estimate of the time-period within which the inflation target shall be achieved pursuant to timely implementation of proposed remedial actions. Remedial actions to return inflation to target over a specified period during the time of the pandemic would surely have taken a deleterious toll on the formative and hesitant recovery. Notably and justifiably, the monetary policy framework has no escape clause! Fourth, on March 31, a vital statistic quietly slipped its moorings and slid into the public domain, largely unnoticed, but carrying considerable macroeconomic significance. India’s current account balance, which had been recording surpluses from January 2020 through September, flipped and turned into a slender deficit of 0.2 per cent of GDP in Q3:2020-21 (Chart 6a). More recently available data on merchandise trade suggest that the deficit may widen modestly in Q4 of 2020-21 (January-March). The balance of payments has an introspective character in the national accounts – it holds up a mirror to the rest of the economy. The excesses or shortfalls of other sectors of the economy show up in these external accounts. It is in this context that the shift in the current account into a deficit after three quarters of surplus acquires meaning. Breaking down the national accounts identity reveals that the current account balance is the mirror image of the saving investment balance (Chart 6b). Accordingly, the current account deficit indicates that after a long hiatus, the investment rate could be finally coming to life, having exceeded the domestic saving rate as it should for an economy that is growing and not only using up all domestic resources but also supplementing them with inflows of foreign resources. The uptick in investment is also corroborated by the National Statistical Office’s (NSO) estimates for Q3:2020-21 of gross fixed capital formation (GFCF), which have turned up into positive territory after being in contraction for two consecutive quarters. The share of GFCF in aggregate GDP inched up to a six-quarter high at 33.0 per cent in Q3:2020-21. Within saving too, there is a compositional shift underway among institutional sectors, reflecting the normalisation of economic activity. Preliminary estimates indicate that household financial saving plateaued to 8.1 per cent in Q3:2020-21 from a high of 21.4 per cent in Q1 as precautionary saving in response to the pandemic is being unwound. At the same time, a surge in retained earnings is boosting saving by the non-financial corporate sector, which registered a sharp increase in Q3. At this juncture, therefore, the Indian economy is at a cusp and a virtuous combination of public and private animal spirits can ignite a shift towards investment that is supported by the normalisation of panic saving by households and build-up of saving by businesses. 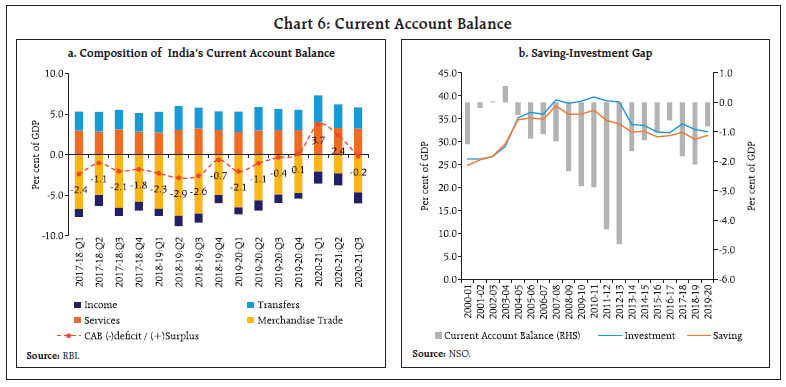 Amidst the rites of passage from March to April, the pandemic cleared the mind and focused attention on the quality of growth. As a result of the pandemic’s impact on economic and social activity worldwide, global carbon dioxide emissions fell by more than 2 billion tonnes in 2020 — roughly double of Japan’s yearly emissions, after rising steadily for decades (Chart 7). The United States accounted for nearly a quarter of this reduction, with a drop in emissions by more than 600 million tonnes. India followed, with a reduction of around 200 million tonnes12. India’s CO2 emissions reduction in 2019-20 was the first year-on-year fall in four decades13. 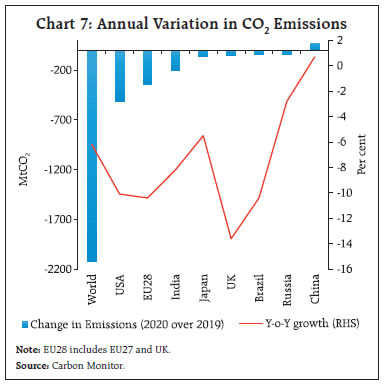 With heightened levels of the risk of the earth warming beyond a critical threshold, three elements will define the way we live, going forward: fresh water resources; green energy; and clean air. Water is precious; it touches every aspect of sustainable development. Managing water means access to drinking water, sanitation, hygiene, wastewater, environment and health – sustainable developmental goal number 6 (Chart 8). Commemorating World Water Day on March 22, India launched ‘Catch the Rain Where it Falls, When it Falls’14 emphasising the importance of water harvesting. Mahatma Gandhi National Rural Employment Guarantee Act (MNREGA) offers a way - rainwater harvesting pits; de-silting check dams and lakes; repairing tank bunds; rejuvenating storm water drains using Google Earth; constructing soak pits and krishi hondas in farms; constructing tanks for livestock; creating new tanks; and recharging borewells – with upward revisions in daily pay for these activities. It is sobering to note that of the mean annual precipitation India receives, more than 70 per cent is lost by way of evaporation and other factors. 75 percent of households in India lack access to drinking water on their premises. India stands at 120 out of 122 countries in the water quality index15. Fresh drinking water is within our reach, but we must make every drop count16. In this context, the Jal Jeevan Mission launched on August 15, 2019 with the goal of “Har Ghar Jal” could prove to be the gamechanger. 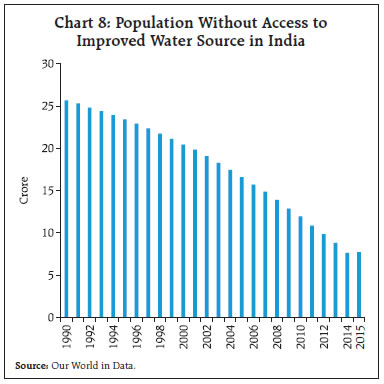 Using clean, renewable energy is going to be the most important action to reduce environmental degradation. Electricity production is the biggest source of greenhouse gases. Renewable energy generation is, therefore, key to a world with a clean and sustainable energy future (Chart 9). India’s efforts to expand the access of its population to green energy has been drawing international acclaim. On April 6, the US Presidential Envoy for climate, Mr. John Kerry, in his keynote address at the annual leadership summit of South Asia Women in Energy, referred to India as a “red hot investment opportunity because of its clean energy transition”17. As the deadline of December 2022 for achieving 175 gigawatt (GW) of renewable energy (RE) capacity draws closer, India faces a formidable task with an installed capacity of only 93 GW as of March 2021. Since the launch of the National Solar Mission plan in 2010, 39 GW of solar energy capacity has been installed, as against the target of 100 GW. The wind segment saw an addition of 37.7 GW in the last decade, as against the targeted capacity of 60 GW. Rooftop solar has seen the slowest growth, with capacity addition standing at a meagre 4.4 GW as of March 2021. Merely 430 megawatts (MW) of rooftop installations materialised in 2020, as against the year’s target of 3,000 MW. The production-linked incentive scheme for high efficiency solar photovoltaic modules approved by the Cabinet on April 7 is expected to add 10,000 MW of integrated solar PV manufacturing capacity. If India has to meet expectations of being the largest contributor to the renewables upswing in 2021, with additions to capacity doubling from 2020, it needs to raise its act to a whole new level. 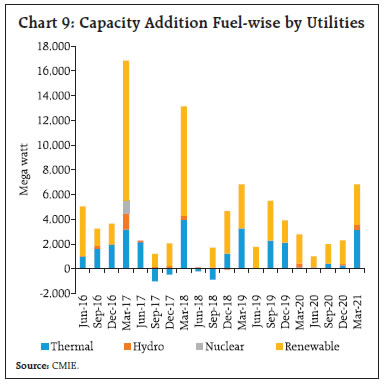 On April 5, the India Meteorological Department (IMD) declared the all India average monthly maximum temperature during March 2021 at 32.65 degrees Celsius as the warmest in the last 11 years, and the third warmest in the last 121 years. The economics of climate change in terms of the debilitating effects of global warming on economic activity have been recognised since the time of Alfred Marshall18. The emission of greenhouse gases19 has the effect of trapping the heat in the atmosphere, stoking floods, droughts, and more. Reducing the emission of greenhouse gases could prevent up to 3 million premature deaths annually by the year 210020. Reducing carbon emissions, replacing fossil fuels with cleaner alternatives, and improving energy efficiency is the way to go in this regard. Although India is now the planet’s third-largest emitter of carbon dioxide, in per capita terms, India’s emissions are ranked 140th in the world (the United States is 14th and China is 48th). In its third biennial update report (BUR-III) submitted to the United Nations Framework Convention on Climate Change (UNFCCC) on February 20, India declared that the country’s emission intensity (per unit of GDP) has reduced by 24 per cent between 2005 and 2016, and therefore, it is “on track to meet its voluntary declaration to reduce the emission intensity of GDP by 20-25 per cent from 2005 levels by 2020”. Furthermore, India is focused on reaching its commitment made under nationally determined contributions (NDCs) to improve the emissions intensity of its GDP by 33 to 35 per cent by 2030 below 2005 levels. India’s NDC estimates that the country will require ₹162.5 lakh crore (US$ 2.5 trillion) from 2015 to 2030, or roughly ₹11 lakh crore per year, for effective climate action. As against this requirement, Climate Policy Initiative finds that the average green finance flows amounted to ₹1.24 lakh crore per annum during 2016-1821. Attracting substantial green investment flows is thus key to realising the country’s climate goals. In central banks, a green revolution is underway. They grapple with the reality of climate change, which is affecting economic activity in ways that monetary authorities cannot ignore any longer, including in the context of their central remits – price and financial stability. The environment is slowly making its way into central bank mandates, as the March edition of this article pointed out. It is in this sense that the toolkit offered by the Network for Greening the Financial System (NGFS) assumes importance in guiding central banks on how to deal with climate change. The question is: should it be a passive approach of pricing climate risk or should it go beyond and tilt the allocation of capital in the economy towards decarbonisation? Set against this backdrop, the remainder of the article is structured into five Sections. Section II captures in a nutshell the rapidly evolving developments in the global economy. The underlying impulses in the domestic economy are distilled in Section III. Section IV evaluates financial conditions, and the last Section sets out concluding observations. II. Global Setting Global economic activity is besieged by the resurgence in caseloads and new mutations of the virus just as visceral effects of the slowdown in Q4:2020 were ebbing and improving prints of available high frequency indicators were suggesting that a gradual but uneven recovery might be underway in Q1:2021. Rising vaccine rollouts, additional fiscal stimulus by a few large advanced economies (AEs), with positive spillovers expected for the rest of the world and relatively better adaptability of most countries to the recent waves of the virus, have infused optimism that the world will survive the new virulent visitations of COVID-19. Accordingly, the world economy is set to grow at its fastest pace in decades, as mirrored in the latest projections for 2021 by the International Monetary Fund (IMF) in its April 2021 release of its World Economic Outlook (WEO). Assuming broad vaccine availability in AEs and some emerging market economies (EMEs) by the summer of 2021 and in most other countries by the second half of 2022, the IMF has revised up the global growth projection for 2021 to 6.0 per cent from 5.5 per cent projected in its January update, followed by 4.4 per cent growth in 2022 (Chart 10). The strength and pace of the recovery is, however, expected to remain uneven across as well as within countries as it would largely hinge on the speed of vaccination, extent and effectiveness of policy support and country-specific structural factors. Key measures from the IMF in its flagship publications, viz., the WEO, the Global Financial Stability Report (GFSR) and the Fiscal Monitor indicate a phased approach to the pandemic. The first phase should be geared towards breaking out of the current crisis by ensuring adequate vaccination. Fiscal policy should be targeted towards supporting affected households and firms. Monetary policy should remain accommodative, while providing clear forward guidance to the markets. It is critical to safeguard financial stability by early action targeting specific pockets of vulnerabilities through select macro-prudential tools. In the second phase, as the pandemic recedes durably and recovery gains traction, short-time work programmes should be scaled back, supplemented with transitional income support, with an emphasis on reskilling and retraining of workforce. Non-performing assets management should be strengthened, and bankruptcy procedures expedited. Fiscal space should be rebuilt through increased revenue buoyancy, greater tax progressivity and by rationalising expenditure. In phase three, as the health crisis ends, the focus should shift towards addressing climate change challenges, including by way of carbon pricing and building resilient, inclusive and greener economies, and on resolving the issue of debt. With fresh rounds of fiscal stimulus by the Biden administration, the United States (US) economy is expected to surpass its pre-pandemic GDP level in 2021 itself, while most other AEs are expected to return to their pre-COVID levels not before 2022. Among EMEs, a similar divergence could be expected, with China having returned to its pre-COVID level in 2020 itself and most other economies of the group not expected to attain their end-2019 levels until well into 2023. The American Rescue Plan (US$ 1.9 trillion), has bolstered optimism around a relatively faster global recovery, as it is expected to wipe out spare capacity in the US economy and create positive spillovers on demand and output in a number of other countries, especially its trading partners – when it rains on the priest, it drips on the parish clerk. China and India’s exports to the US could be boosted by around US$ 60 billion and US$ 9 billion, respectively, in 2021-2222. Households across the US, the United Kingdom (UK), Japan, China and the biggest nations of the Euro area have built up excess savings during the pandemic period – consumers in the world’s largest economies have saved around US$ 2.9 trillion during the pandemic period, with a significant portion in the form of liquid assets.23 The unwinding of these savings in the current phase is expected to boost consumption demand and fuel overall growth. Despite these early signs of stabilisation, the global economic outlook is increasingly mired in looming uncertainties, with the pace of vaccination diverging vastly across geographies. The European suspension of the vaccination programme has deepened tensions within the European Union (EU) over vaccine usage amidst delivery shortfalls. Even though the EU’s vaccination rollout has picked up in recent weeks, the vaccine disparities between the rich and poor member states seem to be rising.24 The US has invoked the Defence Production Act that grants the US President broad industrial mobilisation powers to increase vaccine production and control the export of raw material; thereby stifling shipment of raw materials for other manufacturers including India. Among the available high frequency indicators, the global composite purchasing managers’ index (PMI) for March 2021 scaled a 79-month high, marking one of the best readings in the past decade, as business activity picked up amidst robust manufacturing and reviving services sectors. The upturn was led by the US, with Germany, the UK, India and Australia following and registering expansion rates above the global average. Global manufacturing PMI increased to a ten-year high level with output, new orders and employment gaining further momentum, even as capacity pressures stemming from severely stretched supply chains pose a major headwind risk to the sector. The global services PMI too continued to improve, crossing a 33-month high level in March, with activity showing signs of revival across major AEs, barring the Euro area (Chart 11). World industrial production has exhibited a marked improvement, growing by 4.3 per cent (y-o-y) in January and surpassing its pre-pandemic level. On the trade front, the latest release by the World Trade Organization (WTO) reported a 5.3 per cent decline in world merchandise trade volume in 2020, albeit less severe than the initial projection of a decline of 9.2 per cent. The recovery seems to have continued into 2021: the latest data release by the Central Planning Bureau (CPB) Netherlands points to a growth of 5.7 per cent in world merchandise trade in January 2021 over its level a year ago – its highest growth since October 2018 – underpinned by robust trade performance by China and developed Asia (Chart 12). For 2021, world merchandise trade is projected to grow by 8.0 per cent, followed by 4.0 per cent in 2022 (WTO). 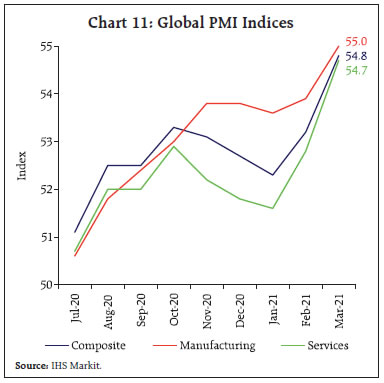
 As for services trade, the latest reading of the WTO’s Services Trade Barometer (104.7) reflects a turnaround in Q4:2020, although travel services registered an overall decline of 63 per cent in 2020 and is expected to stay weak till the effect of the pandemic wanes. Moreover, with the third wave of the virus striking, the tourism sector is likely to trail below pre-pandemic levels, prolonging the weakness in travel and transport services further. For Q1:2021, data available so far emit mixed signals, with financial services, container shipping and construction remaining above trend while air transport and information, computers and telecom (ICT) index showing weakness. World trade is also hamstrung by fresh bouts of shipping hassles/delays, including the blockage of the Suez Canal by one of the largest container ship Ever Given, that lasted for six days and held up an estimated US$ 9.6 billion of trade per day as data from Lloyd’s list suggest.25 In the US, the labour market continues to recover as reflected in non-farm payrolls increasing to a 7-month high at 9,16,000 in March, almost double the level recorded in February. The US economy is still about 8.4 million jobs short of the peak in February of 2020. In the UK, better than expected PMIs, business surveys and official data point to a strong uptick in activity in March. In February, the unemployment rate unexpectedly fell, and joblessness is now much lower than forecast earlier26. In the euro area, unemployment rate though stable, remains above the pre-pandemic level, with countries highly dependent on tourism, viz., Spain and Greece recording highest rates of unemployment among their peers. Japan’s unemployment rate has been hovering around 3 per cent since May 2020 – less than the level recorded during the global financial crisis, however, the sidelined workers27 have increased by 5,00,000 to 2.44 million when compared to January 2020, with accommodation and food services industries being the hardest hit and recording most of such hidden unemployment28. As per the latest estimates by the IMF, the two-decade long trend of global poverty reduction seemed to have reversed with almost close to 95 million more people expected to have fallen below threshold poverty in 2020. Crude oil prices, after rallying close to US$ 70 per barrel in mid-March following an attack on Saudi Arabia’s oil facility, underwent corrections on near-term demand concerns amidst rising infections, suspension of vaccine rollouts in some parts of Europe, supply worries caused by the Organization of the Petroleum Exporting Countries (OPEC) plus decision to ease oil production cuts between May and July, and build up in US crude inventories. Prices pared some losses in the second week of April on upbeat economic data for China and the US, and higher demand forecasts by OPEC and International Energy Agency (IEA). At US$ 65.4 per barrel as on April 23, 2021, brent crude oil prices registered 27.8 per cent gain on year to date basis (Chart 13a). Gold prices have been easing on rising bond yields and the strengthening US dollar, registering a decline of 10.0 per cent in Q1:2021. In April so far, prices have shown some pickup as both US bond yields and the US dollar have eased, while rising inflation concerns and improving Chinese demand have added to the upside (Chart 13b). Base metal prices ruled at an elevated levels on robust industrial activity and persistent supply chain disruptions. Mounting demand worries, pullback in Chinese demand and the recent episode of the Suez Canal blockage, imparted some volatility, with most metal prices, barring aluminum, consolidating in March. In April so far, prices for most metals have edged up, supported by weak dollar and strong economic data (Chart 13c). There are increasing signs that yet another super-commodity price cycle might be building up, with several food and non-food commodity prices trading at elevated levels. Such synchronised increases in commodity prices, together with highly accommodative monetary policies and additional fiscal stimulus, have added to inflation concerns, resulting in the rise of market-based indicators of inflation expectations, viz., the US 10-year break-even rate has climbed to 2.37 per cent in March - its highest level since 2013. 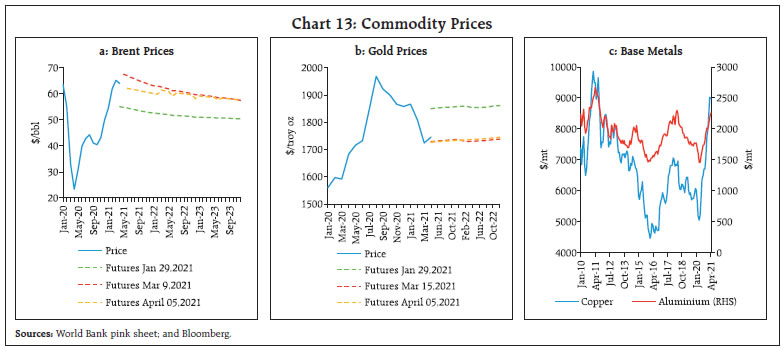 Financial markets remained buoyant, with vaccine and stimulus led recovery optimism fueling bullish sentiments. Following corrections during late February and early March, equity indices across major AEs surged, with the US S&P scaling a new peak in mid-April, spurred by improved recovery prospects in the wake of the American Rescue Plan, fast paced vaccination drive and strong data prints. Overall, the Morgan Stanley Capital International (MSCI) AE stock indices registered net gains of 4.5 per cent in Q1:2021 and 5.0 per cent gain in April so far (up to April 16, 2021). EME stock indices, on the other hand, have been shedding gains due to capital outflows since the latter part of February. In April, however, they exhibited mixed moves on country specific factors, with India’s Sensex witnessing sharp sell-offs amid resurgence of COVID-19 infections. Notwithstanding the sell-off in the second half of Q1, the MSCI stock indices for EMEs ended the quarter with a net gain of 1.9 per cent, with April registering a gain of 2.5 per cent so far (Chart 14a and 14b). Global initial public offerings (IPOs) reached a record in Q1:2021, with 727 issuance raising US$202.9 billions in proceeds. Such pick up was underpinned by strong IPO activity by special purpose acquisition companies (SPAC) in the US, raising US$96.0 billion in proceeds through 298 issuances.29 In the bond markets, US long-term yields, after rising sharply to multi-month high level in March on high reflation trade and inflation expectations, eased in April following the Fed’s indication to keep the policy rate low for long. Strong demand from Japanese investors and certain technical factors also added to the bond price rally, weakening yields further (Chart 14c). Other AEs, barring the Euro area, and most EMEs moved in sync (Chart 14d). In the currency market, the US dollar had rallied to a four-month high level in March marking a 3.7 per cent gain in Q1:2021. In April, so far it weakened on easing US treasury yields. Concomitantly, EME currencies, after depreciating for most part of Q1 following capital outflows since the second half of February, recouped some losses as reflected in 0.7 per cent appreciation in the MSCI Emerging Markets (MSCI-EM) index in April so far (up to April 16, 2021) (Chart 14e). According to the Institute of International Finance (IIF), portfolio flows to EMEs stood at US$ 10.1 billion in March, with equity and debt inflows accounting for US$ 3.9 billion and US$ 6.2 billion, respectively (Chart 14f). Relatively strong inflows in China, both in equity (US$ 3.8 billion) and debt (US$ 5.0 billion), supported overall portfolio flows to EMEs. The rapid rise in long-term US treasury yields, risks of possible reversal of policy stance and idiosyncratic events like increasing uncertainty in Turkey weighed on the outlook for EMEs, disrupting flows across the board (IIF, 2021). Grappling with inflation worries, some policy reversals were observed as central banks across a few EMEs resorted to rate hikes in March. Banco Central do Brasil (BCB) increased its policy rate by 75 basis points (bps) for the first time in six years with forward guidance of a likely similar magnitude of hike in the next meeting as inflation projections touched the upper bound of the target. The Bank of Russia (BoR), after maintaining a pause through Q4:2020, raised the policy rate by 25 bps, indicating that it is the beginning of a return to neutral monetary policy. Turkey, after maintaining a pause since its December rate hike, increased rates by a further 200 bps in March. The Bank of Japan, however, following a review of the measures taken under “quantitative and qualitative monetary easing with yield curve control”, has announced further effective and sustainable monetary easing in March, which includes launching of an interest scheme to promote lending and removal of the numerical target for yearly purchases of exchange-traded funds (ETFs) and real estate investment trusts (REITs) while retaining a ceiling for the purchases. Furthermore, it has indicated that the target range of fluctuations of 10-year Japanese Government bonds will be plus/minus 0.25 percentage points around the target of 0 per cent. On the fiscal front, total budgetary and below the line support offered globally amounted to US$ 16 trillion or 15.3 per cent of global GDP as of March 17, 2021 (IMF, Fiscal Monitor, April 2021), out of which US$ 10 trillion was in the form of additional spending or forgone revenue, and US$ 6 trillion in liquidity support, including government loans, guarantees, and capital injections. An adverse fall out has been that, global public debt has increased to 97.3 per cent of GDP in 2020, with AEs recording the largest deficits and debts, resulting from an equal decline in revenues and increases in government spending. In other regions, bulging deficits largely reflect plunges in revenues resulting from subdued economic activity. The near-term outlook remains fragile as rapid mutations of the virus, concerns over vaccine efficacy with regard to newer strains, mounting vaccine vacillation and uneven vaccine availability across economies pose downside risks. Furthermore, rallying commodity prices on demand-supply imbalances, together with continued monetary and fiscal support, entails upside risks for inflation, especially for EMEs, which squeezes policy headroom to support the recovery, going forward. Well calibrated policies aimed at facilitating a sustainable economic recovery is the need of the hour (IMF, 2021). III. Domestic Developments Several parts of India have been severely hit by the swift spread of the second wave of COVID-19. By April 23, 2021 the total number of active cases surged past the 25 lakh mark, from a low of 1.4 lakh in mid-February. The doubling rate30 has worsened manifold to around 36 days from 675 days in mid-February (Chart 15). With COVID-19 cases continuing to breach daily new highs, India rolled out a four-day ‘Tika Utsav’ or vaccination festival on April 11 – the ‘second big war against the virus’. Growing infections and consequent restrictions, though still local/ regional in nature, have imparted high uncertainty to the outlook. The Oxford Stringency Index has surged to around 70 in April 2021 from 60 in the preceding month, though it is still below 100 in April 2020. The impact of restrictions is also evident in the containment and health index surging over 80 in April 2021 from around 70 in the preceding month (Chart 16). 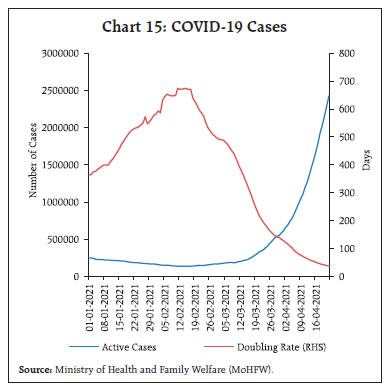 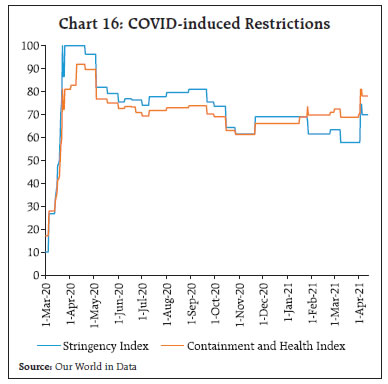 Overlapping the phased programme for vaccination, the Government has launched COVID Vaccine Intelligence Network (CoWIN), a digital platform where citizens can register themselves for the vaccination drive by booking an appointment at nearby vaccination centres. Vaccination is gaining pace, with cumulative administered doses surpassing the 13.5 crore mark on April 22, 2021. Of these, 3.3 crore doses have been administered to healthcare and frontline workers – the warriors combating the pandemic. While 5.5 crore doses have been administered to senior citizens, 4.7 crore doses have been administered to citizens aged 45 to 60 years. Initial vaccine hesitancy seems to have receded. In fact, in the month of April 2021, average daily doses were more than 32 lakh. Under Vaccine Maitri, 6.45 crore doses have been exported to 95 countries. Around 3.58 crore doses have been supplied to 25 countries under commercial contracts, 1.04 crore jabs to 44 countries as grants and 1.82 crore to 39 countries under the COVAX initiative31. In order to speed up the vaccination drive, the Drugs Controller General for India (DGCI) approved for emergency use of Russia’s Sputnik V in India on April 13, 2021. It is essential at this moment to ramp up the vaccination drive. Google mobility indicators indicate moderation in movement of people across all major cities in March 2021 compared to the baseline. The Apple mobility index also corroborates this moderation, particularly in Mumbai and Pune. Akin to a difference in difference analysis, changes in high frequency indicators for 2021 (March 01 to latest available data in April) are compared with their movement a year ago to obtain a comparative impact assessment of the second wave (Chart 17). While most of the indicators have registered moderation, it is guarded in 2021 so far – learning from the preceding year is coming in handy. On the other hand, the resilience of electricity generation so far is indicative of limited effects on consumer demand and industrial usage. Aggregate Demand Aggregate demand conditions have remained resilient. In its first monetary policy statement for 2021-22, the Reserve Bank retained its projection of real GDP growth for the year at 10.5 per cent (Chart 18). Collections under the goods and services tax (GST) in March 2021 at ₹1.24 lakh crore marked the highest monthly level in the series, remaining above the ₹1 lakh crore mark for the sixth consecutive month (Chart 19). Underlying the growth of 27 per cent in collections – revenues from imports and domestic transactions recorded growth of 70 per cent and 17 per cent, respectively is growing economic activity as well as improved compliance on the back of close monitoring against fake invoicing by using deep data analytics. 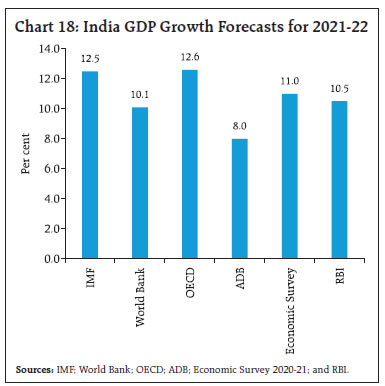 The regional distribution of GST collections reveals a broad-based pick-up, with states such as Odisha, Jharkhand, Gujarat, Rajasthan, West Bengal, Chhattisgarh, Tamil Nadu and Andhra Pradesh posting double digit growth in H2:2020-21 mirroring goods movement (Chart 20). E-way bill issuances expanded sharply to 7.12 crore in March – the highest monthly increase recorded in its history in the last three years. On the back of a favourable base effect, growth in E-way bills was impressive at 75.2 per cent y-o-y – intra-state by 76.3 per cent and inter-state by 73.5 per cent – indicating robust domestic trading activity. 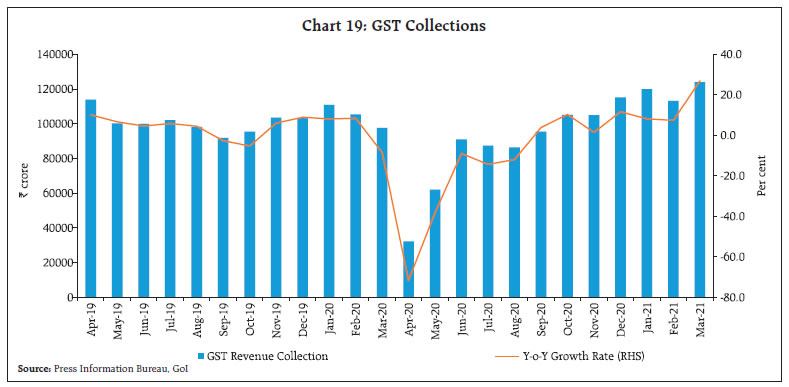 Turning to consumption demand, most indicators posted robust growth on a y-o-y basis. Fast moving consumer goods (FMCG) sales exhibited a growth of over 10 per cent during January-March 2021 – the highest in the last three years. FMCG sales, however, moderated in relation to October-December 2020.32 Petrol consumption registered a growth by 6.3 per cent in March 2021, compared to pre-pandemic levels of March 2019, even as diesel consumption contracted by 3.2 per cent. Average daily electricity generation in March registered a sharp uptick, growing by 23.3 per cent y-o-y. In April so far (April 21, 2021); it recorded a 101.6 per cent growth over April 2020, the month of the complete nation-wide lockdown. In comparison to a pre-pandemic baseline of April 2019, it registered a growth of 53.6 per cent. In the Reserve Bank’s March 2021 round of the consumer confidence survey, however, respondents expressed pessimism on the general economic situation, employment and prices. With higher essential spending recorded over a year ago, most consumers reported higher overall expenditure, which is expected to increase further going forward, despite continuing moderation in discretionary spending. 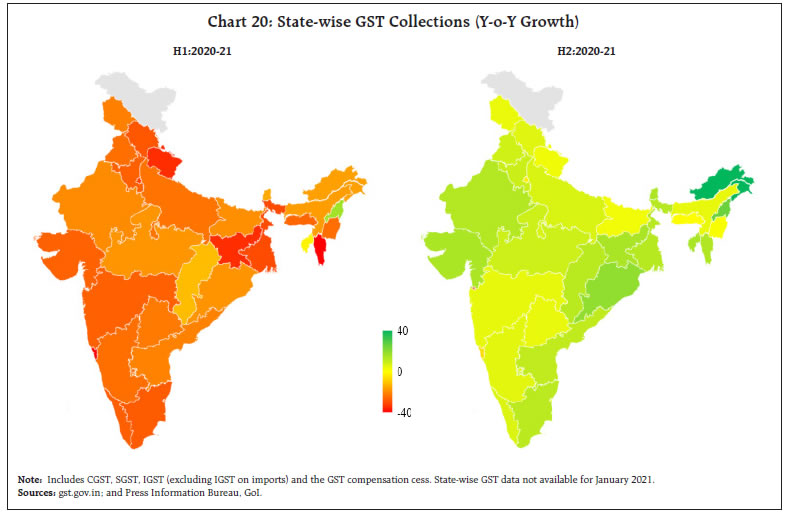 Most of the original equipment manufacturers (OEMs) of passenger vehicles (PVs) have reported triple digit growth in March, reflecting release of pent-up demand on the back of increased consumer preference for personal travel. On a sequential basis too, retail sales of PVs surged by over 10 per cent, according to the Federation of Automobile Dealers Association (FADA). Retail sales of commercial vehicles (CVs) continue to show signs of improvement after a slump of more than two years33. Two-wheelers’ wholesale sales by top five manufacturers soared by over 75 per cent. On the back of robust rural demand, the tractor segment continued its dream run that commenced in June 2020. Domestic air passenger traffic at around 77-78 lakh in March remained flat in relation to a year ago. According to Knight Frank India, the residential real estate market exhibited a sharp rebound in Q4:2020-21 with sales of residential properties across eight major cities growing by 44 per cent to nearly 72,000 units. The sharpest revival was seen in the cities of Mumbai and Pune where the state government slashed the stamp duties. 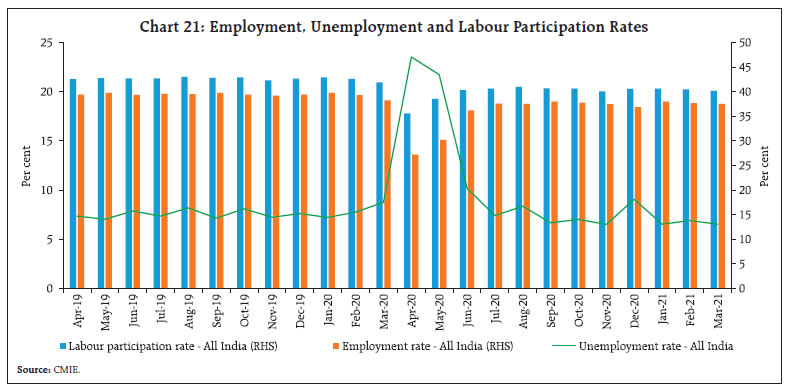 As per the household survey of the Centre for Monitoring Indian Economy (CMIE), employment conditions brightened in March, with the unemployment rate sliding to 6.5 per cent from 6.9 per cent a month ago. In the rural areas, the unemployment rate dropped to 6.2 per cent, while for urban areas, it inched up to 7.2 per cent (Chart 21). With digitalisation gaining pace and Information Technology (IT) firms winning a slew of global deals, hiring in the sector in 2021-22 could exceed the levels that peaked in 2011-12.34 The Boston Consulting Group (BCG) has estimated that the gig economy in India can support 90 million jobs in non-farm sectors and potentially add 1.3 per cent to the country’s GDP in the long term. In the short-to-medium term, nearly 24 million jobs in skilled, semi-skilled and shared services roles could be delivered via the gig economy. Latest data on the Naukri JobSpeak index show that hiring activity picked up in March 2021 (Chart 22). Job listings in March 2021 registered a growth of 24.7 per cent over a year ago on account of a favourable base effect and ongoing normalisation of economic activity. The retail sector also saw an uptick, with hiring improving by 15 per cent in March 2021 over the previous month. A spatial analysis shows that the growth in the index was broad-based across metros and major tier-II cities. With the second wave of COVID-19 infections forcing authorities to restrict the movement of people, activity in contact intensive sectors such as hotels, airlines and travel is set to suffer again. The UK recently added India to its travel ban list and the US has also instructed its citizens to avoid travel to India. This will further affect domestic travel and tourism industries. Google mobility for retail and recreations, which tracks mobility trends for places like restaurants, cafes, shopping centers, theme parks, museums, libraries and movie theatres shows a steady decline in activity across states (Chart 23). The latest Google Mobility Report shows that mobility across places of retail and recreation dropped 24.2 per cent in March-April so far (April 16, 2021) compared to a decline of 22.7 per cent below the baseline in February. States of Maharashtra, Gujarat and Delhi, with a wider spread of COVID-19 cases are also recording a sharper drop in mobility; significantly below the national average. A cross-country comparison of unemployment rates reveals that in India, the unemployment rate has reverted to pre-pandemic levels after the sharp rise seen in April 2020. The current rate of unemployment in India is somewhat similar to that in the US, Canada and the EU (Chart 24). India’s merchandise exports recorded an all-time monthly high of US$ 34.4 billion and imports of US$ 48.4 billion in March 2021, reflecting a rebound in global demand, revival in domestic activity and the impact of a favourable base effect. Consequently, exports clocked an impressive growth of 60.3 per cent in March (Chart 25a and 25b). Export growth was broad-based as 28 out of the 30 major sectors accounting for 92.1 per cent of total exports registered positive growth, with engineering goods, gems and jewellery, drugs and pharmaceuticals and chemicals being the lead contributors. Overall, merchandise exports contracted by 7.3 per cent to US$ 290.6 billion in 2020-21 from US$ 313.4 billion a year ago. Thus, despite the sharp contraction seen in Q1 on account of COVID-19 induced disruptions, the contraction for the year as a whole turned out to be moderate, buoyed by a sharp recovery in Q3 and Q4. 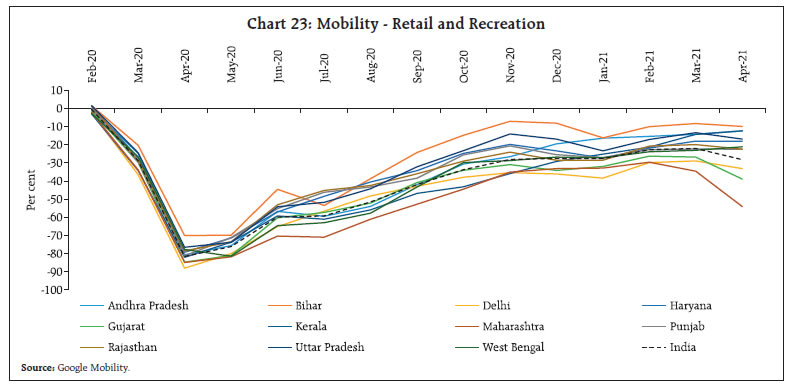 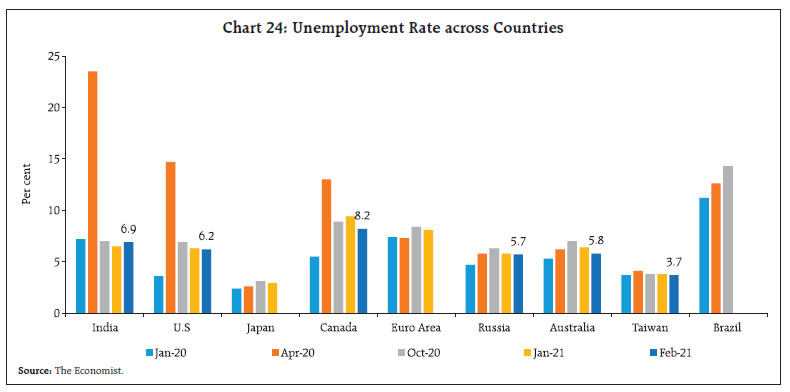 Two major global trade developments have the potential to reshape India’s foreign trade going forward. First, global chip shortages, which initially put a break on automobile production and is now permeating to other sectors. Second, elevated freight prices resulting from container shortages have become aggravated further due to the six-day mega blockage of the Suez Canal. The current global chip shortage is due to inter-industry chip demand-supply mismatch caused by COVID-19 disruptions. This reflects a production shift from chips for automotives to chips for home/ office items. With car sales picking up in several parts post lockdowns, the chip shortage has impacted all major industries dependent on semiconductors, leading to production suspension by major car markers across the world. India imported around US$ 54.3 billion worth of electronic goods in 2020-21 out of which chip imports constituted around 20 per cent, primarily from China and Hong Kong, followed by South Korea and Singapore. According to an India Electronics and Semiconductor Association (IESA) report, the Indian semi-conductor component market is expected to reach US$ 32.3 billion by 2025 on the back of development in smart industrial automation (industry 4.0), research and development (R&D) initiatives by big corporations, defence and rural broadband requirements. 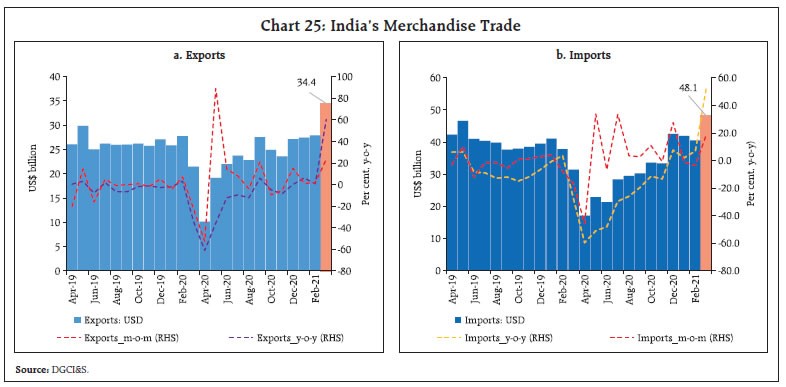 Global freight prices have surged on the back of COVID-19 disruptions and the lopsided recovery led by China and South East Asia has rendered them uneven, with costs for outbound shipment from China rising more than four to five times than inbound shipments to China (Chart 26). Petroleum product exports, a major constituent of India’s export basket, have seen a sharp contraction in the current financial year, attributable to relatively softer international crude prices. In volume terms, the decline has been the steepest for aviation turbine fuel, demand for which has taken a major hit due to COVID-19 induced international travel restrictions (Chart 27a and 27b). With COVID-19 outbreaks continuing unabated, a full-scale resumption of international air travel looks unlikely unless radical measures like vaccination passports are put in place. Several associations and non-profit agencies have commenced their own versions, with the International Air Transport Association developing an app called IATA Travel Pass, while the Non-profit Commons Project has introduced an app called CommonPass. However, there is a need for global recognition and a coordinated response.  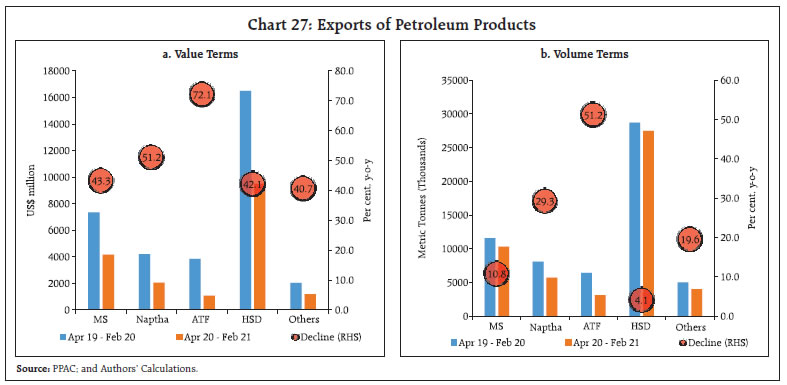 Merchandise imports too staged a smart turnaround, growing by 53.7 per cent in March on an uptick in domestic economic activity. The growth in imports was broad-based, with 24 out of 30 commodities accounting for over 91.9 per cent of imports registered an expansion. Global crude oil prices have firmed up in recent months, following the OPEC plus decision to extend production cuts amidst optimism over global economic recovery. As a result, crude prices (Indian basket) have grown by nearly 100 per cent y-o-y in March. This has partly contributed to oil import growth turning positive in March after 12 months of successive contraction. In a bid to reduce dependence on middle east oil producers, India has recently indicated its inclination to diversify its oil imports. Towards this direction, it has recently received the first-ever shipment of crude oil from the South American nation of Guyana. In fact, India emerged as the top buyer of US crude in the first quarter of 2021 (calendar year)35. Gold continues to be a major driver of import growth, rising at over 592 per cent in March. According to industry analysts, reduction in customs duty in Union Budget 2021-22 combined with price correction from highs seen in 2020 have drawn in retail buyers and jewellers. With imports at US$ 389.2 billion in 2020-21, their overall contraction was steeper than exports during the year; however, Q4:2020-21 imports have surpassed pre-COVID-19 levels. The sharper contraction in imports vis-à-vis exports resulted in a moderation of trade deficit to US$ 98.6 billion in 2020-21 from US$ 161.3 billion in 2019-20. The last two editions of this article highlighted the distinctive pro-investment stance of the Union Budget 2021-22 and the push towards capex revival by the states. Incoming data for 17 states and union territories (UTs) that have presented their final budgets for 2021-22 show that the plan is to continue with the capex push in to the current fiscal year. States have combinedly budgeted a capex increase of 29.7 per cent in 2021-22 over the revised estimates for 2020-21. States’ ability to incur productive expenditure, while adhering to the gross fiscal deficit (GFD) target of 4 per cent of gross state domestic product (GSDP) for 2021-22, will critically hinge on the revival of revenue receipts - primarily tax revenues. Monthly tax revenues, as reported by the Controller General of Accounts (CGA) for the centre and Comptroller and Auditor General of India (CAG) for states, reveal a distinct turnaround in collections during H2:2020-21, with the centre’s direct and indirect tax collections registering growth of 18.4 per cent and 29.8 per cent, respectively during October-February and states experiencing a similar revival in direct and indirect tax collections (Chart 28). Aggregate Supply Aggregate supply conditions were underpinned by agriculture’s resilience and services shrugging off the debilitating impact of COVID-19 restrictions. In the industrial sector, manufacturing registered moderation in activity while electricity generation maintained its robust recovery. Harvesting of rabi crops has been accomplished in 55 per cent of the total sown area (as on April 2, 2021). The crop-wise picture reveals that wheat (31.0 per cent of acreage), pulses (82.0 per cent) and oilseeds (91.0 per cent) have been harvested. As a result, public procurement for the upcoming rabi marketing season (April to March) has commenced well ahead of time and higher mandi arrivals are soon expected. This year, the government has set a target to procure 9.6 per cent higher wheat over the already record level achieved over a year ago. The ongoing rice procurement as of April 15, 2021 is 13.0 per cent higher over a year ago, benefitting more than 10 million farmers. Better price realisation by famers due to higher prices and increased public procurement is expected to boost rural demand. The supply side also remains supported by 3.7 times higher public stocks of cereals as compared to the buffer norms. 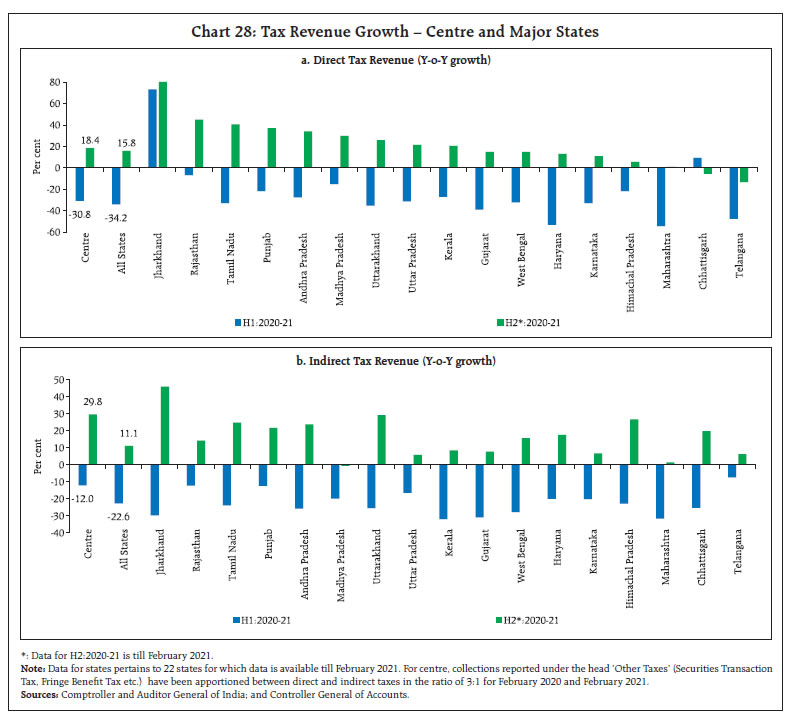 Timely harvesting of rabi crops has opened up space for summer sowing (zaid during March to June) which is already 17.0 per cent higher than in the previous year (as on April 15, 2021). Although summer crops (mainly paddy, pulses, coarse cereals and vegetables) account for a small share of total agricultural production, their importance has increased in recent years as they constitute an additional source of income for farmers, besides contributing to fodder supply. According to the IMD, pre-monsoon thunderstorms are likely to cause heavy rains, leading to an above normal wet session indicated from April 2336. Live water storage in the 130 major reservoirs remained comfortable at 81 per cent of last year’s levels and 119 per cent of the 10-year average. The headline manufacturing PMI remained in expansion at 55.4 in March though moderately lower than 57.5 a month ago (Chart 29a). The index for new orders posted expansion for the eighth consecutive month. Though the pace of expansion softened as compared to February, it remained above the long run average. About 31 per cent of firms signalled expansion due to strong demand conditions; however, 12 per cent reported lower growth in new business due to the pandemic. New export orders held on to their upward trajectory for the seventh consecutive month. The 93rd round of the Reserve Bank’s industrial outlook survey (IOS) conducted during Q4:2020-21 points to further strengthening of production, order books and employment. While respondents’ sentiments on availability of finance through banks, internal accruals and overseas sources improved, they perceive higher cost pressures emanating from input purchases and salary outgoes. For the first three quarters of 2021-22, manufacturers are optimistic on improvement in production, capacity utilisation, employment conditions and the overall business situation. The services sector continued to expand at a steady pace in March. The services PMI expanded for the sixth straight month in March to 54.6, supported by an increase in business activity and strong demand conditions (Chart 29b). The pace of expansion softened from the preceding month but remained above the long run average of 53.3. Due to subdued global demand and pandemic-related restrictions, the service export business index remained in contraction for the thirteenth consecutive month. The business expectations index - an indicator of future market sentiment - remained high at 59.2 in March on increased availability of COVID-19 vaccines and higher client enquiries received by firms. The recent surge in infections could endanger the recovery in the services sector. These concerns were evident in the 28th round of the Reserve Bank’s services and infrastructure outlook survey (SIOS) conducted during January-March 2021 in which enterprises assess some moderation in the overall business situation and turnover in Q4:2020-21 after a pace of strong recovery in Q3. For Q1 to Q3 of 2021-22, however, respondents exuded optimism with regard to the business situation, employment conditions and turnover. They expect an improvement in the job landscape for both part-time and full-time employees. Infrastructure companies were optimistic about Q4:2020-21 when they expect a sharp uptick in the overall business situation. In their assessment, input cost pressure could build up and contribute to rising prices. 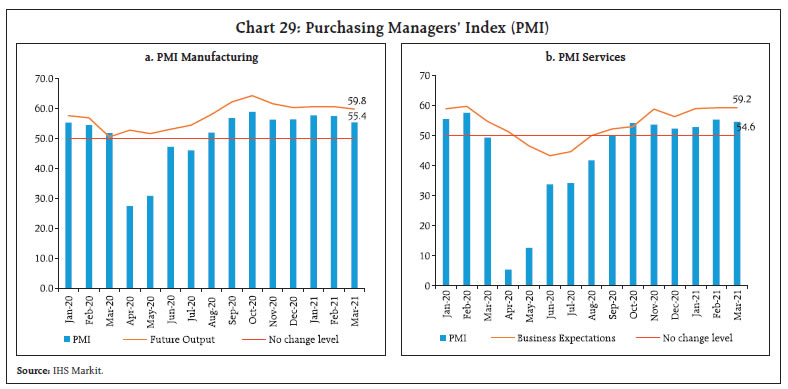 Building on the momentum gained in Q2 and Q3 2020-21, IT companies are poised to stage their strongest performance in Q4 on the back of growing digitalisation, improving demand conditions, clinching of global deals, and migration to cloud computing and related technologies. As per Gartner, a global research and advisory firm, global IT spending is projected to increase to US$ 3.9 trillion in 2021, a growth of 6.2 per cent over the preceding year. As businesses are forced to accelerate their digital transformation plans, given their adoption of remote work and digital touchpoints, Indian IT firms are well placed to cater to the rising demand owing to payoff from investment in new-age technologies and talent base. Inflation CPI inflation in March 2021 edged up to 5.5 per cent from 5.0 per cent in February 2021 due to a sharp increases in food as well as fuel inflation. Core inflation (CPI excluding food and fuel inflation) remained elevated (Chart 30a). Food inflation increased to 5.2 per cent in March from 4.3 per cent in February, with vegetable price dynamics (especially in terms of a sizeable adverse base effect) largely determining this outcome. Among the food sub-groups, the inflation trajectory continued to exhibit considerable divergence. Five out of 12 food sub-groups, comprising meat and fish; eggs; edible oils; pulses; and non-alcoholic beverages exhibited double digit inflation. On the other hand, three sub-groups comprising cereals; vegetables; and sugar were in deflation. While cereal price deflation deepened, the rate of deflation in vegetables slowed down in March. 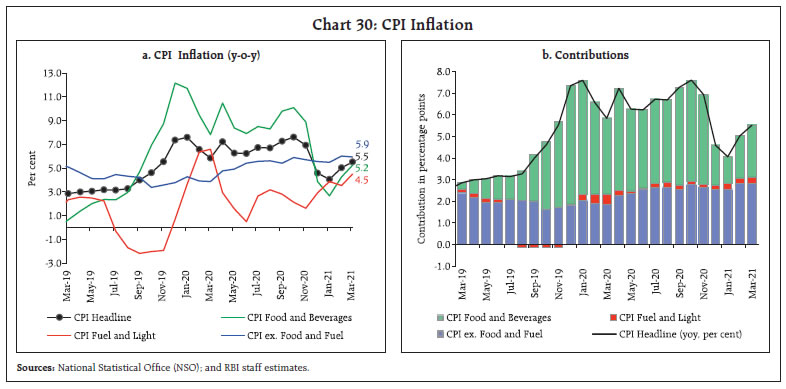 Fuel price inflation surged to 4.5 per cent in March, an increase of 100 bps from February. CPI excluding food and fuel inflation remained elevated at 5.9 per cent in March, in spite of a modest softening of 10 bps from 6 per cent in February. While personal care and effects; pan, tobacco and intoxicants; and health inflation moderated, inflation in transport and communication; housing; clothing and footwear; household goods and services; recreation and amusement; and education edged up. CPI excluding food and fuel (with a weight of 47.3 per cent) contributed to 51 per cent of the headline inflation in March (Chart 30b). High frequency food price data from the Ministry of Consumer Affairs, Food and Public Distribution (Department of Consumer Affairs) for April so far (April 1-23, 2021) indicate further softening in cereals prices. The winter softening of prices of tomatoes, onions and potatoes (TOP) continued into April. Prices of TOP in April 2021 are lower than the levels a year ago. However, prices of pulses, barring moong, edged up further in April and were at levels higher than a year ago. Edible oil price pressures also showed no signs of easing, with prices registering further increases, particularly in the case of sunflower oil (Chart 31). 
| Table 1: Petroleum Product Prices | | Item | Unit | Domestic Prices | Month-over-month (per cent) | | Apr-20 | Mar-21 | Apr-21^ | Mar-21 | Apr-21 | | Petrol | ₹/litre | 72.87 | 93.20 | 92.67 | 2.1 | -0.6 | | Diesel | ₹/litre | 64.96 | 85.11 | 84.56 | 2.6 | -0.6 | | Kerosene (subsidised) | ₹/litre | 22.39 | 29.37 | 30.32 | 7.4 | 3.2 | | LPG (non-subsidised) | ₹/cylinder | 748.63 | 829.63 | 819.63 | 7.6 | -1.2 | ^: For the period April 1-23, 2021
Note: Other than kerosene, prices represent the average Indian Oil Corporation Limited (IOCL) prices in four major metros (Delhi, Kolkata, Mumbai and Chennai). For kerosene, prices denote the average of the subsidised prices in Kolkata, Mumbai and Chennai.
Sources: IOCL, Petroleum Planning and Analysis Cell (PPAC); and RBI staff estimates. | Following the decline in global crude oil prices, domestic pump prices eased in the second half of March and in April so far (April 1-23, 2021). Domestic kerosene prices edged up in April whereas liquefied petroleum gas (LPG) prices registered a decline (Table 1). Going forward, the calculation of y-o-y CPI inflation prints for April and May 2021 is subject to uncertainty given that April and May CPIs a year ago were not based on actual price data collections but were imputed. Over the last month, there were two positive developments on the prices front. First, there is an increasing likelihood of a normal south-west monsoon in 2021, as alluded to in the concluding section of this article. Second, the retreat of crude oil prices from a peak level of around US$ 70 per barrel could result in some softening in domestic pump prices. Coordinated policy actions by the Centre and states to rationalise high taxes on petrol and diesel can help bring relief to households by lowering pump prices and mitigating second-round effects on the economy. Upside risk to inflation emanating from input price pressures in manufacturing and services, as evidenced from the PMIs, remain, however. The wholesale price index (WPI) inflation in March 2021 touched a 103 month high of 7.4 per cent, indicating a pickup in costs across farm and industrial sectors. Firms surveyed in the IOS and SIOS conducted by the Reserve Bank during January-March 2021 indicate a likely persistence of input prices pressures well into 2021-22 and a gradual increase in selling prices. The resurgence in COVID-19 infections, if not contained in time, risks protracted restrictions and disruptions in supply chains with consequent inflationary pressures. IV. Financial Conditions Domestic financial conditions remained easy on abundant system liquidity. In spite of advance tax outflows in the second half of March, the average daily net liquidity absorption under the liquidity adjustment facility (LAF) ranged between ₹5.40 lakh crore in March 2021 to ₹5.94 lakh crore in April 2021 (up to April 22, 2021). The Reserve Bank conducted a variable rate reverse repo auction on March 12, 2021 for an amount of ₹2 lakh crore. Furthermore, in order to meeting any additional/unforeseen demand for liquidity and to provide flexibility to the banking system for year-end balance sheet management, the Reserve Bank conducted two fine-tuning variable rate repo auctions of ₹25,000 crore each on March 26 and March 31, 2021 for 11 days and 5 days, respectively. At the same, the Reserve Bank decided, as a one-time measure, not to conduct any variable rate reverse repo auction for the fortnight beginning March 27, 2021 to ensure the availability of ample liquidity to manage year-end requirements, particularly with Cash Reserve Ratio (CRR) requirements increasing to 3.5 per cent of the net demand and time liabilities (NDTL) from the fortnight beginning from March 27, 2021. As a special case, Stand-alone Primary Dealers (SPDs) were allowed to participate in these auctions. To ensure availability of appropriate liquidity to productive sectors of economy, the Reserve Bank, in its monetary policy statement on April 7, 2021, announced extension of TLTRO on Tap Scheme by a period of six months, i.e., till September 30, 2021 and fresh support of ₹50,000 crore to the All India Financial Institutions (AIFIs) for new lending in 2021-22. Furthermore, the Reserve Bank put in place a secondary market G-sec acquisition programme or G-SAP 1.0 that will enable a stable and orderly evolution of the yield curve amidst comfortable liquidity conditions. Under the first tranche conducted on April 15, 2021, the Reserve Bank bought the entire notified amount of ₹25,000 worth of government securities for which the bid-cover ratio stood at 4.07. During April, the Reserve Bank conducted two 14-day variable rate reverse repo auctions on April 9, 2021 and April 23, 2021 for an amount of ₹2 lakh crore each. The Reserve Bank conducted four special open market operations (OMOs) (operation twists): (i) for an enhanced amount of ₹15,000 crore on March 4, 2021; (ii) an innovative auction on March 10 involving asymmetric notified amounts: purchase of long-term securities worth ₹20,000 crore and sale of short-term securities worth ₹15,000 crore; and (iii) two auctions on March 18 and 25, 2021 for ₹10,000 crore each (Chart 32). The overnight money market rates, i.e., the weighted average call rate (WACR), the tri-party repo and the market repo rate trailed below the reverse repo rate but moved in close alignment. The spread of the tri-party repo rate and the market repo rate below the reverse repo rate moderated from 34 bps and 49 bps, respectively, in February to 11 bps and 20 bps in March. However, spreads widened again in April 2021 to 25 bps and 32 bps, respectively (up to April 22, 2021) due to an increase in surplus liquidity. Among other key money market rates, the 3-month T-bill rate and 3-month certificates of deposit (CD) traded below or closer to the reverse repo rate, while the interest rate on 3-month commercial paper (CP) issued by non-bank financial companies (NBFC) rates ruled above the reverse repo rate in April 2021 (Chart 33). 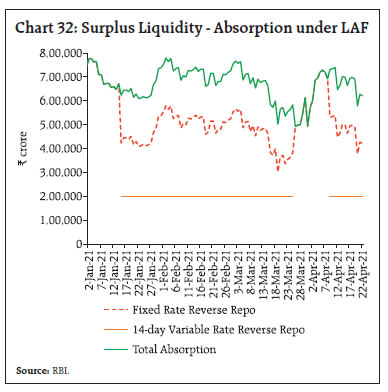 Overall monetary and credit conditions in the economy remained accommodative. Reserve Money (RM) adjusted for the first-round impact of changes in the CRR increased by 13.9 per cent on a y-o-y basis as on April 16, 2021 (12.4 per cent a year ago) – its lowest y-o-y growth since May 2020 - as currency in circulation slumped to a 10-month low of 15.7 per cent (14.5 per cent a year ago) on the components side, while the rise in net foreign assets (NFA) on the sources side was subdued (Chart 34). Money supply (M3) grew by 11.3 per cent as on April 9, 2021 (10.2 per cent a year ago) and the currency to aggregate deposit ratio was at 17.3 per cent. The financial year 2020-21 closed with credit extended by scheduled commercial banks (SCBs) clocking a feeble growth of 5.6 per cent y-o-y, pointing to continuing risk aversion amidst pandemic linked impairment to their balance sheets. Deposit growth remained sturdy in double digits clocking 11.4 per cent at the year end. The banking system’s role in supporting the credit needs of the economy is decelerating, with its funding of the market borrowing programme of the government on the rise. In 2020-21, banks’ investment in government securities had risen by 22.1 per cent by mid-September and remained elevated thereafter (Chart 35a). Similar episodes of subdued credit growth and high growth in investment in government securities were seen post the global financial crisis and after demonetisation. Accordingly, the first half of 2020-21 saw a sharp decline in credit-deposit (C-D) ratios of banks and a corresponding pickup in investment-deposit ratios. The decline in C-D ratios was arrested in H2:2020-21 (Chart 35b). 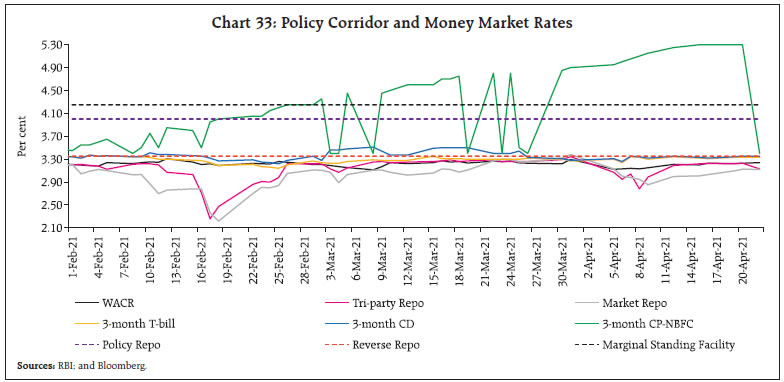 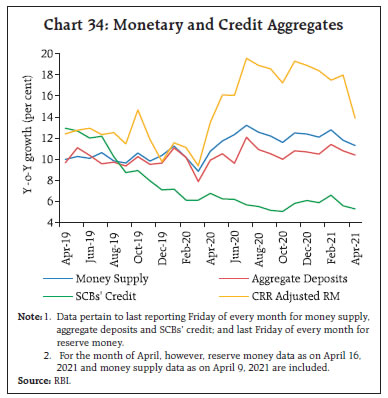 The year ended with a cumulative credit expansion of ₹5.8 lakh crore by scheduled commercial banks, a shade lower than the credit creation of ₹6.0 lakh crore in the previous year. During 2020-21, banks invested ₹7.2 lakh crore in government securities, nearly double of their investment in the previous year (Chart 36). Banks’ investment in 2020-21 outpaced overall credit extended – a phenomenon not seen in nearly twenty years, barring the year of demonetisation. 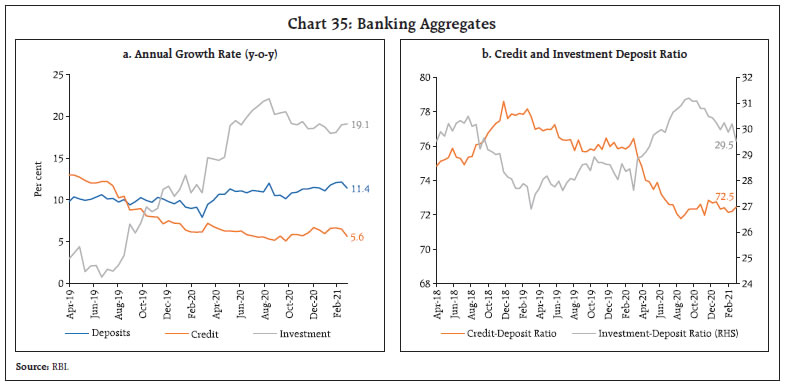 Sectors that experienced expansion in bank credit were agriculture, benefitting from sequential years of record production; and the services sector, propelled by strong disbursals to trade, tourism, transport and to other services37. Within the personal loan segment, loans for consumer durables and other personal loans38 posted robust growth, and there was a strong pick up in loans against gold jewellery. Credit to industry remained a drag. Taking advantage of the easy financing conditions, the corporate sector raised substantial funds from financial markets, which was mainly used for deleveraging. Credit growth to medium industry and micro and small industries turned out to be resilient and performed better year-on-year (Chart 37). 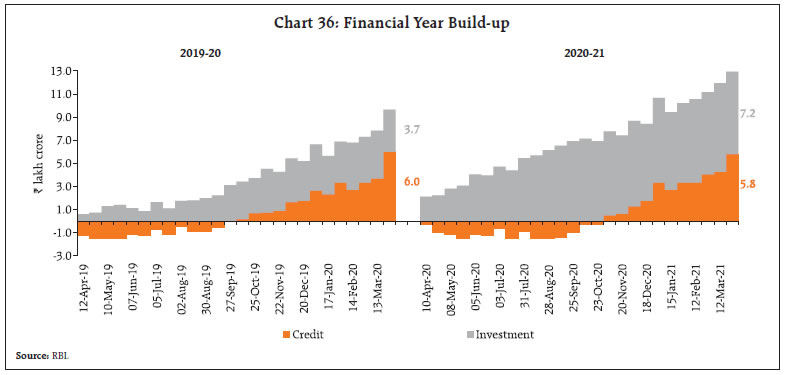 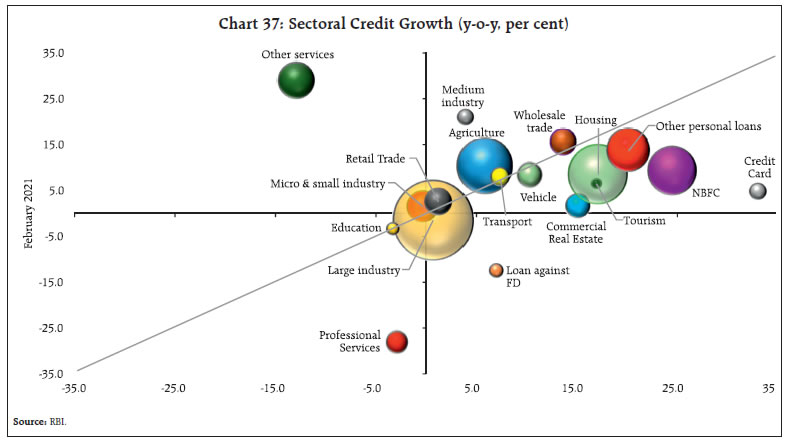 A sizeable decline in the median term deposit rate (representing card rates on new deposits) of 205 bps and 144 bps since February 2019 (beginning of easing phase) and March 2020, respectively (up to March, 2021) reflected the faster pace of adjustment in deposit rates relative to loan rates (Table 2) - during the same period, the 1-year median marginal cost of funds-based lending rate (MCLR) softened cumulatively by 150 bps and 95 bps, respectively. | Table 2: Transmission from the Repo Rate to Banks’ Deposit and Lending Rates | | (Variations in basis points) | | Period | Repo Rate | Term Deposit Rates | Lending Rates | | Median Term Deposit Rate | WADTDR | 1 - Year Median MCLR | WALR - Outstanding Rupee Loans | WALR - Fresh Rupee Loans | | February - September 2019 | -110 | -9 | -7 | -30 | 2 | -40 | | October 2019 – March, 2021* | -140 | -175 | -145 | -120 | -100 | -138 | | March 2020 – March, 2021* | -115 | -144 | -106 | -95 | -82 | -107 | | February 2019 – March, 2021* | -250 | -205 | -152 | -150 | -98 | -178 | *: Latest data on WALRs and WADTDR pertain to February 2021.
WALR: Weighted Average Lending Rate. WADTDR: Weighted Average Domestic Term Deposit Rate.
MCLR: Marginal Cost of Funds-based Lending Rate.
Source: RBI. | In the first half of March, G-sec yields in India had hardened at the longer end of the curve, with the 10-year generic G-sec yield scaling a peak of 6.25 per cent on March 10, driven mainly by global spillovers from hardening of US yields, rising crude oil prices, heightened inflation expectations and hence fears of reversals of accommodative stances of AE central banks (Chart 38). The second half of March brought some relief for bond traders: (i) the Reserve Bank accepted more than the notified amount exercising a green shoe option in the 5-year and the 10-year segment in the government stock auction conducted on March 19; and (ii) the government stock auction of March 26, 2021 was cancelled on a review of the Government’s cash balance position. These developments, working on the back of the prevailing surplus liquidity conditions, had a soothing impact on market sentiments, with the 10-year generic G-sec yield declining by 8 bps as on March 31 from its peak of March 10, 2021. The softening bias extended into April 2021 particularly after the announcement of G-SAP 1.0 and the yield on 10-year G-sec eased to as low as 6.01 per cent on April 12, 2021 and traded range bound subsequently. 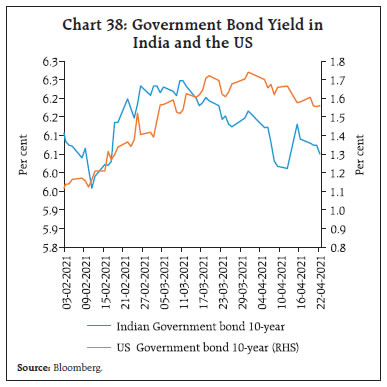 Tracking G-sec yields, corporate bond yields and spreads on average firmed up in March as compared with those in February across the rating spectrum and issuer categories. As the second wave of infections unfolded in several parts of the country, bond market sentiments sank, getting reflected in hardening of yields in April (Table 3).
Equity markets, which had resumed an uptrend in March, underwent some corrections, tracking the sell-off in global markets on concerns over rising US Treasury yields. Market sentiment wilted, following the resurgence of COVID-19 cases in a second wave and imposition of fresh restrictive measures in certain parts of the states (Chart 39). Closing at 49,509 on March 31, however, the BSE Sensex increased by 0.8 per cent in March 2021, faring better than most of peer EMEs (Chart 40). Markets continued trading in April 2021 on a negative note on COVID-19 related concerns and the decrease in India’s manufacturing PMI to a seven-month low. The markets rebounded with the Reserve Bank’s decision to continue with the accommodative stance as long as necessary to sustain growth on a durable basis. Furthermore, the optimistic GDP growth projection for 2021-22 by the Reserve Bank and the IMF also boosted investor sentiments. Equity-oriented mutual funds registered net inflow in March 2021 after a period of eight months (Chart 41). Furthermore, contribution from systematic investment plans (SIPs) accounted for inflows of ₹9,182 crore in March 2021, a substantial jump over inflows of ₹7,528 crore registered during February 2021. 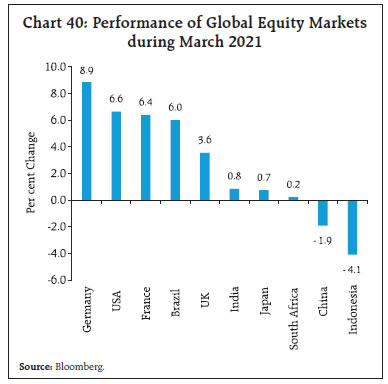 March turned out to be a busy month for investors in initial public offerings (IPOs), as nine companies came out with main board IPOs and raised ₹6,083 crore from the primary capital market, recording sizable oversubscriptions, particularly from high net-worth individuals (HNIs), retail investors and mutual funds (Chart 42). With an average subscription of 78 times of the IPO amount, the average listing day returns of 17.3 per cent turned out to be moderate as secondary market conditions turned volatile in March. In view of the upbeat listing day performance of IPOs and buoyant secondary market conditions in the past few months, companies reportedly have been aggressively pricing their IPOs. Following the sharp increase in demat accounts opened during 2020-21, retail participation in IPOs has been impressive and is expected to remain strong going forward. 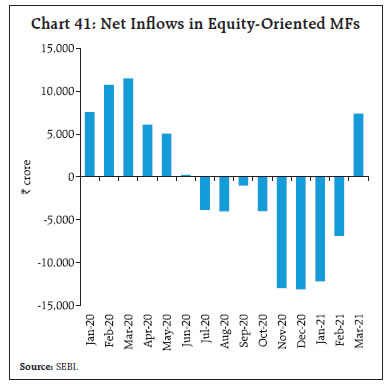 In a related development, the Securities and Exchange Board of India (SEBI)’s Board approved relaxation of conditions for listing on the Innovators Growth Platform of stock exchanges in order to encourage Indian start-ups to list in domestic markets rather than foreign capital markets. They include reduction in the holding period of 25 per cent of pre-issue capital to one year from two years, allowing discretionary allocation of up to 60 per cent of the issue size to eligible investors with a lock-in period of 30 days on such shares, changing the threshold for triggering open offers from the existing 25 per cent to 49 per cent and easing of rules for companies seeking to migrate to the Main Board from the Innovators Growth Platform. The move assumes significance as it comes at a time when various Indian start-ups are exploring the option to list overseas as the phenomenon of SPAC gains traction. 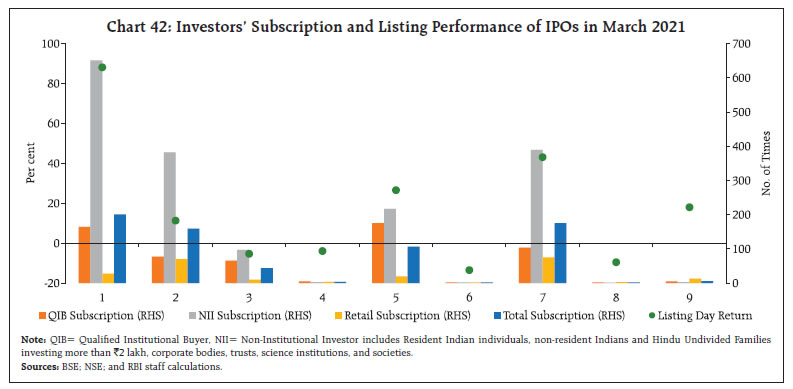 In the fixed income market segment, Additional Tier 1 (AT1) bonds became the talk of the town following the release of the SEBI’s circular on March 10, 2021. It specified that the maturity of all perpetual bonds should be treated as 100 years from the date of issuance of the bond for the purpose of valuation by mutual funds. Earlier, perpetual bonds were priced to call option date. In addition, the SEBI also capped a mutual fund scheme’s exposure to AT1 bonds and Tier 2 bonds issued by banks to 10 per cent of debt assets with a 5 per cent cap on single issuer exposure, allowing for grandfathering of existing excess investments. Furthermore, the SEBI also specified that closed ended debt schemes shall not invest in perpetual bonds39. Accordingly, yields on AT1 bonds, which are typically issued by public sector banks to shore up Tier 1 capital requirements, rose sharply in the secondary market (Chart 43). In response to demands from various quarters to roll back the measures, the SEBI released another circular on March 22, 2021 proposing the implementation of the new valuation methodology in a phased manner. Nonetheless the market for AT1 bonds is in disarray, and overcast with pessimistic sentiment. 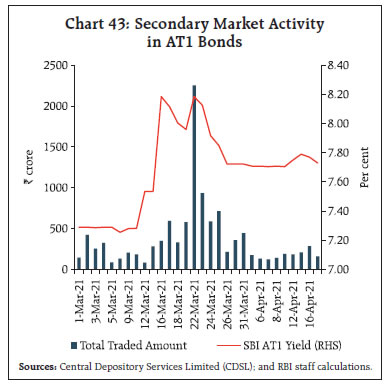 Following the proposal in the Union Budget 2021-22 for a permanent institutional framework for instilling confidence amongst participants in the corporate bond market during times of stress and enhancement of secondary market liquidity, the Finance Minister made an announcement in March 2021 that the SEBI would set up a Corporate Debt Market Development Fund (CDMDF) to provide liquidity to mutual funds and other participating institutional investors in the corporate bond market. The key mandate of the fund would be to trade in corporate debt with a focus on below AAA rated paper. A special purpose vehicle (SPV) is proposed to be set up with contribution from mutual funds and other institutional investors, with the majority ownership lying with a subsidiary of a public sector mutual fund. The SPV shall act as the buyer of the last resort during stress times, and even act as a market maker during peace times. Notwithstanding repatriation of equity exceeding fresh inflows in domestic companies in February 2021, net foreign direct investment flows at US$ 41.4 billion in 2020-21 (April-February) were higher than US$ 39.0 billion a year ago (Chart 44). 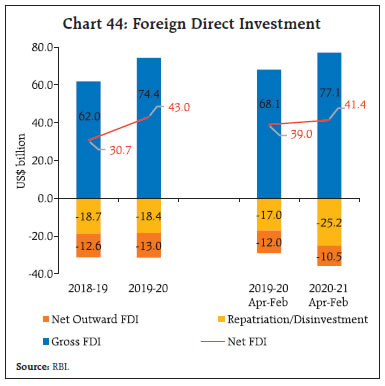 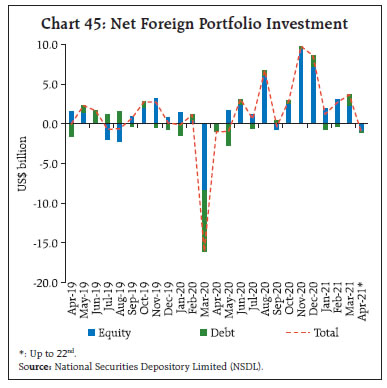 Amidst rising US treasury yields, the risk appetite of global investors for EMEs remained muted. Net purchases by foreign portfolio investors (FPIs) in the domestic equity market were modest in March 2021. In the debt segment, FPIs turned net purchasers in March 2021, following a sell-off in previous two months. Cumulatively, FPIs net investment in equities was to the tune of US$ 37.3 billion in 2020-21 (Chart 45). In the equity segment, majority of FPIs net investment in March 2021 was in software and services, household and personal products, and construction materials sectors (Chart 46). However, unnerved by sharp escalation in COVID-19 cases and the consequent restrictions imposed by various states, FPIs reduced their exposure by US$ 1.1 billion in April 2021 (up to 22) in domestic capital market. Foreign exchange reserves, after reaching its all-time high of US$ 590.2 billion on January 29, 2021, were at US$ 582.4 billion on April 16, 2021, equivalent to 18.5 months of imports (Chart 47). In the foreign exchange market, the Indian rupee (INR) strengthened against the US dollar in March on the back of FPI inflows. As at end-March 2021, the INR appreciated by 2.6 per cent against the US dollar over its level at end-March 2020. Thereafter, the INR depreciated against the US dollar amidst concerns over rising COVID-19 infections in India. In terms of the 40-currency real effective exchange rate (REER) index, the INR appreciated by 3.5 per cent in March over its level a year ago (Chart 48). However, the INR, in terms of REER index, depreciated by 2.6 per cent in April 2021 (up to 16) over its level in the previous month. Payment System Throughout 2020-21, digital transactions maintained a steady growth momentum (Table 4). Real Time Gross Settlement (RTGS) data point to a slowdown in wholesale transaction value in 2020-21. Notwithstanding this blip, volume growth withstood the pandemic. On the other hand, retail payments, in general, grew strongly compared to a year ago. Transactions through National Electronic Funds Transfer (NEFT), National Electronic Toll Collection (NETC) and the Bharat Bill Payment System (BBPS) registered acceleration over the previous year. Other digital retail payments like the Unified Payments Interface (UPI), Immediate Payment Service (IMPS) and National Automated Clearing House (NACH) exhibited resilience and demonstrated healthy growth. In fact, there was a near doubling of both transaction volume (from 12.5 billion to 22.3 billion) and value (from ₹21.3 lakh crore to ₹41 lakh crore) between FY2020 and 2021. On the cash front, withdrawals through Aadhaar enabled Payment System (AePS) hastened on account of direct benefit transfers (DBT) under the Government’s social assistance programs. Owing to this COVID-19 induced push, the AePS has made rapid strides in India’s digital payments, especially in rural areas, from humble beginnings. The Cheque Truncation System (CTS) had a dwindling number of takers – a testament to the shift towards digital modes.  Developments in March and April 2021 demonstrate some notable features of the turnaround underway in India’s digital ecosystem. RTGS transaction volume is swelling compared to March and April 2020. NEFT, UPI, IMPS, NETC and BBPS worked overtime and clocked acceleration in growth rates (y-o-y) in both transaction value and volume. The value of interbank cash withdrawals logged under the National Financial Switch witnessed significant growth in March and April after decelerating in most months of 2020-21, suggesting a return to normalcy and reinstatement of demand for currency notes. With FASTags becoming mandatory since February 2021, NETC growth numbers jumped in March (129 per cent in volume and 117 per cent in value terms, compared with 44 and 39 per cent last month) and are expected to show tremendously high growth (y-o-y) in April, due to the base effect from the stringent lockdown last year. Recent innovations in digital payments include the RuPay SoftPoS [which transforms near-field communication (NFC) enabled smartphones into Point of Sale terminals for retailers, digitally enabling merchants to accept contactless payments] and the National Payments Corporation of India’s (NPCI) initiative to revive digital payments on feature phones by initiating development of a voice-enabled payments product. These initiatives are in line with the mission of the Reserve Bank’s Payments Infrastructure Development Fund to boost acceptance and lower the cost of digital payments in emerging India. There is palpable enthusiasm over the Reserve Bank’s call to the private sector to establish Umbrella Entities for retail payments, which has piqued interest of well-established conglomerates and unicorns alike. This move bodes well for the Reserve Bank’s long-standing endeavour to nurture innovation and competition in the sector. The Reserve Bank of India (Digital Payment Security Controls) directions 2021 will be pivotal in protecting the consumer in the move-fast-break-things world of digital business. In the Monetary Policy Statement of April 7, 2021 the RBI has enabled regulated payment system operators to take direct membership in the Centralised Payment Systems (NEFT and RTGS). This membership was earlier limited to banks; the move will help reduce settlement risk and expand digital financial services. With regards to Prepaid Payment Instruments (PPIs), the Reserve Bank has made interoperability mandatory for full-KYC compliant PPIs and for all acceptance infrastructure. Cash withdrawal from non-bank issued full-KYC PPIs has been allowed. For a balanced development of Digital India, the Ministry of Electronics and IT (MeitY) has provided a much-needed push on the hardware side with its production-linked incentive (PLI) scheme, for which it has started inviting applications for the second round of the scheme40. This will bolster the country’s aatma nirbharta in motherboards, semiconductors, and other electronic components. Going ahead, Digital India has potential to grow. A survey in the Asia-Pacific region (APAC) by Mastercard41 reveals considerable optimism among Indians on this count. With the focus on safety, hygiene and convenience, there has been a sudden uptick in digital orders and contactless payments. 58 per cent of Indian respondents intend to increase their usage of contactless payments such as debit and credit cards, prepaid cards, and mobile wallets. Moreover, 81 per cent believe that contactless payment is here to stay. Two out of three Indians feel secure making online payments, which is 10 per cent higher than in other countries in the APAC region. These results also underline the need to ramp up efforts on digital education, privacy protection and online security. FinTechs, like many other businesses, can be sharp-elbowed and there is a need for strong regulation, supervision and legal safeguards in the space, including but not limited to strong data privacy and security legislation. V. Conclusion India battles a ferocious rise of new infections and mortalities, perhaps the fastest for any country of continental dimensions. Healthcare infrastructure is strained and so are vaccine supplies, financial markets are reeling and earnings forecasts face downgrades. Yet this too shall pass. We have seen off the first wave, and we have largely adapted. Pandemic protocols, speedier vaccination, ramping up hospital and ancillary capacity, and remaining resolutely focused on a post pandemic future of strong and sustainable growth with macroeconomic and financial stability is the way forward. As Benjamin Franklin used to say, energy and persistence conquer all things. When we strive to become better than we are, everything around us becomes better too42. In the words of Fyodr Dostoyevsky, the secret of man’s being is not only to live but to have something to live for. India has a lot to live for; among them is the strong likelihood of being the world’s fastest growing economy in 2021 and 2022. India is mobilising rapidly to rendezvous with this outlook. A strong response to the second surge is building up. On April 19, it was announced that vaccination will be opened up to all Indians above the age of 18 from May 1, 2021. Vaccine manufacturers have been empowered to release up to 50 per cent of their supplies to states through the open market at a pre-declared price. Vaccine pricing has been liberalised to incentivise a ramp up of supplies and to attract new manufacturers into vaccine production. A total of ₹4,500 crore has been approved for augmenting existing capacity. There are many ways of going forward, but only one way of standing still43. It is noteworthy that economic activity in India is holding up admirably against COVID-19’s renewed onslaught. Much attention has been drawn to the wilting of incoming data in the face of the second wave and localised restrictions. Yet, it is important to note that it is the sentiment indicators that have moderated. Apart from contact-intensive sectors, activity indicators largely remained resilient in March and grew beyond pre-pandemic levels on the back of strong momentum rather than statistical base effects. The April 16 forecast of the India Meteorological Department is the icing on the cake – once again, the monsoon’s passion is set to captivate India. As the sage Valmiki wrote in the Ramayana, the sky ‘will drink the waters of the ocean and give birth to a liquid offspring, the elixir of life. The scorched earth will wear a robe of brilliant green’. According to the US National Oceanic and Atmospheric Administration, a transition from La Niña to ENSO-neutral is likely in the next month, with an 80 per cent chance of ENSO-neutral prevailing during May-July 2021. The Australia Bureau of Meteorology has noted that the El Niño–Southern Oscillation (ENSO) is neutral, and with no sign of El Niño or La Niña developing. Its climate model suggests that the tropical Pacific Ocean will remain at neutral ENSO levels at least until September. These conditions are propitious for a life-giving normal south-west monsoon in India, irrigating 50 per cent of India’s farmlands, boosting agricultural performance with ripple effects on rural demand (FMCG; tractors and other agriculture implements; fertilisers and two wheelers), stabilising food prices, and potentially saving fiscal revenues that would otherwise have had to be assigned to MGNREGA, drought relief, farm debt waivers and other incentives and subsidies. Agriculture and allied commodities exports showed resilience despite COVID-19 related disruption, growing in double digits overall during 2020-21. Exports, especially of wheat, non-basmati rice, oil meals, and spices, registered strong growth. This has helped India further improve the favourable trade surplus it enjoys in agricultural commodities. According to industry representatives, agriculture exports are expected to continue on the robust growth path in future on account of access to newer markets combined with strong demand from traditional markets for Indian agricultural products. Half a year has gone by since we re-launched this article in the RBI’s monthly Bulletin after a hiatus of 25 years to keep its readership abreast of current macroeconomic and financial developments. We have sought to dispel the heightened uncertainty brought on in pandemic times by information asymmetry. The article has received a fair amount of interest, which has also included some constructive criticism. This has gratified us – as the heat and dust settles, there will be light. The very thought incentivises us to keep raising the bar with regard to information flow while upholding the readership’s prerogative to hold diverging views so that an informed debate ensues. For instance, one view is that we are too optimistic44. Yes, confronted with a once-in-a-lifetime pandemic with no known cure so far, with infections and deaths that have drawn comparison to the Spanish flu of 1918, we have dared to keep the faith and dream about a COVID-vanquished world. There are several positives in this experience – the virus has shown us how globalised we are; the unprecedented and synchronised policy response we can mount when confronted with seemingly insurmountable odds; the swiftness with which the genome sequence of the virus was mapped and shared worldwide; the speed with which vaccines were developed. We are dealing with a pestilence that spreads not linearly but in waves, and peaks inevitably give way to troughs with learning experiences during and between that wound but also strengthen. And so, we ‘hope in the face of difficulty. Hope in the face of uncertainty. The audacity of hope!’45 The prognosis made in the March 2021 edition of the capex cycle poised to turn up and of corporate earnings exceeding expectations are based on hard data on lead/coincident indicators that have been cited. Offsetting the decline in capital expenditure by state governments in 2020-21, the Centre and its public sector enterprises (CPSEs) held the fort. The combined capital expenditure of 37 large CPSEs and departmental undertakings – all with annual capex budgets above ₹500 crore – was ₹4.6 lakh crore in 2020-21. This was 92 per cent of the ₹5-lakh-crore target for the year and 4.3 per cent higher than the capital spending by these entities in the previous year.46 Early results of corporate performance in January- March 2021 indicate strong growth in revenues and net profits. Unlike in preceding quarters, this was driven by a pick-up in demand and order inflows. Rising digitalisation is the engine powering a stellar performance of IT companies in the quarter. Capacity utilisation is steadily rising, and the latest round of the RBI’s Industrial Outlook survey envisages further expansion through the first three quarters of 2021-22. Electricity consumption, a real time indicator of economic activity since it cannot be stored, has risen sharply in April on top of steady growth in seven preceding months. Recent media reports, based on initial data collated by the Ministry of Commerce and Industry, indicate that India’s merchandise exports have posted a robust uptick in the first week of April 2021, led by engineering goods, gems and jewellery, and petroleum products. Imports also have shown a similar spurt, owing largely to landings of crude petroleum, its products, and electronics. It is not out of place to hope that these positive monthly developments reinforce each other and extend into a continuum that spans the medium-term. There will be pitfalls along the way, but it is important to remain focused on the destination rather than the journey. The outlook for the Indian economy is bright by any projection. If the relatively conservative growth forecast of the Reserve Bank holds, India’s GDP in 2021-22 will exceed its level in the pre-pandemic year of 2019-20. There will be scars, some taking longer than others to heal, but there will also be a celebration of life, with humankind building stately mansions of achievement, each new temple nobler than the last. And it is important to retain that light amidst the encircling gloom. It is said that the mind has a thousand eyes47, but eyes are useless when the mind is blind.
|