The tapering of the second wave, coupled with an aggressive vaccination push, has brightened near-term prospects for the Indian economy. While several high frequency indicators of activity are recovering, a solid increase in aggregate demand is yet to take shape. On the supply side, agricultural conditions are turning buoyant with the revival in the monsoon, but the recovery of manufacturing and services sectors has been interrupted by the second wave. A pick-up in inflation is driven largely by adverse supply shocks and sector-specific demand-supply mismatches caused by the pandemic. These factors should ease over the year as supply side measures take effect. Introduction The tide is coming in again, lapping at boats stranded by the second wave of the pandemic. By July 12, 2021, the number of daily confirmed infections in India had fallen to less than a tenth of its May 6 peak (4,14,000) (Chart 1a). According to the SUTRA1 model forecasts, the 7-day average of new cases may come down to 5133 by the end of August 2021. In SUTRA’s analysis of the third wave in an optimistic scenario, life goes back to normal by August, and there is no new mutant. In an intermediate scenario, it is assumed that vaccination is 20 per cent less effective. There is not much difference between optimistic and intermediate scenarios, suggesting that vaccine efficacy changes do not have a significant impact. In its pessimistic scenario, which assumes that a new 25 per cent more infectious virus other than Delta+ spreads in August, there is a bigger impact. If there is no such mutant, the third wave will be a ripple and comparable to the first. If there is an immunity-escape mutant, however, all the above scenarios will be invalid (Chart 1b). 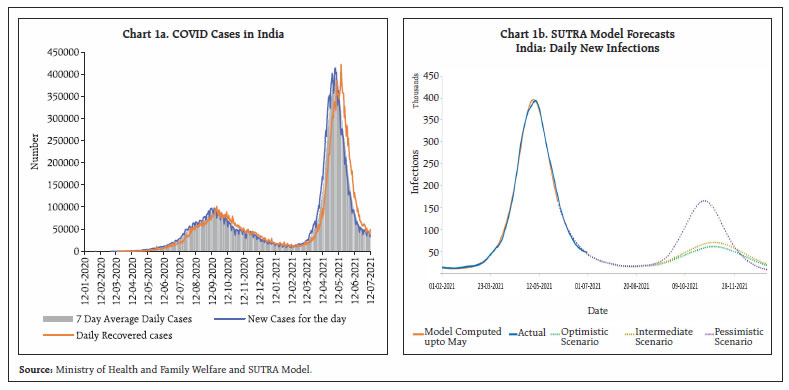 The vaccination drive is gathering speed and breadth – from July, vaccine manufacture is being ramped up, on course to inoculating 40 per cent of the adult population by August and the entire adult population by end-December this year (Chart 2). People are stepping out of isolation as containment measures are being cautiously eased. As the section on domestic developments points out, mobility is rising and workplaces are closing on to normal attendance. This is corroborated by the jump in advance tax payments in June, and in e-way bills. Power consumption is recovering from a soft patch. Freight transported by the Indian Railways has shown pandemic-proofing, having maintained a rising profile through the second wave’s visitation. All payment modes – cash withdrawals at teller machines; cards; unified payments interface; net banking; physical points of sale; and electronic funds transfer – have registered an uptick in volumes in June, forerunner to a revival of business and consumer confidence. Tailwinds for digital transactions are strong, benefiting from the infrastructure built up over the last 12 months. Taking these developments into account, the 27-indicator economic activity index (EAI) estimates that real GDP will register a growth of 22.1 per cent in April-June 2021 (Kumar, 20202). 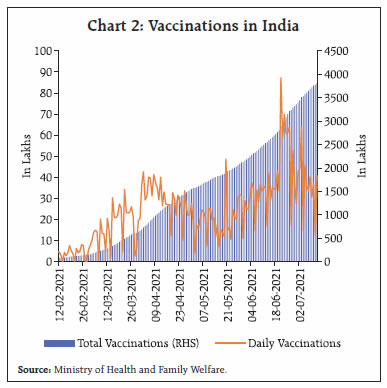 The virus is retreating to malevolently mutate unseen, offering a brief window of respite. This opportunity must be seized to (a) prepare for a possible third wave; and (b) renew our tryst with the interrupted recovery: “There is a tide in the affairs of men which, taken at the flood, leads on to fortune.”3 On June 30, the Reserve Bank released preliminary data on India’s balance of payments (BoP) for the final quarter of 2020-21, which confirmed the turning of the tide in the evolution of the Indian economy. Current account surpluses in the first half of the year have given way to modest deficits in the second half on the wings of a steady restitution of the demand for imports from the pandemic’s first wave lows. Although substantially driven by rising petroleum products (POL) and gold imports, the revival of landings of capital goods, raw materials and intermediates from abroad that has held up right up to early July 2021 is indicative of the gradual gathering of pace of the wheels of domestic industry. Although still nascent, this is an important indicator of the dynamic macroeconomic situation in the country. Absorptive capacity in the context of attracting and using capital flows from abroad to supplement domestic saving and push up the investment rate towards its potential is steadily improving. Being a mirror image of the saving investment gap in the economy, the current account deficit (CAD) at 1.0 per cent of GDP in Q4 corroborates the National Statistical Office’s (NSO) estimates of gross capital formation rising from its pandemic low of 21.9 per cent of GDP in Q1 to 31.3 per cent in Q4. In fact, two-thirds of net foreign capital inflows received by India during Q4 were absorbed domestically instead of passively flowing back uphill through accretions to reserves. The pick-up in the investment rate, if sustained, will improve the outlook for India’s potential output and as a result, the nation’s external solvency. The resilience of remittances in the face of the pandemic also augurs well for the prospects for gross disposable income and hence domestic consumption. Table 1: Key External Sector Indicators
Balance of Payments Indicators
(As per cent of GDP, unless indicated otherwise) | | Indicator | H1:2020-21 | H2:2020-21 | 2020-21 | 2019-20 | | (i) Current Account Balance (+Surplus/- Deficit) | 3.0 | -0.7 | 0.9 | -0.9 | | (ii) Exports | 11.1 | 11.1 | 11.1 | 11.2 | | (iii) Imports | 13.4 | 16.1 | 14.9 | 16.6 | | (iv) Trade Balance | -2.2 | -5.0 | -3.8 | -5.5 | | (v) Remittances (US$ billion) | 38.6 | 41.6 | 80.2 | 83.2 | | (vi) Remittances | 3.4 | 2.7 | 3.0 | 2.9 | | (vi) Net Terms of Trade (Index)# | 105.6 | 103.1 | 104.3 | 103.8 | | (vii) Net Capital Flows | 1.5 | 3.1 | 2.4 | 2.9 | | Of which: | | | | | | FDI | 2.1 | 1.3 | 1.7 | 1.5 | | FPI | 0.7 | 1.9 | 1.4 | 0.0 | | Other Investments | -1.2 | -0.1 | -0.6 | 1.4 | | (viii) Reserve Change, (-) increase/(+) decrease | -4.5 | -2.4 | -3.3 | -2.1 | Note: # An increase in net terms of trade index implies favourable export prices relative to imports.
Sources: RBI; and IMF. | In recognition of these early signs of a turnaround, foreign investors have reposed confidence in India’s medium-term growth prospects. On June 21, the United Nations Conference on Trade and Development’s (UNCTAD) World Investment Report 2021 (WIR) revealed that India became the fifth largest recipient of foreign direct investment (FDI) inflows in the world in 2020 (Chart 3). According to the UNCTAD, global FDI is set to recover some lost ground in 2021, with the Asian region expected to be the major recipient. India is marked as a significant beneficiary, with the Production Linked Incentive (PLI) scheme identified as a game changer in attracting export-oriented investments that will underpin a rebound of FDI into Indian manufacturing. Already, gross FDI inflows have amounted to US$ 32.0 billion in first five months of 2021 (January to May), close to 37 per cent of the entire inflows in 2020. 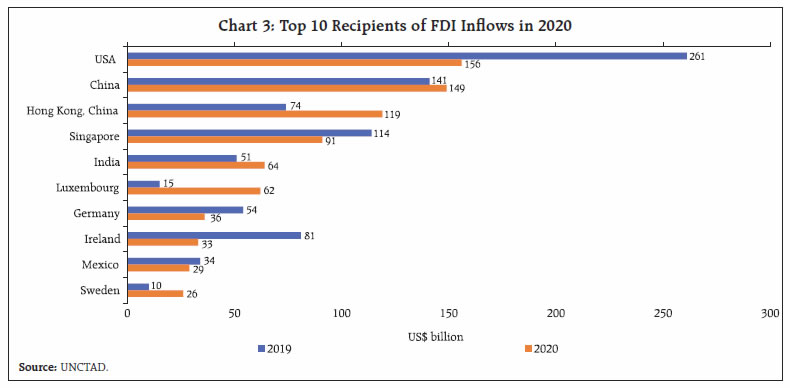
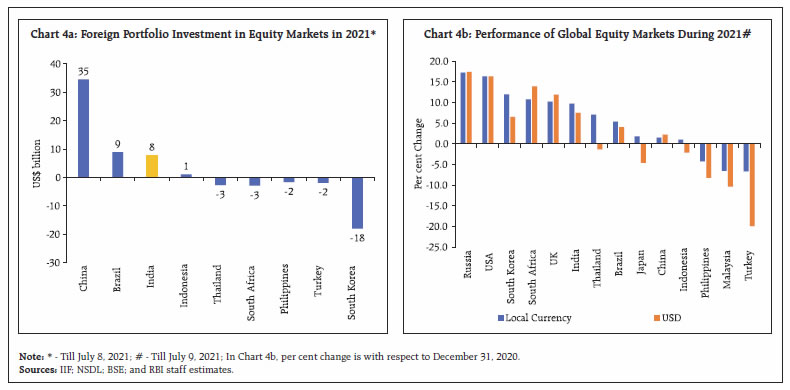 India is also becoming an attractive destination for foreign portfolio investments (FPI) in equities in 2021. On a year-to-date basis, India is the third largest recipient among major emerging market economies (EMEs) – after China and Brazil (Chart 4a). The domestic equity market has been one of the best performers globally (Chart 4b). In US dollar terms, India’s benchmark indices, the Sensex and the Nifty, offered gains of 8.3 per cent and 10.8 per cent, respectively, as against 6.9 per cent by the MSCI Emerging Markets index and 12.5 per cent by the MSCI World index. India accounted for 2.6 per cent of the world market capitalisation (m-cap) in June 2021; in fact, India’s m-cap rose 66 per cent in one year to US$ 3.02 trillion in June, outpacing the 44 per cent growth in the global m-cap. The market value of Indian equity holdings of FPIs touched a record US$ 610 billion by mid-June 2021, albeit moderated to US$ 592 billion in the second fortnight of the month, but still up 14.4 per cent over end-December 2020 and 71.9 per cent from its level a year ago. The surge in FPI inflows coincides with the equity risk premium of Indian equities falling sharply from as high as 5.3 per cent in March 2020 to 3.4 per cent in July so far (Chart 5a). FPI equity valuations have risen in financial services, software and computer services, oil and gas, metals and mining, consumer durables, chemicals and capital goods sectors, which together account for 64 per cent of the total increase in these valuations during 2021 so far (Chart 5b). In its first semi-annual Financial Stability Report (FSR) for the year 2021-22 released on July 1, the Reserve Bank noted that the banking system’s pre-pandemic capital and liquidity buffers have imparted resilience, with some of them accessing the market for fresh capital, while public sector banks have been allocated budgetary recapitalisation. Under this protective cover, banks have improved their financial performance and profitability. Among other financial intermediaries, liquidity stress has eased considerably among non-banking financial companies, with the Reserve Bank reaching out to smaller and vulnerable entities with targeted measures. In this milieu, the findings of the FSR shed light on the underlying state of the financial sector: 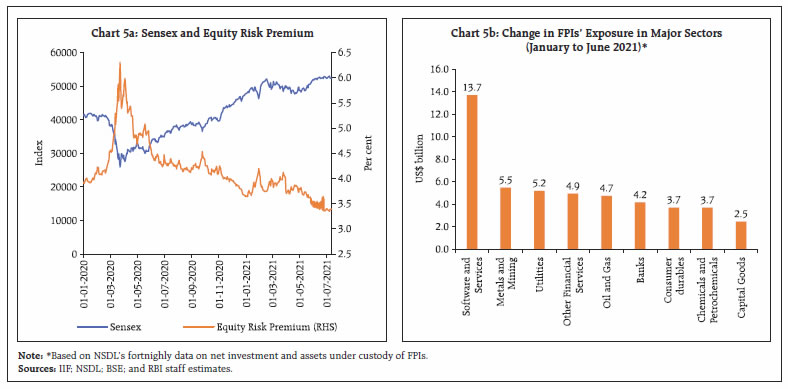 - Banks’ gross non-performing assets (GNPAs) and net NPAs (NNPAs) as ratios of gross advances settled at 7.5 per cent and 2.4 per cent, respectively, at the end of March 2021; their resort to restructuring under the COVID-19 resolution framework was not significant and write-offs fell sharply year-on-year (y-o-y).
- The annual slippage ratio of all SCBs, measuring new accretions to NPAs as a share of standard advances at the beginning of the year, fell to 2.5 per cent in 2020-21 from a peak of 7.6 per cent in March 2018.
- The provisioning coverage ratio (PCR) – the proportion of provisions (without write-offs) held for NPAs to GNPA - increased from 66.2 in March 2020 to 68.9 per cent in March 2021, primarily due to a decline in GNPAs.
- The capital to risk-weighted assets ratio increased by 130 bps from 14.7 per cent in March 2020 to 16.0 per cent in March 2021.
- Stress tests indicate that the GNPA ratio of all SCBs may transition to 9.8 per cent in the baseline scenario by March 2022 and to 10.36 per cent and 11.22 per cent, under a medium stress and a severe stress scenario, respectively.
- The system level CRAR holds up well, under the two stress scenarios; banks would be able to maintain CRARs well above the regulatory minimum of 9 per cent as of March 2022 even in the worst-case scenario (Charts 6a-6h).
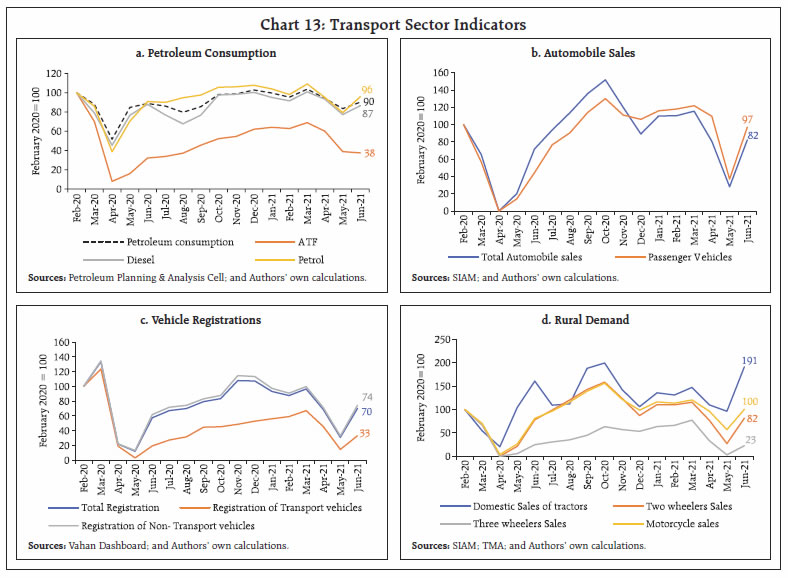
Thus, several small things are coming together to brighten the outlook. Can India assimilate them and leverage a big push? To adapt from an old adage, today’s mighty banyan is just yesterday’s seed that held its ground. Against this backdrop, the rest of this article is structured into four parts. Section II presents global developments in June and July 2021 while Section III sets out an overview of the recent unfolding of events in the domestic economy. Section IV deals with the evolution of financial conditions. The last section concludes the article. II. Global Setting The global economic recovery is getting stronger but remains uneven and unequal. Amidst pandexit challenges, rotation in demand from services to goods has averted a sharp drop in activity. The Euro area is emerging as the new growth centre, along with some EMEs where vaccination is fast paced, but a few large Asian economies are beset with renewed surges of infections and consequent lockdowns. In its forecast released on July 7, 2021, the European Commission estimates that global (excluding the EU) real GDP growth in 2021 will be 5.9 per cent (broadly unchanged from the May forecast) but growth in the Euro area and the European Union has been revised up by 0.5- 0.6 percentage points. The global composite purchasing managers’ index (PMI) moderated to 56.6 in June from a 15-year high reached in May, with the manufacturing PMI softening from a 11-year high a month ago (Chart 7). Simultaneously, cost pressures have continued to escalate. The US economy added 8,50,000 jobs in June 2021, although the unemployment rate rose marginally. In the European Union, the number of unemployed people dropped by 3,82,000 in May, boosting optimism about a rebound in the region’s labour market. The Bank of Japan’s Tankan Survey Index released on July 1 indicates that big manufacturers’ business confidence improved to a 2.5-year high in Q2:2021, raising hopes for sustained growth. According to the World Trade Organization (WTO), global merchandise trade accelerated sequentially in Q2:2021, consistent with its forecast of a growth rate of 8.0 per cent for 2021. On the other hand, monthly data on global merchandise trade volumes suggest a slowing of momentum (Chart 8a). The Baltic Dry Index, a measure of transportation prices for ships carrying dry bulk commodities, rose to a 11-year high by end-June, before easing modestly in July so far (Chart 8b). 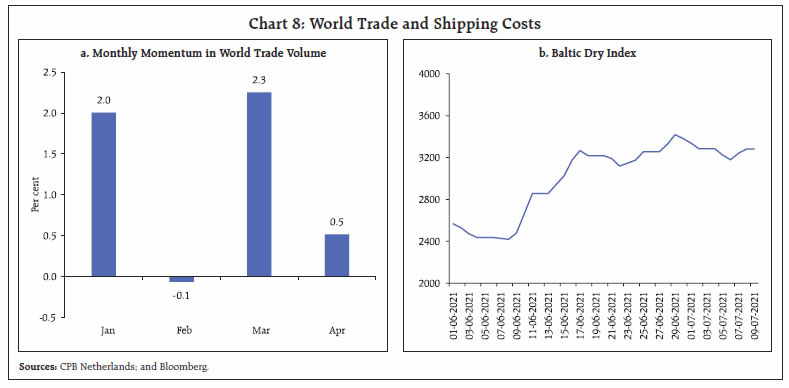 Gold prices, which were correcting in the first half of June, fell sharply after the hawkish tone of the US Federal Open Market Committee (FOMC) (Chart 9a). Prices have crept back to the psychological level of US$1,800 per ounce in the second week of July. With demand continuing to outstrip supply, crude oil prices have risen by 46.3 per cent in 2021 (up to July 8), triggered by the failure of the Organization of the Petroleum Exporting Countries (OPEC) plus to agree on easing supply in the remaining months of 2021 (Chart 9b). The Bloomberg Commodity Index, which tracks prices of 23 raw materials, moderated sharply in mid-June; rising demand is, however, lifting commodity prices again (Chart 9c). House prices have scaled multi-year/decade highs in several geographies (Chart 9d). In the financial markets, the FOMC’s statement of June 16 turned out to be a defining moment. While stock markets in advanced economies (AEs) saw only a momentary blip, equity markets in EMEs suffered sharp falls, which continued till a day after the release of FOMC meeting minutes on July 7, 2021 (Chart 10a). The US S&P index recovered from a plunge in the middle of June and rallied in a seven-session record-setting streak that ended on July 2 (Chart 10b). It has continued to peak thereafter, with the latest peak hit on July 12. Long-term US Treasury yields edged up sharply, following the FOMC’s statement, but they have ebbed and risen thereafter in accordance with the vagaries of data releases, closing at 1.29 per cent on July 8, the lowest level in more than four months. Thereafter, yields have settled at 1.36 per cent (Chart 10c). 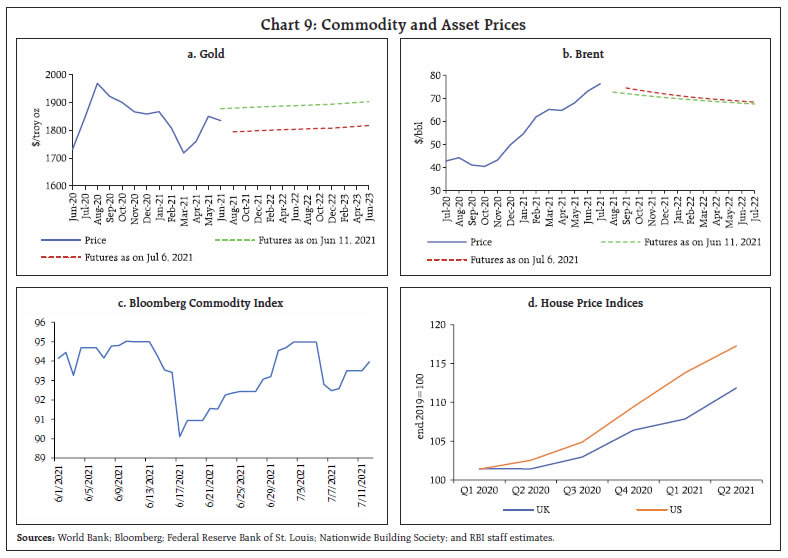 The slide in US Treasury yields is reverberating through global financial markets, propelling shares of fast-growing tech groups to new records and driving down corporate borrowing costs. Investors are suddenly being forced to reposition against a peak in growth, a peak in inflation and a peak in policy stimulus. Currency markets also responded to the FOMC’s statement, with the US dollar posting a sharp rise. Commensurately, the Morgan Stanley Capital International (MSCI) Emerging Markets Currency Index has moderated, after peaking on June 11 (Chart 10d). In June, while most EME currencies lost gains logged earlier, the Brazilian real appreciated sharply on the back of strong monetary tightening (Chart 10e). In July so far, there has been net depreciation overall for all BRICS currencies. According to the Institute of International Finance (IIF), the recent hawkish shift in the Fed’s communication affected portfolio flows to EMEs; nonetheless, overall flows in June turned out to be two and a half times higher than in May (Chart 10f). Total EME portfolio flows were US$ 28.1 billion, with debt flows continuing to account for the lion’s share. Inflation continues to ratchet up across the world. In the US, CPI inflation in June recorded largest monthly momentum in about 13 years and surged to 5.4 per cent. The Fed’s preferred measures of inflation, the y-o-y changes in the personal consumption expenditure (PCE) index and PCE excluding food and energy, at 3.9 per cent and 3.4 per cent, respectively, in May continued to be at multi-decade highs. The UK also saw inflation edging up above the target to 2.1 per cent in May and further to 2.5 per cent in June. In the euro area, however, inflation in June moderated to 1.9 per cent. Even as the Fed and the Bank of England maintained status quo on the quantum of asset purchases in their latest meetings, the Reserve Bank of New Zealand has announced winding up of its Large Scale Asset Purchase Programme and and Centrl Banks of a few other AEs have given forward guidance on unwinding of monetary stimulus in H2:2021. While the summary of economic projections submitted at the FOMC meeting (June 15-16) signaled a tightening of monetary policy in the US earlier than projected in the March meeting, it was subsequently followed by a dovish statement from Chairman Powell reiterating the Fed’s commitment to achieving an inclusive recovery. In a move to ease money market pressure and to prevent negative yields from taking hold, the Fed increased the interest rate paid on required and excess reserve balances by 5 bps to 0.15 per cent, effective June 17, 2021. It also hiked the offering rate on overnight reverse repo program (ON RRP) by 5 bps to 0.05 per cent. The ON RRP operations have seen record deposits in recent months, reaching a high of US$ 992 billion at end-June, which effectively amounts to a one-day absorption of more than 8 months of asset purchases under the current quantitative easing programme of the Fed. On July 8, 2021, the European Central Bank (ECB) unveiled its new monetary policy strategy under which a symmetric 2 per cent inflation target has been adopted as against the earlier target of below but close to 2 per cent4. Due to the effective lower bound on policy rates, there will be resort to other instruments such as forward guidance, asset purchases, longer-term refinancing operations and other new policy instruments as required. The ECB also announced a detailed roadmap, up to 2024, for its comprehensive action plan on climate change. The result of the ECB’s strategy review, the first since 2003, is a modest but welcome update, helping to make its goals clearer. The new target jettisons the central bank’s hawkish bias. This makes sense as the ECB has consistently undershot its inflation target since the 2008 financial crisis. The Reserve Bank of Australia has shortened the maturity at which it practices yield curve control, while also continuing bond purchases at a slower pace than before after the completion of the current tranche of quantitative easing. Among major EMEs, Brazil effected its third rate hike in 2021 so far of 75 basis points (bps) in June. The Banco de México also raised its policy rate by 25 bps to 4.25 per cent on inflation concerns, after having cut rates as recently as in February. On the other hand, China has lowered the reserve requirement ratio for most financial institutions by 0.5 percentage points effective July 15, 2021. This is expected to release 1 trillion yuan of liquidity to support the real economy. III. Domestic Developments The tapering of the second wave, coupled with an aggressive vaccination push, has brightened near-term prospects for the Indian economy. The total number of active cases has plunged below 4.3 lakhs and the 7-day moving average of inoculations is above 37 lakhs (13 July 2021). With many states lifting restrictions in recent weeks, the Google and Apple mobility indicators are set to surpass their levels recorded at this time last year (Chart 11a and 11b). Electricity generation readings, too, have recovered to levels comparable to the pre-pandemic year, i.e., 2019 (Chart 11c). Aggregate Demand Aggregate demand conditions are recovering, spurred by unlock measures and the pace of vaccination. Average daily E-way bill collections improved substantially from June 20, 2021, reflecting the underlying improvement in economic activity. Intra-state E-way bills fared better than inter-state E-way bills, normalising to beyond pre-pandemic levels (Chart 12a). Toll collections, too, posted a sharp increase sequentially in June by 35.5 per cent in volume terms and 21.2 per cent in value terms. Normalised to February 2020 levels, collections recovered appreciably from levels last seen in October 2020 (Chart 12b). Fuel consumption recorded an increase in June 2021, although it remained below the pre-pandemic baseline of February 2020. While petrol and diesel consumption both recorded sequential improvements, aviation turbine fuel (ATF) slipped marginally, with the aviation sector still grappling with the impact of the second wave (Chart 13a) Automobile sales posted a strong turn around, reaching 82 per cent of sales recorded in pre-pandemic February 2020, with passenger vehicles near normalising (Chart 13b). With over 80 per cent of retail outlets now operational, retail sales registered a m-o-m spurt by 127.0 per cent in June. Transport vehicles hit a growth of 127.6 per cent, while non - transport vehicles grew by 126.9 per cent, sequentially, as per the Vahan registrations dashboard (Chart 13c). The impact of the second wave on rural demand abated, with motorcycle and two wheeler sales recording recovery in June 2021, even as three wheelers continued in red (Chart 13d). In the rural space, the tractor segment bounced back strongly during June, enabled by easing of restrictions and better monsoon prospects. 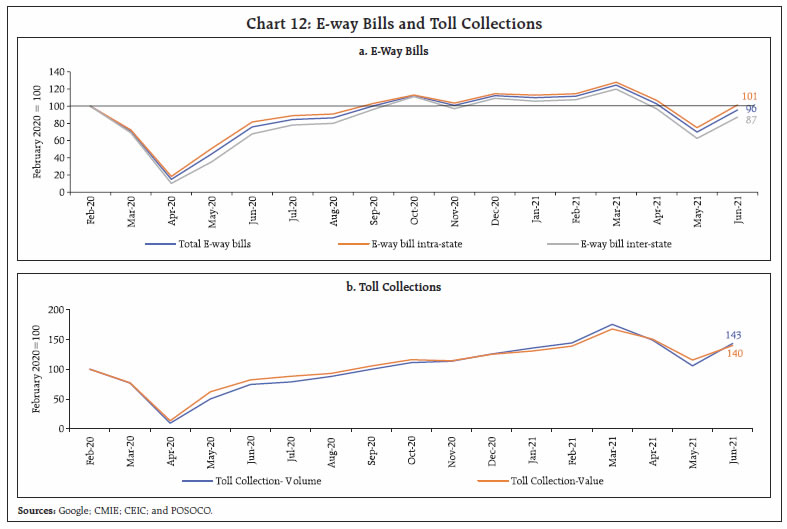
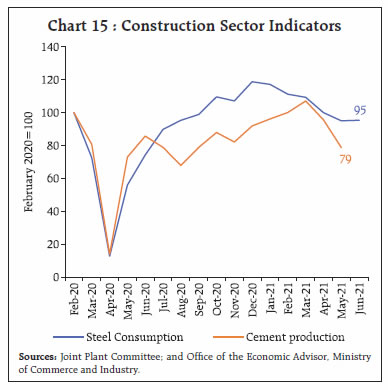
 Indian Railways freight loading continued to be impressive, marking an increase of 20.5 per cent in June (112.8 million tonnes) over its level a year ago (93.6 million tonnes). Of the major commodities, coal and iron ore freight moderated sequentially, while that of cement increased - an indication of construction activity picking up (Chart 14). The fast-moving consumer goods (FMCG) sector staged a smart recovery, expanding by almost 40 per cent sequentially in June 2021 with all segments hitting double digit growth5. The construction sector registered positive growth y-o-y in May-June 2021 but due to a low base effect. Normalised to February 2020 levels, steel consumption and cement production treaded below the baseline (Chart 15). Housing sales have turned the corner, growing by 83 per cent in April-June 2021 over a year ago6 mainly on account of pent-up demand, stamp duty cuts and lower interest rates. 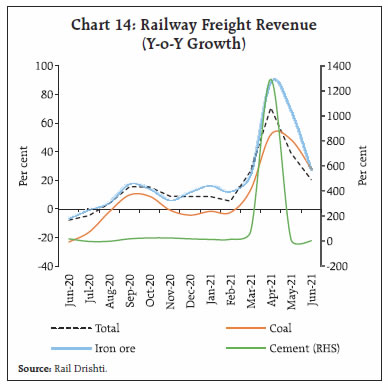
 As per the household survey of the Centre for Monitoring Indian Economy (CMIE), the employment situation has been improving since the second week of June 2021. The unemployment rate improved to 9.17 per cent in June from a 12-month high of 11.9 per cent in May (Chart 16). In the rural space, the demand for work under Mahatma Gandhi National Rural Employment Guarantee Scheme (MGNREGS) was lower by 21.5 per cent in June 2021 over last year7. Kharif sowing and gradual lifting of covid restrictions provided workers with alternative employment opportunities. Coming to fiscal policy, the union government announced yet another fiscal stimulus package on June 28, 2021 amounting to ₹6.3 lakh crore, in addition to measures worth ₹17.2 lakh crore announced through 2020-21. The latest set of measures are dominated by liquidity schemes, including enhancement of the Emergency Credit Line Guarantee Scheme (ECLGS) by ₹1.5 lakh crore; a loan guarantee scheme for COVID affected sectors under which loans amounting to ₹1.1 lakh crore will be disbursed to eligible businesses in specified sectors on guarantee provided by the National Credit Guarantee Trustee Company Limited (NCGTC); and a credit guarantee scheme for micro finance institutions under which loans up to ₹1.25 lakh will be provided to 25 lakh small borrowers through micro finance institutions (MFIs) on guarantees provided by the NCGTC (Table 2). 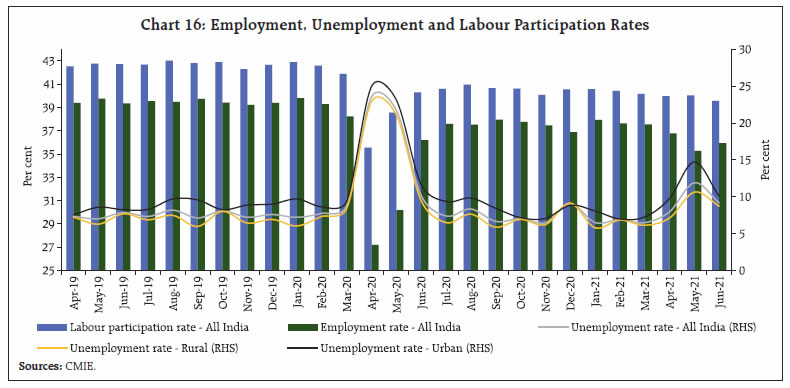
| Table 2: Summary of Fiscal Package Announced in June, 2021 | | Economic Relief for the Pandemic | Strengthening Public Health | Impetus for Growth and Employment | | Emergency Credit Line Guarantee Scheme | Additional outlay for strengthening public health infrastructure | Extension of tenure of PLI scheme for large scale electronics manufacturing | | Loan Guarantee Scheme for COVID affected sectors | | Boost to Export Insurance Cover through ECGC | | Credit Guarantee Scheme for Micro Finance Institutions | | Boost for Project Exports through National Export Insurance Account (NEIA) | | Free one month tourist visa to 5 lakh tourists | | Additional outlay for expansion of BharatNet to cover all Gram Panchayats and inhabited villages. | | Extension of Aatma Nirbhar Bharat Rozgar Yojana (ANBRY) | | Reform-Based Result- Linked Power Distribution Scheme | | Free foodgrains during May-November | | New streamlined process for PPP Projects and Asset Monetization | | Additional outlay for fertiliser subsidy | | Revival of North Eastern Regional Agricultural Marketing Corporation (NERAMAC) | | | | Release of climate resilient special traits varieties | Monthly accounts of the union government indicate a marked improvement in the fiscal position during April-May 2021. Despite the slowdown in economic activity due to the second wave, tax revenues remained buoyant, attributable to increased compliance. This was complemented by a higher than budgeted surplus transfer by the Reserve Bank in May. On the expenditure front, revenue expenditure has been kept under check; the growth of 38.4 per cent in capital outlay over a year ago supports the prospects of the recovery. The gross fiscal deficit of the central government recorded during April-May was only 8.2 per cent of budget estimates (BE), a stark departure from trend (Chart 17). With world merchandise trade regaining strength, India posted robust export growth (Chart 18 a and b). Preliminary data released by the Ministry of Commerce and Industry shows that India’s merchandise exports surpassed the US$ 30 billion mark for the fourth consecutive month in June 2021 (Chart 19a). Moreover, non-oil export growth has been in positive territory for the 10th consecutive month now. This expansion was broad-based, with 25 out of 30 major commodity groups picking up over pre-pandemic levels, including engineering goods, petroleum products, organic and inorganic chemicals, agriculture and allied products, cotton yarn and plastics (Chart 19b).
The continued upsurge in freight rates, especially of container freight, has become a major cause of global concern (Chart 20). Rates on major routes like China-Europe, which also serves India’s trade with Europe, have crossed US$ 10,000/TEU8, more than five times the usual rates. India’s merchandise imports posted a growth of nearly 100 per cent y-o-y in June exceeding pre-pandemic level (Chart 21a and b). Non-oil non-gold imports have stayed above the US$25 billion mark for the seventh month in a row, boding well for the revival of domestic activity. Import growth has been broad-based with 28 sectors out of 30 major sectors expanding over a year ago. Capital goods imports – one-third of India’s total imports - surpassed pre-COVID levels during Q1:2021-22. Interestingly, IIP-manufacturing shows a positive correlation (0.51) with previous month’s capital goods imports, implying that a pickup in IIP manufacturing may be due (Chart 22).
India’s trade account recorded a deficit in June 2021 as against a marginal surplus in June 2020, but it was still below pre-pandemic levels. Aggregate Supply Sowing for the kharif season covered 499.9 lakh hectares (around 46 per cent of the total acreage) by July 09, 2021. The progress of sowing has, however, been relatively muted, i.e., 10.4 per cent lower than a year ago on account of inroads of the second wave into rural areas, hot weather leading to power slack and break in the monsoon’s progress. As of July 12, the cumulative rainfall in this season was 7 per cent below the long period average (LPA) as against 13 per cent above a year ago (Table 3). This is also reflected in fertiliser sales which remained subdued till May (Chart 23 a and b). The major kharif crops like rice and sugarcane are less dependent on rains, with 60 per cent and 95 per cent of the total area under these crops, respectively, irrigated. On the other hand, crops like pulses, coarse cereals and oilseeds are largely rain-fed (Chart 24). Storage in water reservoirs is comfortable at 31 per cent of the capacity as against the decadal average of 25 per cent. With record procurement of cereals, the public stocks are 3.7 and 8.1 times the buffer norms for rice and wheat, respectively. Table 3: Subdivision-wise Rainfall Distribution
(cumulative from June 1 to July 12, 2021) | | Sub-Divisions | Actual (mm) | Normal (mm) | Departure from normal (per cent) | | East and North East | 481.2 | 521.5 | -8 | | North West | 117.4 | 144.1 | -19 | | Central | 266.0 | 286.6 | -7 | | South Peninsula | 255.7 | 239.5 | 7 | | All India | 252.6 | 270.9 | -7 | | Source: India Meteorological Department. | Tumbling under the weight of the second wave, the headline manufacturing PMI suffered contraction for the first time in the last 11 months, with a reading of 48.1 in June 2021 vis-à-vis 50.8 a month ago. Output and new orders lost the most, contributing to the overall decline in the index (Chart 25a). The services PMI contracted for the second consecutive month to 41.2 in June from 46.4 a month ago. Subdued demand and business closures amidst the second wave were cited as the primary reasons for contraction (Chart 25b).
Inflation The NSO’s July 12 data release showed that headline CPI inflation printed at 6.3 per cent in June 2021, unchanged sequentially after the surge of 2.1 percentage points in May (Chart 26a). A positive price momentum (month-on-month change in prices in the current month) of around 60 bps from food and fuel was completely offset by a favourable base effect (month-on-month change in prices a year ago) of 60 bps, keeping headline inflation unchanged. Among CPI groups, CPI food and beverages inflation increased to 5.6 per cent in June from 5.2 per cent in May. An uptick in inflation in eggs, milk, oils and fats, pulses and prepared meals, a lower rate of deflation in vegetables prices and the movement of sugar prices out of deflation contributed to this pick-up. On the other hand, cereals prices moved further into deflation and inflation in meat and fish and spices softened substantially. Fuel inflation surged to a record 12.7 per cent in June from 11.9 per cent in May, driven by LPG, kerosene, firewood and chips and dung-cake and impacting both urban and rural consumers. Fuel (weight of 6.84 per cent in the CPI) contributed around 13 per cent of headline inflation in June (Chart 26b). CPI inflation excluding food and fuel or core inflation softened by around 50 bps to 6.1 per cent in June from 6.6 per cent in May, benefiting from a near zero month-on-month price momentum and favourable base effects. Among its sub-groups, pan, tobacco and intoxicants registered a sharp fall in inflation as the impact of the one-off tax increases a year ago waned off. Inflation in housing, health, transport and communication, recreation and amusement, and personal care and effects also softened. On the other hand, a substantial pick-up in inflation was observed in clothing and footwear, household goods and services, and education. High frequency food price data from the Ministry of Consumer Affairs, Food and Public Distribution (Department of Consumer Affairs) indicate that cereals prices remained steady in the first half of July. Prices of pulses declined further in July as have edible oils prices, albeit at still elevated levels, for the first time since early 2020. Among the key vegetables, prices of potatoes, onions and tomatoes are seeing the usual seasonal pick-up in prices; however, on a y-o-y basis, prices of potatoes and tomatoes are substantially lower (Chart 27). 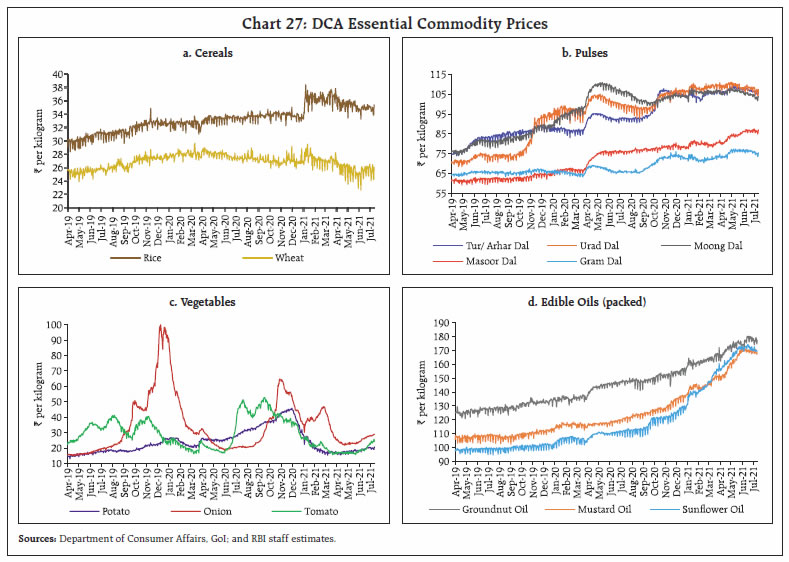
| Table 4: Petroleum Product Prices | | Item | Unit | Domestic Prices | Month-over- month (per cent) | | Jul-20 | Jun-21 | Jul-21^ | Jun-21 | Jul-21 | | Petrol | ₹/litre | 83.34 | 98.35 | 101.79 | 4.2 | 3.5 | | Diesel | ₹/litre | 78.77 | 91.00 | 93.25 | 5.0 | 2.5 | | Kerosene (subsidised) | ₹/litre | 21.70 | 32.13 | 33.34 | 0.0 | 3.8 | | LPG (non- subsidised) | ₹/cylinder | 604.75 | 819.63 | 845.13 | 0.0 | 3.1 | ^: For the period July 1 -12, 2021.
Note: Other than kerosene, prices represent the average Indian Oil Corporation Limited (IOCL) prices in four major metros (Delhi, Kolkata, Mumbai and Chennai). For kerosene, prices denote the average of the subsidised prices in Kolkata, Mumbai and Chennai.
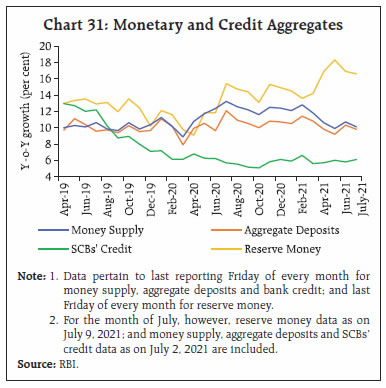
Sources: IOCL; Petroleum Planning and Analysis Cell (PPAC); and RBI staff estimates. | Pump prices of petrol in all major metros have exceeded ₹100 per litre in the first half of July, with an average price (pump prices in the four major metros) of ₹102.92 per litre as on July 12, 2021. Diesel pump prices were also high at ₹93.52 per litre. After remaining steady for the last two to three months, kerosene and LPG prices have also registered increases in July so far (Table 4). Input costs, as reflected in the PMIs, registered increases in June across manufacturing and services, but the rate of increase in costs moderated. Selling prices for manufacturing and services also registered increases in June though the extent of pass-through of input costs was muted. IV. Financial Conditions Amidst pandemic-stressed times, the Reserve Bank has been striving to soothe financial market sentiment by steering both systemic and sector-specific liquidity and financial conditions in a manner consistent with its monetary policy stance. In its June 4, 2021 bi-monthly meeting, the Monetary Policy Committee (MPC) kept the policy rate unchanged at 4 per cent and persevered with the stance of remaining accommodative as long as necessary to revive and sustain growth on a durable basis. In pursuance of this stance, the Reserve Bank announced a special liquidity facility for the Small Industries Development Bank of India (SIDBI) to meet the funding requirements of micro, small and medium enterprises (MSME), an on-tap liquidity window for contact-intensive sectors, and enhanced exposure thresholds (from ₹25 crore to ₹50 crore) under the MSME resolution scheme. Accordingly, financial conditions eased in June relative to preceding months (Chart 28). 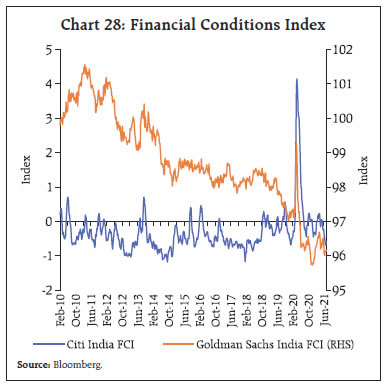 Various indicators of monetary, liquidity and credit conditions also confirm the easing of financial conditions (Table 5). Surplus liquidity conditions prevailed in the system, with daily net absorption under the liquidity adjustment facility (LAF) averaging ₹4.86 lakh crore through June 2021 and ₹5.90 lakh crore during July (up to July 12) up from ₹4.69 lakh crore a month ago (Chart 29). On June 17, the Reserve Bank injected system-level liquidity through the third tranche of purchases under the Government Securities Acquisition Programme (G-SAP) 1.0 amounting to ₹40,000 crore. The Reserve Bank also conducted the first auction of G-SAP 2.0 on July 8 and injected durable liquidity of ₹20,000 crore. 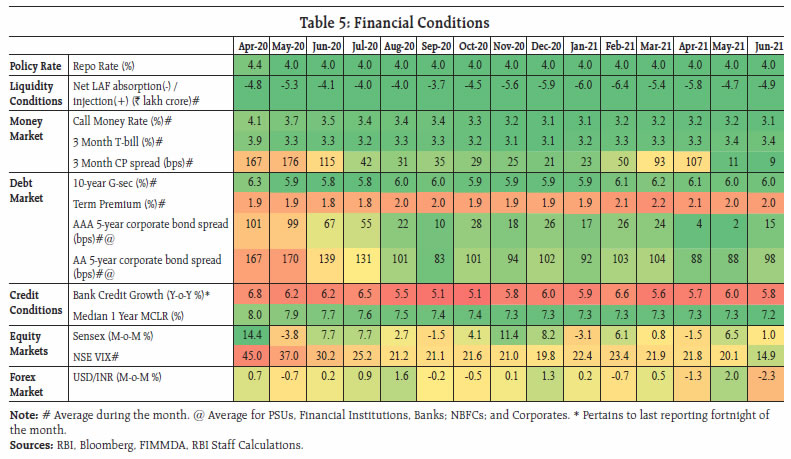 Amidst comfortable liquidity conditions, overnight rates – the weighted average call rate (WACR), the tri-party repo and the market repo rate - trailed below the reverse repo rate by 21 bps, 12 bps and 8 bps, respectively, on average through June-July 2021 (up to July 12). Outer on the term curve, 3-month certificates of deposit (CD) rates and 3-month commercial paper (NBFC) rates firmed up by 20 bps and 15 bps, respectively, during June-July 2021 (up to July 12) on inflation concerns. On the other hand, the 3-month T-bill rate remained largely stable (Chart 30). 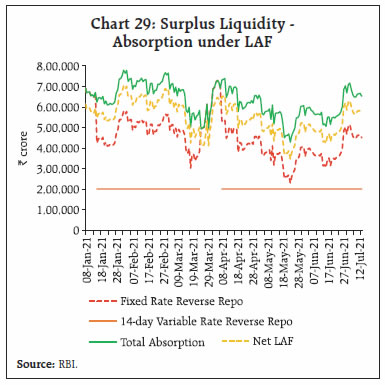 Reserve money (RM) – a stylised depiction of the Reserve Bank’s balance sheet to reflect its ‘moneyness’ – expanded by 16.6 per cent on a y-o-y basis as on July 9, 2021 (13.9 per cent a year ago), driven mainly by a pickup in bankers’ deposits with the Reserve Bank with the normalisation of the cash reserve ratio (CRR) cut of March 2020 (Chart 31). Furthermore, growth in currency in circulation – the largest component of RM – eased to a 16-month low of 11.5 per cent (21.4 per cent a year ago), reflecting the easing of the ‘dash for cash’. Money supply (M3) growth slowed to 10.1 per cent as on July 2, 2021 (12.4 per cent a year ago), below its decennial average (2012-21) of 10.9 per cent. While deposit growth remained healthy at 9.8 per cent, scheduled commercial banks’ (SCBs’) credit to the commercial sector recorded a growth of 6.1 per cent (6.3 per cent a year ago). Augmented by banks’ investments in statutory liquidity ratio (SLR) and non-SLR securities, the flow of banks’ funds to the economy expanded by 6.8 per cent (9.7 per cent a year ago). 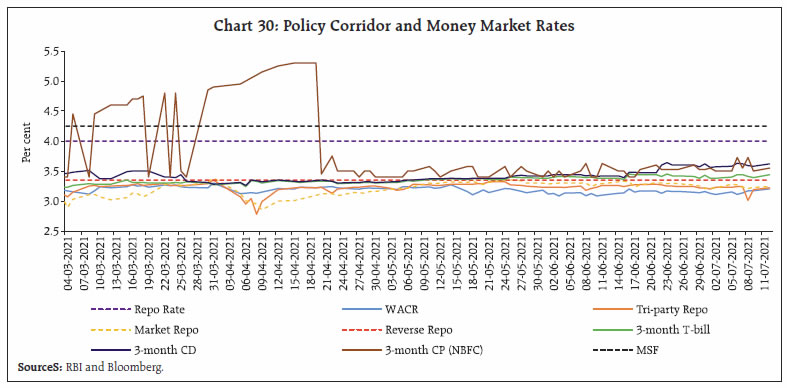
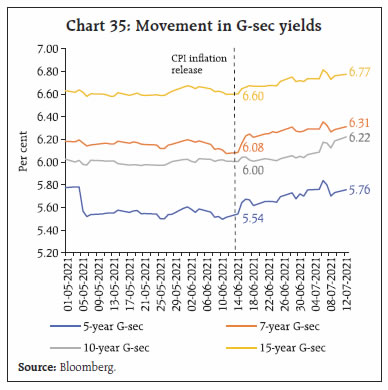
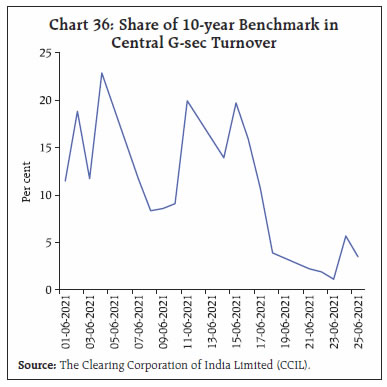
 The pass-through of policy rate changes to lending and deposit rates of SCBs has been improving since March 2020. The 1-year median marginal cost of funds-based lending rate (MCLR) softened cumulatively by 100 bps through March 2020 to June 2021, while the median term deposit rate on fresh deposits across all tenors moderated by 149 bps (Chart 32). The interest rate on deposits of maturity of up to one year declined by 174 bps (Chart 33). Asymmetry in monetary transmission to term deposit rates across bank groups is attributable to the composition of deposit portfolios, with foreign banks mainly garnering low cost and lower duration wholesale deposits. In contrast, public sector banks, which rely more on retail deposits, face competition from alternative instruments like small savings. The Government of India (GoI) reviewed interest rates on small saving schemes on June 30, 2021 and left them unchanged for Q2:2021-22 amidst a moderation in household financial savings. 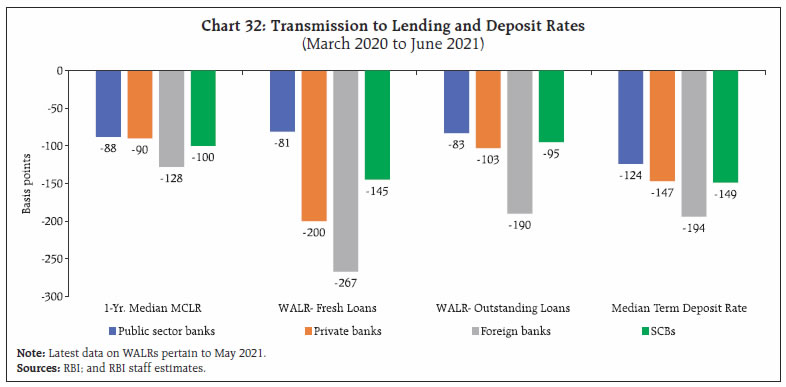 A recent survey shows9 that the cost of capital embodied in India’s average cost of equity10 – a threshold rate used to evaluate the efficiency of the use of funds – declined by 100 basis points (bps) since 2017 across sectors including real estate, healthcare (including pharmaceuticals and life sciences) and renewables. If asset reconstruction companies (ARCs) and start-ups are excluded, the cost of equity dropped by 150 bps. 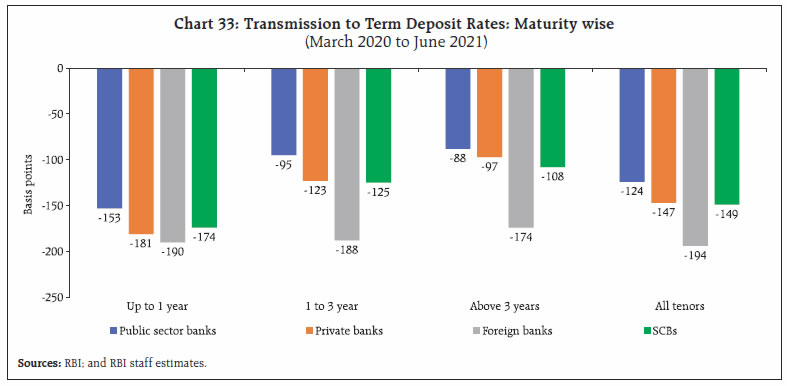 In the financial markets, government securities (g-sec) yields hardened from mid-June, with repricing of market expectations following the headline CPI inflation print for May 2021 breaching the upper tolerance band around the target. The 2 year and 5 year overnight index swap (OIS) rates, which measure interest rate expectations, surged by 21-20 basis points during June-July 2021 (upto July 12) (Chart 34). Concomitantly, the yields on government securities traded higher across the curve (Chart 35). The previous 10-year benchmark (5.85 GS 2030) hardened by 17 bps during July 2021 (upto July 12), taking cues from surging crude oil prices. Trading volumes for the 10 year security in the secondary market segment remained subdued during June 2021 in anticipation of a new 10 year announcement (Chart 36). In the primary market, gross borrowings by the central government thus far (up to July 9) at ₹3.8 lakh crore amounted to 52 per cent of the scheduled borrowing of ₹7.24 lakh crore for H1:2021-22. With bids in primary issuances out of alignment with secondary market yield movements and the monetary policy stance, the two auctions conducted during the second fortnight of June 2021 witnessed devolvement on primary dealers – 25 per cent of the notified amount of the 5 year benchmark in the June 18 auction and 97 per cent of the notified amount of GS 2023 in the June 25 auction. Furthermore, the Reserve Bank did not accept any bids for the 10 year benchmark security in the June 25 auction. In the first auction in July, the auction methodology of benchmark securities of tenors of 2 years, 3 years, 5 years, 10 years, 14 years and Floating Rate Bonds (FRBs) was changed from multiple price-based to uniform price-based auctions. 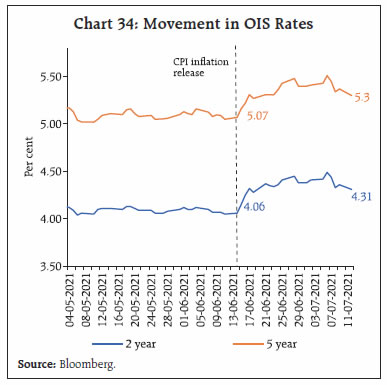
 In his monetary policy statement in October 2020, Governor Shri Shaktikanta Das had stated that an orderly evolution of the yield curve is a public good and both market participants and the Reserve Bank have a shared responsibility in this regard. He had assured market participants that the Reserve Bank stands ready to conduct market operations as required through a variety of instruments to assuage these pressures. This guidance was reinforced in both primary and secondary market operations by auction cut-offs, devolvement, cancellations and exercise of green shoe options. The primary auction conducted on July 9, 2021 saw a positive response from market participants to this forward guidance, especially in bids received for the new 10-year benchmark security (New GS 2031) for which the cut-off yield was set at 6.10 per cent. It is expected that this convergence between policy guidance and market expectations will set the tone for the orderly evolution of yields going forward. Tracking the movements in G-sec yields, corporate bond yields for AAA rated borrowers firmed up across different tenors, with yields on bonds maturing in 3 years, 5 years and 10 years ruling higher by 11 bps, 21 bps and 20 bps up to July 8, respectively, since mid- June, 2021 (Chart 37). During June, equity markets in India were buoyed by the sustained dip in COVID-19 cases, pick-up in vaccination and prospects of a gradual unlocking of the economy amidst positive global cues (Chart 38). The benchmark BSE Sensex scaled fresh highs multiple times, crossing the 53,000 mark for the first time in intra-day trade on June 22, 2021. Markets corrected in the ensuing days, with some profit booking as the Fed put forth its timeline for interest rate hikes and revised upwards its inflation forecasts. In the month of July 2021, however, slack in some high frequency indicators and weak global cues may have contributed in profit-booking, with the Sensex closing at 52,373 on July 12, 2021. 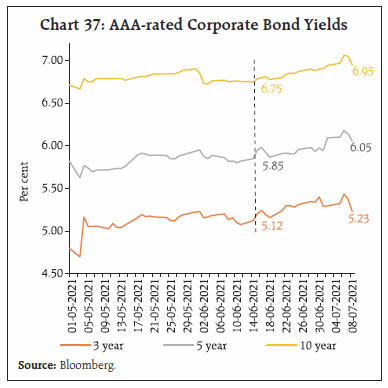 During April-June 2021, flows into equity-oriented schemes were higher by 32.2 per cent y-o-y amidst improving risk appetite and renewed interest vis-à-vis a decline of 31.3 per cent a year ago (Chart 39a). Premium collections by insurance companies during April-June 2021 were higher by 9.9 per cent y-o-y, driven by a surge in the non-life insurance segment (Chart 39b). India’s current account recorded a surplus of 0.9 per cent of GDP in 2020-21, as against a deficit of 0.9 per cent a year ago. A sharp contraction in the trade deficit was the major driver, even as net services receipts, especially software, remained resilient. Inbound remittances also improved steadily from Q2:2020-21, aided by better income conditions in sender countries and the rise in crude oil prices. India’s net international investment position improved by US$ 22.7 billion during the year (i.e., fall in non-residents’ claims on India). A robust accretion to foreign exchange reserves in 2020-21 has improved its coverage of short-term debt (on residual maturity basis) to 226.9 per cent at end-March 2021 from 201.8 per cent a year ago (Table 5).
Table 5: Key External Vulnerability Indicators
(End-March) | | (Per cent, unless indicated otherwise) | | Indicator | 2020 | 2021 | | 1. External Debt (US$ billion) | 558.4 | 570.0 | | 2. External Debt to GDP Ratio | 20.6 | 21.1 | | 3. Short-term Debt (RM) to Total Debt Ratio | 42.4 | 44.6 | | 4. Reserves to short-term Debt (RM) Ratio | 201.8 | 226.9 | | 5. Reserves to Total Debt Ratio | 85.6 | 101.2 | | 5. Reserves Cover of Imports (in months) | 12.0 | 17.4 | | 6. Net IIP (US$ billion)# | -375.4 | -352.7 | | 7. Net IIP to GDP Ratio# | -13.9 | -13.1 | RM: Residual Maturity.
IIP: International Investment Position.
#: Negative sign indicates non-residents’ net claims on India.
Source: RBI. | With the improving domestic outlook and gradual easing of COVID-related restrictions, net FPI investment was to the tune of US$ 1.0 billion in June 2021 (Chart 40). Foreign exchange reserves reached an all-time high of US$ 610 billion on July 2, 2021, equivalent to 18.4 months of 2020-21 imports (Chart 41). These developments were reflected in the foreign exchange market. The Indian rupee (INR) depreciated against the US dollar in June on the back of strengthening of US dollar, rising crude oil prices and FPI sell-offs. The INR depreciated by 0.4 per cent vis-à-vis US dollar from its level a month ago. The surge in domestic headline inflation and concomitant widening of inflation differentials between India and its major trading partners induced an appreciation in the 40-currency real effective exchange rate (REER) of the INR in May 2021, which moderated due to depreciation of INR in nominal terms in June 2021 (Charts 42a & b).
Payment System The digital payment ecosystem has displayed resilience through the second wave, sustaining a healthy expansion (Table 6). Daily average transactions across major payment modes, viz., the Real Time Gross Settlement (RTGS), National Electronic Funds Transfer (NEFT), Unified Payments Interface (UPI), Immediate Payment Service (IMPS), and National Electronic Toll Collection (NETC) have rebounded after a brief moderation in the month gone by, in tandem with the resumption of consumer and business activities. The UPI hit an all-time high of 2.8 billion transactions worth ₹5.47 trillion in June, reflecting the growing adaptability of digital payments channels to pandemic conditions. Conclusion A deadly heat wave sweeps across the northern hemisphere, with temperature at all-time highs in even the most temperate countries. Deaths by the hundreds are being recorded in Canada, the US, Central Europe and even arctic Russia. In India, where the monsoon had stalled till the second week of July, the heat is blistering – it was 31 degrees Celsius in Ladakh’s Nubra valley on July 1, 2021! Elsewhere, the temperature was pushing above 40 degrees in Delhi, Haryana, Uttar Pradesh and Rajasthan11. All this is a grim reminder of the crisis that brews unseen – the climate. Consequently, as this article has been flagging since its March 2021 edition, climate change risks are redefining the mandate of central banks, especially in the conduct of monetary policy. In this context, the Network for Greening the Financial System (NGFS), which the Reserve Bank joined in April 2021, has set out some good principles for voluntary adoption in order to refashion the operational design of monetary policy to incorporate climate change risks12 (Table 7). The objective is to shield central bank balance sheets against increasing financial risks arising from climate change. On July 11, 2021 the Financial Stability Board called for ‘globally consistent, comparable and reliable disclosures as well as a high quality and relevant data’ to support central banks’ actions13. It is important, however, to recognise that central banks also face sharp trade-offs when dealing with climate-related risks. On the one hand, central banks have to operate within their specific legal frameworks, and as publicly accountable institutions, they have to provide rigorous evidence in support of all actions they take. On the other hand, central bank balance sheets might already be exposed to climate-related risks and they may be forced to respond to them from behind the curve. 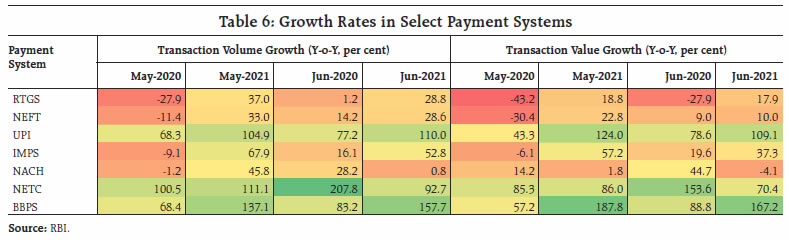
| Table 7: Options for Adjusting Operational Frameworks to Climate-related Risks | | Credit Operations | | 1. Adjust pricing to reflect counterparties’ climate-related lending | Make the interest rate for central bank lending facilities conditional on the extent to which a counterparty’s lending is contributing to climate change mitigation | | 2. Adjust pricing to reflect the composition of pledged collateral | Charge a lower (or higher) interest rate to counterparties that pledge a higher(or lower) proportion of low- carbon assets as collateral/ set up a credit facility accessible only against low-carbon assets | | 3. Adjust counterparties’ eligibility | Make access to lending facilities conditional on a counterparty’s disclosure of climate-related information or on its green investments. | | Collateral | | 4. Adjust haircuts | Adjust haircuts to better account for climate-related risks | | 5. Negative screening | Exclude otherwise eligible collateral assets, based on their issuer-level climate-related risk profile for debt securities | | 6. Positive screening | Accept sustainable collateral so as to incentivise banks to lend or capital markets to fund projects and assets that support environmentally friendly activities | | 7. Align collateral pools with a climate- related objective | Require counterparties to pledge collateral such that it complies with a climate-related metric at an aggregate pool level. | | Asset Purchases | | 8. Tilt purchases | Skew asset purchases according to climate-related risks and/or criteria applied at the issuer or asset level. | Note: Adapted from NGFS (2021)
Source: NGFS (2021) | In the wake of the pandemic, extreme uncertainty has clouded the global outlook. In response, monetary policy authorities have sought to impart some certainty by committing to a stance of ultra-accommodation into the future. Inflation has rocked this boat; markets are buzzing with static about the hand of the authorities being forced into reversing their stance sooner than they have committed to in order to prevent the economy from overheating. Bond yields spiked as the end of reflation trade seemed to be in sight. At stake for markets is the orderly evolution of financial prices. At stake for central banks is the weak economy which would not be able to withstand liquidity and rate tightening in its current state of health, and the fragile recovery that is being painstakingly scripted could be at risk. So, they have put their inflation credibility on the line, challenging the market’s view by renewing their commitment to stay accommodative or to undertake a very gradual, multi-year adjustment. The key, as in the rest of life, is to strike the right balance. | Table 8: Recent Rate Hikes by Central Banks | | Sr. No. | Name of the Central Bank | Total quantum and number of hikes in 2021 | Rate Hike Month(s) | Excerpts from Policy Statement (latest) | | 1 | Banco Central do Brasil | 225 bps/ Three | March, May, June | This adjustment is necessary to mitigate the dissemination of the temporary shocks to inflation | | 2 | Bank of Russia | 125 bps/ Three | March, April, June | The contribution of persistent factors to inflation is increasing due to faster growth of demand compared to output expansion capacity. Indicators reflecting the most sustainable price movements also rose | | 3 | Banco de México | 25 bps / One | June | The shocks that have affected inflation are expected to be of a transitory nature | | 4 | Czech National Bank | 25 bps / One | June | Higher-than-expected growth in domestic fundamental market wages at the start of the year and a higher outlook for administered prices next year are acting in the inflationary direction | | 5 | Magyar Nemzeti Bank (Hungary) | 30 bps / One | June | In order to ensure price stability, to prevent the lasting effects of inflation risks and to anchor inflation expectations, it is warranted to launch a cycle of interest rate hikes | | 6 | Central Bank of Iceland | 25bps / One | May | Inflation has been higher and more persistent than previously forecast. Inflationary pressures appear to be widespread, as underlying inflation is broadly similar to headline inflation. Due to a number of factors, including the depreciation of the króna in 2020 and steep rises in wages and house prices. | | 7 | Central Bank of the Republic of Turkey | 200 bps / One | March | The policy rate will continue to be determined at a level above inflation to maintain a strong disinflationary effect until strong indicators point to a permanent fall in inflation and the medium-term 5 per cent target is reached. | | Source: Websites of various central banks. | Subsequently, there has been a convergence of market inflation expectations in advanced economies with the central banks’ view that the inflation hump is transitory. In emerging market economies, however, capital flows have reversed, and currencies have weakened as some central banks have undertaken policy interest rate increases even when they regard inflation pressures as transitory (Table 8). Let us argue the counter factual: what if the central banks were to acquiesce to shrill cries from markets to respond pre-emptively to inflation pressures against the judgment that they are transitory? This has actually happened: the Fed’s June ‘pivot’ dating the future rate increases in response to the rising mercury of inflation has taken the shine off reflationary trade, which was betting on higher inflation as growth normalises with the ramping up of vaccination. Safe haven demand for longer dated paper has taken yields down substantially from recent highs. Shorter term yields have reacted even more to monetary policy, flattening the yield curve and denting confidence in the reflation trade. Carry traders like a yield curve that is steep, capturing expectations of future policy rate increases, but it is sobering to remember that ‘steepener’ bets from shorters that profit when longer dated bond prices fall faster than those of shorter dated ones have been wrong footed, leading to sharp losses. It takes less bad news today to create the same volatility! In India, a similar dialectic is at play, except that the cycle of divergent expectations is yet to peak. Inflation ruled above the tolerance band during June-November 2020 and has again moved above the upper tolerance threshold in May and June 2021. The sense is that inflation will persist at these elevated levels for some months before easing in the third quarter of 2021-22 when the kharif harvest arrives in markets. The economy is struggling to regain the momentum of recovery that had started in the second half of 2020-21 but was interrupted by the second wave. The pick-up in inflation is driven largely by adverse supply shocks due to disruptions caused by the pandemic, including increases in margins and taxes. There are also specific demand-supply mismatches as in the case of protein-rich food items, edible oils and pulses, which are being addressed by specific supply-side measures. But more needs to be done. Elevated international commodity prices, especially of crude, are also imparting cost-push pressures. These factors should ease over the year as supply side measures take effect. Furthermore, a solid increase in aggregate demand is yet to take shape. Even with a 9.5 per cent GDP growth in 2021-22, there will be substantial slack in the economy and demand pressures may take some more time to become evident.
|