The consolidated balance sheet of NBFCs grew at a slower pace in Q2 and Q3:2020-21 following the pandemic and muted credit demand. NBFCs continued to disburse credit despite disruptions caused by the pandemic, albeit at a slower pace. The retail sector benefitted from incremental credit from NBFCs, partly aided by their low GNPA ratios and the ability of NBFCs to adapt to customer preferences. The profitability of the NBFCs improved in Q2:2020-21 compared to the corresponding quarter of the previous year as fall in expenditure was steeper than fall in income. The asset quality of NBFCs witnessed improvement in 2020-21 so far, compared to Q4:2019-20 on account of regulatory forbearance; the full effect of the pandemic on asset quality, however, may only become evident over time. Introduction The Non-Banking Financial Companies (NBFC) sector in India has traversed highs and lows to reach where it is today. Their scale of operations and diversity in financial intermediation are testimony to their adaptability and agility in transforming their business models, gauging needs of a growing economy and the evolving regulatory milieu. NBFCs complement banks in the credit intermediation process by offering diversified, tailor-made financial products through innovative service delivery mechanisms. Furthermore, they facilitate financial inclusion by providing credit to unbanked sections of the population. Over the years, NBFCs have assumed systemic importance due to their inter-linkages with the banking sector, capital market and other financial sector entities. They consolidated their positions in the lending space following asset quality concerns for banks. NBFCs’ credit to Gross Domestic Product (GDP) ratio increased from 8.6 per cent in 2012-13 to 12.2 per cent in 2018-19 before moderating slightly to 11.6 per cent in 2019-20 in the wake of the pandemic (Reserve Bank of India, 2019-20). The IL&FS default in September 2018 impacted market confidence and resulted in liquidity stress and higher borrowing costs for NBFCs. The Reserve Bank strengthened its regulatory oversight over the sector, and NBFCs also took proactive steps in correcting asset-liability mismatches. NBFC credit grew even after the IL&FS default, albeit at a slower pace, aided by bank borrowings and supportive policy measures. However, just as the NBFC sector was finding its bearings, the COVID-19 pandemic struck and exacerbated the challenges faced by the sector. This article looks at the performance of select NBFCs during the pandemic period, covering Q2 and Q3: 2020-21 using supervisory data filed by NBFCs1. As the impact of COVID-19 spilled over onto the real sector in 2020-21 due to the imposition of lockdowns, social distancing and a near standstill in economic activities, NBFCs have been hit hard. The impact of the pandemic can be seen on both asset quality and liquidity, although the latter was addressed to a considerable extent through timely policy measures. The article provides an overview of the sector during the pandemic period in Section II, covering various categories of NBFCs. Section III provides a balance sheet-based analysis of the sector and its sectoral disbursement of credit. Section IV discusses the financial performance and asset quality of NBFCs during the pandemic period. Section V concludes with key takeaways. II. A General Overview of the NBFC sector There were 9,5072 NBFCs registered with the Reserve Bank as on January 31, 2021. In terms of distribution of number of companies, non-systemically important non-deposit taking NBFCs (NBFCs-ND) with an asset size of less than ₹500 crore have a preponderant share (Chart 1a). When grouped in terms of their liability structure (public deposits being a source of funds), NBFCS are classified as deposit-taking NBFCs (NBFCs-D) or non-deposit taking NBFCs. The number of deposit-taking NBFCs (NBFCs-D) have gradually diminished and currently stands at 64, of which six have been prohibited from accepting further deposits under Section 45 MB of RBI Act, 1934. A non- deposit taking NBFC with asset size greater than ₹500 crore is considered systemically important (NBFCs-ND-SI). In terms of total assets, NBFCs-ND-SI constituted around 83 per cent of the total assets of the sector, while NBFCs-D accounted for 14.5 per cent and NBFCs-ND, 2.3 per cent at end-March 2020 (Chart 1b). As NBFCs specialise in offering loans to niche areas and cater to specific sectors, they are also categorised based on activities that they undertake. Till February 21, 2019, NBFCs were divided into 12 categories. Thereafter, these categories were harmonised in order to provide NBFCs with greater operational flexibility. As a result, asset finance companies (AFCs), loan companies (LCs) and investment companies (ICs) were merged into a new category called Investment and Credit Company (NBFC-ICC). At present, there are 12 categories of NBFCs in the activity-based classification (Table 1)3. For the sake of consistency in analysis, this article covers only those NBFCs which have regularly filed returns in all quarters from March 2019 to December 20204. Our sample NBFCs represent around 78 per cent of the assets of NBFC universe in December 2020.5 In this sample, NBFCs- ICC account for over half the asset size at end-December 2020. IFCs, comprising largely of government-owned NBFCs, have the next largest share in total asset size of sampled NBFCs. NBFCs-MFI, which play a key role in micro finance and financial inclusion, accounted for around two per cent in the asset size of sampled NBFCs (Table 2). 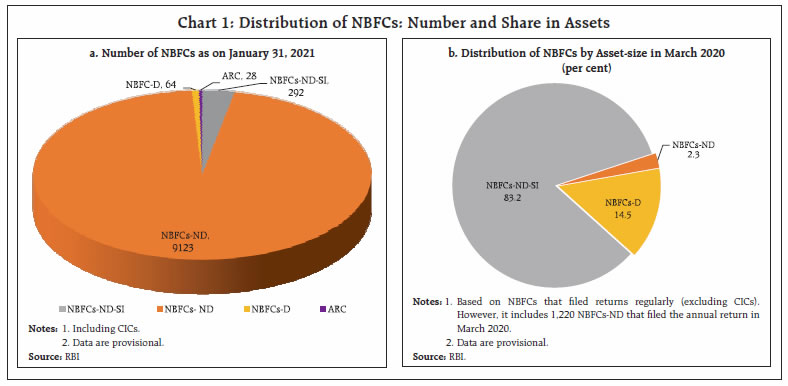
| Table 1: Classification of NBFC Sector by Activity | | Type of NBFC | Nature of Activity / Principal Business | | Investment and Credit Company (ICC) | Lending and investments | | Infrastructure Finance Company (IFC) | Providing loans for infrastructure development | | Infrastructure Debt Fund (IDF) | Facilitate flow of long-term debt to infrastructure projects | | Core Investment Company (CIC) | Acquisition of shares and securities | | NBFC- Micro Finance Institution (NBFC-MFI) | Collateral free loans and advances to small borrowers | | NBFC – Factor | Factoring business i.e. financing of receivables | | Non-Operative Financial Holding Company (NOHFC) | For setting up new banks in private sector through its promoter/promoter groups | | Mortgage Guarantee Company (MGC) | Providing mortgage guarantees for loans | | Asset Reconstruction Company (ARC) | Acquiring and dealing in financial assets sold by banks and financial institutions | | Peer-to-Peer Lending platform (P2P) | Providing an online platform to bring lenders and borrowers together to help mobilise funds | | Account Aggregator (AA) | Collecting and providing information about a customer’s financial assets in a consolidated, organised and retrievable manner to the customer or others as specified by the customer | | Housing Finance Company (HFC) | Financing for housing | | Source: RBI. |
| Table 2: Category of NBFCs: Share in Total Assets | | (Per cent) | | Category of NBFC | Mar-20 | Sep-20 | Dec-20 | | Investment and Credit | 51.7 | 50.7 | 50.3 | | Company (ICC) | (212) | (212) | (212) | | IFC | 44.7 | 45.5 | 45.8 | | | (4) | (4) | (4) | | NBFC-IDF | 1.3 | 1.4 | 1.4 | | | (4) | (4) | (4) | | NBFC - MFI | 2.1 | 2.1 | 2.2 | | | (17) | (17) | (17) | | NBFC -NOFHC | 0.1 | 0.2 | 0.2 | | | (1) | (1) | (1) | | NBFC -Factor | 0.1 | 0.1 | 0.1 | | | (2) | (2) | (2) | Note: Figures in parentheses denote number of companies in each category.
Source: Supervisory Returns, RBI. | III. A Balance Sheet-based Analysis of NBFCs The consolidated balance sheet of NBFCs registered a Y-o-Y growth of 13.0 per cent and 11.6 per cent in Q2 and Q3:2020-21, respectively (Table 3). This deceleration compared to corresponding quarters of 2019-20 could be attributed to the COVID-19 induced economic slowdown and weak demand. However, this double-digit growth in an adverse macroeconomic environment points to the resilience of NBFCs, which were able to cushion the impact of the pandemic on their balance sheets through quick adoption of technology, policy support and reasonably strong fundamentals. Both NBFCs- ND-SI and NBFCs-D experienced a slowdown in their balance sheets in Q2 and Q3: 2020-21 vis-à-vis previous periods, as loans and advances moderated sharply (Annex Tables 1, 2 and 3). | Table 3: Consolidated Balance Sheet of NBFCs | | (₹ crore) | | Items | Amount outstanding at the end of | Y-o-Y growth | | (Per cent) | | Mar-20 | Sep-20 | Dec-20 | Sep 20 over Sep 19 | Dec 20 over Dec 19 | | 1. Share Capital | 73,842 | 74,966 | 75,115 | 8.2 | 6.9 | | 2. Reserves & Surplus | 3,30,185 | 3,65,098 | 3,78,106 | 16.6 | 14.1 | | 3. Public Deposits | 30,560 | 34,956 | 38,271 | 15.4 | 33.2 | | 4. Total Borrowings | 17,01,232 | 17,43,952 | 17,63,138 | 11.7 | 11.0 | | 5. Current Liabilities | 39,589 | 49,208 | 54,602 | -12.6 | -25.2 | | 6. Provisions | 88,429 | 97,789 | 1,01,366 | 32.3 | 38.4 | | Total Liabilities/Assets | 22,93,761 | 23,97,732 | 24,37,131 | 13.0 | 11.6 | | 1. Loans & Advances | 16,47,904 | 17,11,491 | 17,31,859 | 4.8 | 2.5 | | 2. Investments | 1,88,784 | 2,03,077 | 2,03,094 | 9.7 | 8.7 | | 3. Cash & Bank Balances | 77,531 | 88,545 | 90,063 | 34.5 | 52.4 | | 4. Other Current Assets | 1,70,467 | 1,83,587 | 2,00,035 | 1,93.2 | 2,05.3 | Notes: 1. Data are provisional.
2. Numbers may not add up as all components are not reported here.
Source: Supervisory Returns, RBI. | III.1 Liabilities Structure of NBFCs NBFCs rely on both secured and unsecured sources of borrowings for their funding requirements. Bank borrowings, debentures, and commercial paper (CPs) are the major sources of their funding. While bank borrowings and debenture issuances may be secured or unsecured, commercial paper and inter-corporate borrowings are unsecured sources. Due to risk aversion and market pessimism post-IL&FS, the share of market borrowings (debentures and CPs) in the total borrowing had fallen and correspondingly, the share of bank borrowings had risen. NBFCs also moved towards longer term borrowings in tune with the tenure of their assets to manage their asset-liability mismatch. Q1:2020-21, the quarter following the nationwide lockdown, witnessed a reduction in the growth as well as share of market borrowings due to heightened risk aversion and spike in yields. However, various liquidity augmenting measures undertaken by the Reserve Bank and the Government to tackle the COVID-19 disruptions created favourable market conditions and the situation eased in Q2 and Q3:2020-21 as indicated by the pick-up in market borrowings, particularly in debenture issuances. In the same period, bank borrowings grew at a robust pace, although slight deceleration was exhibited in Q3:2020-21 (Chart 2). An unfavourable mix of COVID-19, sell-offs in financial markets and the abrupt winding-up of specific schemes by a mutual fund contributed to NBFCs facing record spike in yields on their debt in Q1: 2020-21. The extent of risk aversion was starkly visible from the spread of debt market instruments of NBFCs. The spread of three-year AAA NBFC bonds’ yields over government securities’ yields peaked to 230 basis points in May 2020, while the spread of CPs over treasury bills yields peaked to 236 basis points in April 2020.
As already noted, the policy interventions helped in alleviating the constraints in the sector and paved way for the return of market confidence as spreads in Q2 and Q3: 2020-21 narrowed to levels lower than the pre-COVID period (Chart 3). Nevertheless, the market differentiation continued between the highly rated and other NBFCs, notwithstanding the surplus liquidity and aggressive policy rate cuts. NBFC papers, particularly debentures, are subscribed to by a host of market participants. Banks, mutual funds, insurance companies and pension funds together accounted for half the NBFC debenture market in December 2020. Retail participation in the NBFC debenture issuances, notwithstanding their small share in overall subscription, witnessed an upswing since June 2020 (Chart 4a). On the other hand, the CP market is dominated by mutual funds and banks, which together accounted for 93 per cent of the NBFC CP issuances in Q3:2020-21. Mutual funds reduced their exposure to NBFC CPs between March and September 2020 on account of redemption pressures, as noted earlier. However, Q3:2020-21 witnessed a renewed interest of mutual funds in NBFC CPs. Banks’ subscription of CPs increased at a steady pace after Q1:2020-21 (Chart 4b). Term loans constituted over four-fifth of NBFC bank borrowings at end-December 2020, followed by working capital loans and cash credit. While term loans continued to grow at a robust pace, they exhibited a deceleration in Q2 and Q3:2020-21, compared to Q2 and Q3: 2019-20 reflecting tepid demand for on-lending of funds. An uptick in working capital loans was witnessed in Q3: 2020-21 as NBFCs tried to find their footing and economic activity started gaining traction (Chart 5). III.1.1 Trends in Short and Long-term Borrowings In the aftermath of the IL&FS event, the NBFC sector attempted to realign its asset-liability mismatches by moving away from short-term borrowings to long-term borrowings. Accordingly, term loans growth remained high at 22.6 per cent and 18.3 per cent in Q2 and Q3:2020-21 (Y-o-Y), respectively, albeit showing a gradual deceleration from March 2020. On the other hand, absolute issuance of CPs by NBFCs continued to decline in Q2 and Q3: 2020-21 (Chart 6). Over 70 per cent of the NBFC borrowings are payable after 12 months and their share has remained stable, indicative of the growing market discipline among NBFCs (Chart 7).
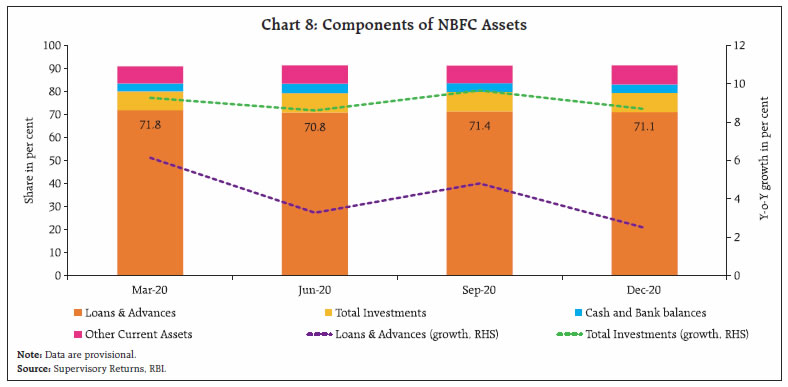
III.2 Assets Structure of NBFCs Loans and advances constituted around 71 per cent of the total assets in Q3:2020-21 and continued to be the largest component on the asset side of NBFCs’ balance sheet. NBFCs posted 4.8 per cent and 2.5 per cent credit growth in Q2 and Q3:2020-21 (Y-o-Y), respectively. Loss of income and livelihoods and subsequent fall in consumption demand as well as discretionary spending resulted in NBFCs’ credit growth remaining in modest zone in contrast to their usual robust trend. Even investments grew slowly at 8.7 per cent in Q3:2020-21, compared to 24.4 per cent in Q3:2019-20, reflecting lack of profitable investment opportunities in a low interest rate regime. However, NBFCs continued to preserve cash to ensure adequate liquidity in view of the prevailing uncertainty due to the pandemic (Chart 8). 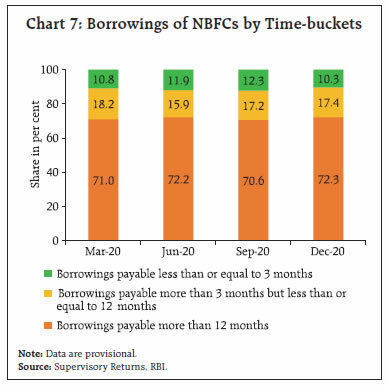
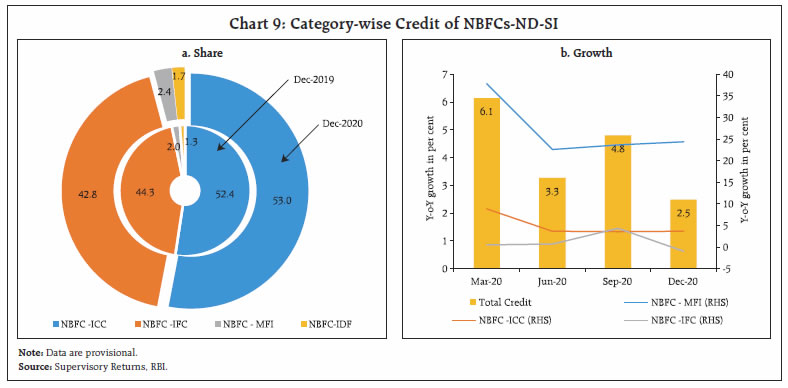 ICCs and IFCs together constitute about 96 per cent of the total credit extended by NBFCs (Chart 9a). The overall deceleration in credit growth was mirrored in all categories, notably in ICCs and IFCs, the latter witnessing a decline in credit growth in Q3:2020-21. Credit disbursal by NBFCs-MFI decelerated in Q2 and Q3:2020-21 but grew at a faster pace compared to other categories (Chart 9b). An analysis of NBFC loan portfolio also reveals that over 70 per cent of NBFC advances are long-term (that is, receivable after more than one year). An increase in the share of NBFCs’ loans in the less than 3- month bucket after the outbreak of pandemic indicates NBFCs’ role in facilitating short-term credit needs of the economy (Chart 10a). Long-term loans and advances are largely disbursed by ICCs, IFCs and IDFs, whereas ICCs and MFIs are the major players in the short-term lending. MFIs are particularly instrumental in providing small-ticket loans to further financial inclusion. An increase in the share of MFI loans in the less than 3- month bucket and 3-12 months bucket, particularly in Q1: 2020-21 (and continuing, in the case of less than 3-months loans), points to the crucial role they are undertaking in providing unsecured, short-term loans to small borrowers in the immediate aftermath of outbreak of COVID-19 to tide over short-term needs (Chart 10b). 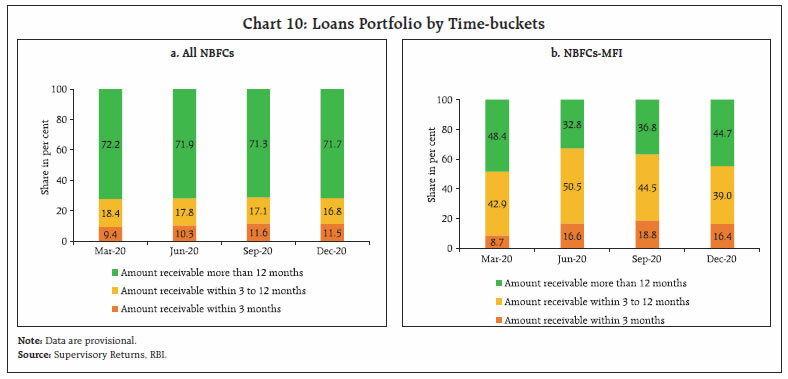 Investments are the second largest component on the assets side of NBFC balance sheets after loans and advances. Around 60 per cent of NBFCs investments are long- term in nature. Amongst a variety of instruments at the disposal of NBFCs, equity shares and units of mutual funds seems to be the most popular, where NBFCs invest around 67 per cent of total investments, followed by government securities and government guaranteed bonds. Investment in mutual funds saw a jump in Q1 and Q2:2020-21 before moderation in Q3:2020-21 (Chart 11). III.3 Sectoral Deployment of Credit6 The industrial sector remained the largest recipient of credit from NBFCs-ND-SI even as its share moderated between Q3:2019-20 and Q3:2020-21. Retail sector, followed by services, are the other major beneficiaries and their share grew during the period under consideration (Chart 12a). Industrial sector, particularly micro and small and large industries, seemed the worst hit by the pandemic as they posted decline in credit growth. Imposition of lockdown, abrupt stoppage of economic activities and disruption in supply chains to contain the spread of the virus could have affected these sectors the most. Agriculture was the bright spot with the highest growth in disbursements in Q3:2020-21, however, it could be partly attributable to a favourable base effect. Services and retail loans segments bucked the overall trend and exhibited an improvement in growth vis à vis last year in December 2020, though in case of the former, it could be attributed to base effect (Chart 12b). Incremental credit flows (on year-on-year basis) to the retail sector continued to increase in Q2 and Q3: 2020-21, but at a slower pace, while services sector saw marginal increase in Q3: 2020-21, wherein vehicle loans, gold loans, transport and tourism were the beneficial segments. Players in the retail segment stayed above the curve by gauging the public sentiments and playing to their strengths.
With the persistence of the pandemic and the need for observing social distancing norms, passenger vehicles sales increased by 13.6 per cent in December 20207. It is mirrored in the disbursal of vehicle loans by NBFCs, as these loans grew by 10.7 per cent in Q3:2020-21. Loans against gold also grew robustly as it filled in the cash requirements and possible working capital requirements of small firms. However, incremental credit to industries declined in the same period as the sector is yet to shake off the impact of the pandemic (Chart 13). IV. Financial Performance and Asset Quality of NBFCs The profitability of NBFCs dipped in the immediate aftermath of the COVID-19 in Q1:2020-21, as businesses suffered economic losses due to nation-wide lockdowns. Both return on assets (RoA) and return on equity (RoE) deteriorated in Q1:2020-21 compared to the corresponding period in 2019-20. However, the situation improved marginally in Q2: 2020-21 as NBFCs’ expenditures registered a steeper fall than income. RoA and RoE improved from 1.8 and 10.3 per cent, respectively in Q2:2019-20 to 2.3 and 12.7 per cent, respectively in Q2:020-21. Profitability of the sector remained stable in Q3:2020-21. 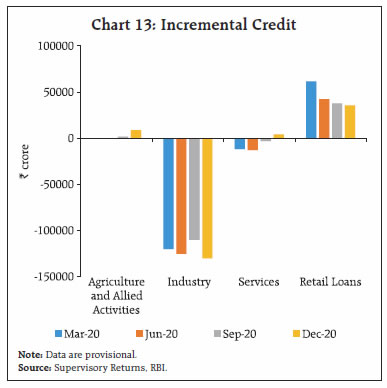
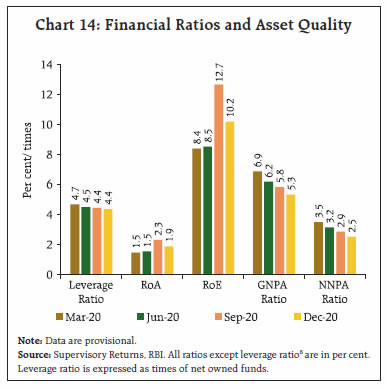 Asset quality of NBFCs witnessed improvement in 2020-21 so far, compared to Q4:2019-20 on account of regulatory forbearance. However, GNPA ratio of NBFCs was elevated in Q1 and Q2:2020-21 compared to the corresponding period in 2019-20. In Q3:2020- 21, both GNPA and NNPA ratios fell compared to Q3:2019-20. Nevertheless, the true extent of NPAs in the sector may be gauged in the upcoming quarters as the interim order by the Supreme Court on asset classification standstill was lifted in March 2021 (Chart 14). Among sectors, industry witnessed sequential reduction in their GNPA ratio while GNPA ratio of retail loans remained low compared to other sectors. Improvement in asset quality of NBFCs during 2020- 21, so far, can be partially attributable to the reduction in impaired assets in the industrial sector (Chart 15). V. Conclusion The consolidated balance sheet of NBFCs grew at a slower pace in Q2 and Q3:2020-21 as the economy continued to weather the headwinds of COVID-19 pandemic and muted credit demand. However, NBFCs continued to disburse credit despite disruptions caused by the pandemic, albeit at a slower pace. Sequential easing of spread of NBFCs debentures over the corresponding G-sec yield along with increased retail participation in the NBFC debenture market augured well for the market and public perception regarding the sector. The retail sector benefitted from incremental credit disbursed by the sector, aided by their low GNPA ratios and by staying tuned to customer preferences. The profitability of the NBFCs improved in Q2:2020-21 compared to the corresponding quarter of the previous year on account of steeper fall in expenditure than in income. Given the persistence of infections, the full effects of the lockdown and suspension of business on the asset quality of NBFCs will be evident gradually. Reference Reserve Bank of India. (2019-20). Report on Trend and Progress of Banking in India.
| Annex Table 1: Consolidated Balance Sheet of NBFCs | | Items | Amount outstanding at the end of | Y-o-Y Growth | | (₹ crore) | (Per cent) | | Mar-20 | Sep-20 | Dec-20 | Sep 20 over Sep 19 | Dec 20 over Dec 19 | | Share Capital | 73,842 | 74,966 | 75,115 | 8.2 | 6.9 | | Reserves & Surplus | 3,30,185 | 3,65,098 | 3,78,106 | 16.6 | 14.1 | | Public Deposits | 30,560 | 34,956 | 38,271 | 15.4 | 33.2 | | Total Borrowings | 17,01,232 | 17,43,952 | 17,63,138 | 11.7 | 11.0 | | Debentures | 7,42,284 | 7,77,540 | 7,74,549 | 8.6 | 11.4 | | Subscribed by Mutual Funds | 1,32,404 | 1,28,016 | 1,34,649 | 9.8 | 5.2 | | Subscribed by Banks | 67,358 | 84,055 | 84,045 | 25.6 | 30.1 | | Subscribed by NBFCs | 2,213 | 2,977 | 2,189 | 19.7 | -22.7 | | Subscribed by Others | 4,05,957 | 3,38,798 | 3,24,847 | -22.6 | -13.9 | | Bank Borrowings | 4,99,651 | 5,23,504 | 5,33,902 | 18.7 | 17.7 | | Term Loans | 4,31,414 | 4,57,346 | 4,63,843 | 22.6 | 18.3 | | Working Capital Loans | 55,629 | 51,315 | 55,927 | -0.5 | 16.7 | | Cash Credit | 10,659 | 13,129 | 11,553 | -6.4 | 1.6 | | Over Draft | 1,949 | 1,715 | 2,578 | -24.5 | 8.5 | | Borrowings from FIs | 54,246 | 38,778 | 40,526 | 107.7 | 44.9 | | Borrowings from Government | 17,967 | 24,722 | 18,236 | 87.0 | -1.4 | | Inter corporate borrowings | 60,340 | 60,844 | 62,036 | 1.4 | -29.1 | | Commercial Paper | 40,479 | 42,175 | 44,183 | -41.7 | -26.4 | | Subordinated Debts | 45,407 | 45,847 | 46,522 | 5.3 | 4.1 | | Current Liabilities | 39,589 | 49,208 | 54,602 | -12.6 | -25.2 | | Provisions | 88,429 | 97,789 | 1,01,366 | 32.3 | 38.4 | | Other Liabilities | 29,924 | 31,762 | 26,532 | 67.4 | 39.0 | | Total Liabilities/Assets | 22,93,761 | 23,97,732 | 24,37,131 | 13.0 | 11.6 | | Loans & Advances | 16,47,904 | 17,11,491 | 17,31,859 | 4.8 | 2.5 | | HP & Lease Assets | 1,47,651 | 1,53,847 | 1,60,331 | 13.4 | 12.4 | | Investments | 1,88,784 | 2,03,077 | 2,03,094 | 9.7 | 8.7 | | Govt. Securities | 24,562 | 20,771 | 31,282 | 2.9 | 43.6 | | Equity Shares | 73,768 | 79,055 | 83,266 | 3.8 | 13.9 | | Preference Shares | 3,001 | 2,636 | 2,815 | 0.1 | -1.7 | | Debentures & Bonds | 18,159 | 26,995 | 16,588 | 16.0 | -23.6 | | Units of Mutual Funds | 51,046 | 57,698 | 52,492 | 23.6 | 0.6 | | Commercial Paper | 852 | 444 | 726 | - | - | | Other Investments | 17,396 | 15,478 | 15,926 | -4.8 | 4.6 | | Cash & Bank Balances | 77,531 | 88,545 | 90,063 | 34.5 | 52.4 | | Cash in Hand | 3,983 | 1,500 | 1,759 | -50.7 | -58.3 | | Deposits with Banks | 73,085 | 84,819 | 81,822 | 36.9 | 49.3 | | Other Current Assets | 1,70,467 | 1,83,587 | 2,00,035 | 193.2 | 205.3 | | Other Assets | 61,423 | 57,184 | 51,748 | 42.9 | 30.2 | | Contingent Liabilities | 22,190 | 24,266 | 23,187 | 7.0 | -4.9 | Note: The data are provisional and provide indication of the direction and pattern of financial operations of NBFCs. For this table data of a common set of companies have been taken, which filed regular returns in all quarters from March 2019 to December 2020.
Source: Supervisory Returns, RBI. |
| Annex Table 2: Consolidated Balance Sheet of NBFCs-ND-SI | | Items | Amount outstanding at the end of | Y-o-Y Growth | | (₹ crore) | (Per cent) | | Mar-20 | Sep-20 | Dec-20 | Sep 20 over Sep 19 | Dec 20 over Dec 19 | | Share Capital | 70,171 | 70,964 | 71,113 | 7.7 | 6.3 | | Reserves & Surplus | 2,69,972 | 2,99,585 | 3,10,881 | 13.8 | 15.0 | | Total Borrowings | 14,80,578 | 15,33,268 | 15,56,997 | 13.5 | 12.9 | | Debentures | 6,69,917 | 7,12,246 | 7,11,178 | 9.4 | 12.8 | | Subscribed by Mutual Funds | 1,14,726 | 1,16,019 | 1,23,038 | 13.4 | 9.3 | | Subscribed by Banks | 53,942 | 69,511 | 71,109 | 21.4 | 27.9 | | Subscribed by NBFCs | 1,986 | 2,747 | 1,810 | 23.0 | -32.5 | | Subscribed by Others | 3,95,748 | 3,29,046 | 3,16,943 | -19.9 | -12.9 | | Bank Borrowings | 4,03,082 | 4,26,100 | 4,40,584 | 22.2 | 22.7 | | Term Loans | 3,44,041 | 3,70,395 | 3,81,151 | 27.7 | 24.9 | | Working Capital Loans | 50,457 | 45,900 | 49,474 | -4.2 | 11.6 | | Cash Credit | 7,159 | 8,432 | 7,765 | -9.7 | 0.0 | | Over Draft | 1,426 | 1,373 | 2,194 | -8.1 | 12.5 | | Borrowings from FIs | 46,602 | 31,707 | 31,487 | 114.6 | 34.8 | | Borrowings from Government | 17,967 | 24,722 | 18,236 | 87.0 | 0.2 | | Inter corporate borrowings | 52,072 | 54,901 | 55,540 | 4.9 | -30.0 | | Commercial Paper | 36,629 | 38,317 | 40,966 | -36.5 | -25.4 | | Subordinated Debts | 34,427 | 36,283 | 36,996 | 14.1 | 11.3 | | Current Liabilities | 29,231 | 39,000 | 43,991 | -19.3 | -29.9 | | Provisions | 74,993 | 78,722 | 83,445 | 25.3 | 34.4 | | Other Liabilities | 29,657 | 31,718 | 26,363 | 72.1 | 43.1 | | Total Liabilities/Assets | 19,54,601 | 20,53,258 | 20,92,790 | 13.5 | 12.5 | | Loans & Advances | 13,57,207 | 14,27,478 | 14,40,760 | 5.7 | 2.9 | | HP & Lease Assets | 1,47,651 | 1,53,847 | 1,59,178 | 13.4 | 11.6 | | Investments | 1,61,375 | 1,68,235 | 1,76,591 | -0.8 | 4.8 | | Govt. Securities | 18,078 | 12,053 | 22,470 | -25.8 | 30.9 | | Equity Shares | 67,432 | 72,681 | 76,858 | 1.8 | 12.7 | | Preference Shares | 2,739 | 2,363 | 2,534 | -1.3 | -2.6 | | Debentures & Bonds | 17,989 | 26,868 | 16,588 | 16.0 | -23.3 | | Units of Mutual Funds | 40,222 | 41,027 | 44,312 | -1.9 | -1.6 | | Commercial Paper | - | 96 | 244 | - | - | | Other Investments | 14,916 | 13,147 | 13,585 | -9.4 | -2.0 | | Cash & Bank Balances | 63,570 | 70,387 | 71,690 | 24.2 | 47.6 | | Cash in Hand | 3,890 | 1,350 | 1,587 | -52.5 | -60.3 | | Deposits with Banks | 59,305 | 67,353 | 67,318 | 27.0 | 51.2 | | Other Current Assets | 1,65,603 | 1,78,258 | 1,94,935 | 201.2 | 210.8 | | Other Assets | 59,194 | 55,053 | 49,636 | 43.6 | 30.7 | | Contingent Liabilities | 18,459 | 18,931 | 17,916 | 2.7 | -10.9 | Note: The data are provisional and provide indication of the direction and pattern of financial operations of NBFCs. For this table data of a common set of companies have been taken, which filed regular returns in all quarters from March 2019 to December 2020.
Source: Supervisory Returns, RBI. |
| Annex Table 3: Consolidated Balance Sheet of NBFCs-D | | Items | Amount outstanding at the end of | Y-o-Y Growth | | (₹ crore) | (Per cent) | | Mar-20 | Sep-20 | Dec-20 | Sep 20 over Sep 19 | Dec 20 over Dec 19 | | Share Capital | 3,671 | 4,002 | 4,002 | 17.3 | 18.8 | | Reserves & Surplus | 60,213 | 65,513 | 67,224 | 31.9 | 10.1 | | Public Deposits | 30,560 | 34,956 | 38,271 | 15.4 | 33.2 | | Total Borrowings | 2,20,654 | 2,10,684 | 2,06,141 | 0.5 | -1.0 | | Debentures | 72,367 | 65,294 | 63,371 | 1.5 | -2.0 | | Subscribed by Mutual Funds | 17,678 | 11,997 | 11,611 | -15.9 | -24.8 | | Subscribed by Banks | 13,415 | 14,544 | 12,936 | 50.6 | 43.9 | | Subscribed by NBFCs | 227 | 230 | 379 | -9.2 | 149.1 | | Subscribed by Others | 10,209 | 9,752 | 7,904 | -64.0 | -42.1 | | Bank Borrowings | 96,570 | 97,405 | 93,318 | 5.6 | -1.3 | | Term Loans | 87,374 | 86,951 | 82,692 | 4.6 | -4.9 | | Working Capital Loans | 5,173 | 5,415 | 6,453 | 47.0 | 79.1 | | Cash Credit | 3,500 | 4,697 | 3,789 | 0.1 | 5.1 | | Over Draft | 523 | 342 | 384 | -56.0 | -9.8 | | Borrowings from FIs | 7,644 | 7,071 | 9,038 | 81.7 | 96.4 | | Borrowings from Government | - | - | - | - | - | | Inter corporate borrowings | 8,268 | 5,943 | 6,496 | -22.5 | -20.9 | | Commercial Paper | 3,850 | 3,859 | 3,218 | -68.0 | -37.8 | | Subordinated Debts | 10,980 | 9,564 | 9,526 | -18.4 | -16.8 | | Current Liabilities | 10,359 | 10,208 | 10,610 | 28.0 | 2.8 | | Provisions | 13,436 | 19,067 | 17,922 | 71.9 | 60.3 | | Other Liabilities | 267 | 44 | 170 | -91.9 | -74.1 | | Total Liabilities/Assets | 3,39,159 | 3,44,474 | 3,44,340 | 10.2 | 6.5 | | Loans & Advances | 2,90,697 | 2,84,014 | 2,91,099 | 0.5 | 0.4 | | HP & Lease Assets | - | - | 1,153 | - | - | | Investments | 27,408 | 34,842 | 26,503 | 122.2 | 43.9 | | Govt. Securities | 6,484 | 8,718 | 8,812 | 120.9 | 90.5 | | Equity Shares | 6,336 | 6,374 | 6,408 | 33.6 | 30.1 | | Preference Shares | 262 | 273 | 281 | 13.7 | 7.2 | | Debentures & Bonds | 170 | 126 | - | 14.4 | -100.0 | | Units of Mutual Funds | 10,824 | 16,672 | 8,180 | 242.9 | 14.4 | | Commercial Paper | 852 | 348 | 483 | - | - | | Other Investments | 2,480 | 2,331 | 2,341 | 32.9 | 72.8 | | Cash & Bank Balances | 13,961 | 18,158 | 18,373 | 98.7 | 74.5 | | Cash in Hand | 93 | 149 | 172 | -24.0 | -21.0 | | Deposits with Banks | 13,780 | 17,466 | 14,504 | 95.4 | 40.7 | | Other Current Assets | 4,864 | 5,329 | 5,100 | 55.3 | 81.6 | | Other Assets | 2,229 | 2,132 | 2,111 | 26.2 | 18.2 | | Contingent Liabilities | 3,732 | 5,335 | 5,271 | 25.2 | 23.4 | Note: The data are provisional and provide indication of the direction and pattern of financial operations of NBFCs. For this table data of a common set of companies have been taken, which filed regular returns in all quarters from March 2019 to December 2020.
Source: Supervisory Returns, RBI. |
|