Small Finance Banks are a new entrant into the Indian banking system with a differentiated focus on financial inclusion. They have witnessed a rapid growth in their branch network and asset base while maintaining a healthy asset quality and generating high return on assets. These banks have been reasonably successful in reaching out to under-served sectors, such as the Micro, Small and Medium Enterprises (MSMEs), and have an impressive coverage of borrowers with small credit needs. Introduction Since 2005, India has actively pursued the policy of financial inclusion. As part of this policy, the Reserve Bank has undertaken a number of measures, which among others, include opening bank branches in unbanked areas, roping in business correspondents and facilitators for ensuring last-mile connectivity of banking, and opening small business accounts linked to debit cards to promote financial inclusion along with financial literacy. The introduction of Board-approved financial inclusion plans in 2010 has given a definite direction and structure to the efforts for financial inclusion. The alignment of the financial inclusion plan objectives with those laid out as part of the Pradhan Mantri Jan-Dhan Yojana in 2014 has imparted a mission mode to these efforts. Alongside the efforts to introduce new products and platforms, the Reserve Bank has introduced newer institutional variants for promoting financial inclusion. One such institution has been the Small Finance Banks (SFBs). The specific mandate assigned to SFBs is to further the cause of financial inclusion by (i) providing savings vehicles, and (ii) supplying credit to small business units, including small and marginal farmers, micro and small industries; and other unorganised sector entities, and various low income groups and the migrant work force through high technology-low cost operations.1 These can be defined as differentiated financial institutions, considering their focus on serving the population with small finance needs. They have been set up in the private sector, and thus, differ from Regional Rural Banks (RRBs) - banking institutions created with the objective of including the under-served sections with predominant government shareholding.2 Following the issuance of the licensing guidelines in 2014, 10 SFBs have commenced operations so far. The first two, Capital Small Finance Bank and Equitas Small Finance Bank, started operations in 2016 followed by seven more in 2017, and one more in 2018. Most of the SFBs were previously microfinance institutions (MFIs) with a few notable exceptions, such as the Capital Small Finance Bank which was a local area bank. As MFIs, most of these institutions already had a well-developed network of customers, belonging mostly to the middle and low-income groups. These MFIs chose to convert into SFBs, in a bid, among others, to expand their reach further, while benefitting from lower cost of funds following the access to deposits that they could enjoy as SFBs. This article analyses the performance of SFBs with specific reference to their objective of financial inclusion and viability of their business models. In addition, their compliance to various regulatory guidelines, wherever directly measurable, is also examined. Although constrained by a relatively short time span since their inception, the analysis can throw light on the way the operations of these institutions are shaping up. The data used for this article are taken from various supervisory returns, Basic Statistical Return of credit and deposits of Scheduled Commercial Banks (SCBs) (BSR-1 and BSR-2) as well as Branch Banking Statistics. The study period starts from June 2016, when the first SFB began its operations. Although the sample size of SFBs has varied over the study period, the period from 2018 can be taken as comparable considering that most SFBs had started their operations during 2017-18. The rest of the article is divided into five sections. Section II provides an overview of the regulatory guidelines governing SFBs, as differentiated banking institutions. Section III provides a few indicators about the size and scale of operations of SFBs in a comparative perspective with their bank and non-bank counterparts. Section IV presents the key findings from the analysis of supervisory and banking data on SFBs and Section V concludes. II. A Brief Overview of the Regulatory Guidelines for SFBs SFBs, which operate as SCBs, are subject to the prudential regulatory norms similar to other SCBs. However, being differentiated in their nature of business, there are certain differences. Some of these differentiated guidelines for SFBs are as follows: (i) Being a differentiated or niche bank, the minimum net worth for an SFB has been fixed at a lower level than other SCBs. SFBs need to have a minimum net worth of ₹2 billion (increased from ₹1 billion following the issuance of the guidelines for on-tap licensing for these banks), as compared to ₹5 billion for other SCBs;3 (ii) Considering their focus on financial inclusion, SFBs have to provide at least 75 per cent of their Adjusted Net Bank Credit (ANBC) to priority sectors as compared to 40 per cent in the case of other SCBs (excluding RRBs); (iii) Considering their focus on small-sized credit, at least 50 per cent of their loan portfolio should comprise loans of upto ₹25 lakh; (iv) In view of the inherent business risks, the minimum Capital to Risk-weighted Assets Ratio (CRAR) for SFBs has been fixed at 15 per cent. III. SFBs in Comparison with the Banking and Non-Banking Segments At present, SFBs constitute a minuscule portion of the financial sector (comprising the SCB (including RRBs and UCBs) and NBFC segments) (Chart 1). The share of SFBs in total assets of the financial sector was 0.4 per cent in March 2019. In 2018-19, the banking business of SFBs had a ratio of 15 per cent to that of RRBs, another banking institution with a differentiated focus. Starting from a low base, SFBs have expanded their branch presence rapidly, rising to 4,307 branches by March 2020. The ratio of SFB branches to SCB branches (excluding RRBs) was 3.5 per cent in March 2020 as compared to 1 per cent in March 2018 (Chart 2). The ratio of SFB branches to RRB branches was about 20 per cent in March 2020.
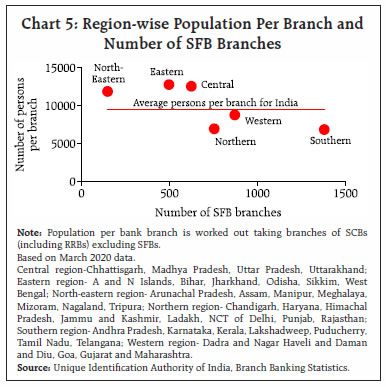
IV. Major Features of the Operations of SFBs Structural Features High degree of concentration within SFBs SFBs have shown high asset growth since their inception. Between 2017 and 2020, the average growth of assets of SFBs was about 150 per cent per annum owing to a low base, as most SFBs began their operations in 2017-18. The average growth moderated between 2018 and 2020 to about 61 per cent. At present, there is considerable concentration of assets within the SFB group. Top-two SFBs accounted for 46 per cent of total assets of all SFBs in March 2020 with top-three SFBs accounting for 60 per cent share (Chart 3). However, the relatively big-sized SFBs have displayed lower growth of assets in more recent years (Chart 4). Hence, the concentration of assets within the SFB group may come down over time. Regional and Sectoral Features Greater concentration of branch network in relatively well-banked states While there has been a rapid growth in the branch network of SFBs since their inception, this growth has been markedly concentrated in the southern, western and northern regions, which are known as the relatively well-banked regions in the country (Chart 5). Their penetration in the north-eastern region, which is known to be the least banked region, remains low. 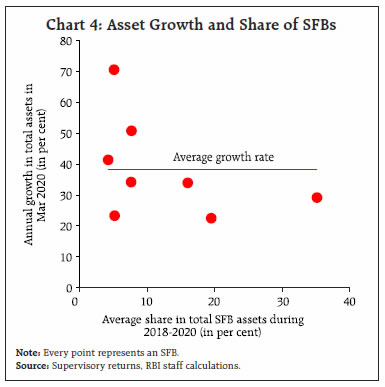
 At the state level, while SFBs are making their presence felt in some of the under-served states of Madhya Pradesh and Rajasthan, they continue to be concentrated in Tamil Nadu, Maharashtra, Karnataka, Kerala and Punjab - states with some of the lowest population per bank branch in the country (Chart 6). Among these, the states from the southern region have had a high concentration of MFIs since the time micro finance originated in India in the early-1990s (Golait and Kumar, 2009). SFBs too, many of which are MFIs turned into banks, have largely followed this pattern of branch expansion. Furthermore, there appears to be some similarity in the branch spread of private sector banks and SFBs, with both showing a greater concentration in the relatively well-banked regions/states (Appendix Table 1). Greater focus on semi-urban centres The rapid increase of SFB branches has been in semi-urban and urban centres; in March 2020, about 39 per cent of the total SFB branches were semi-urban in nature followed by 26 per cent in urban centres (Chart 7). 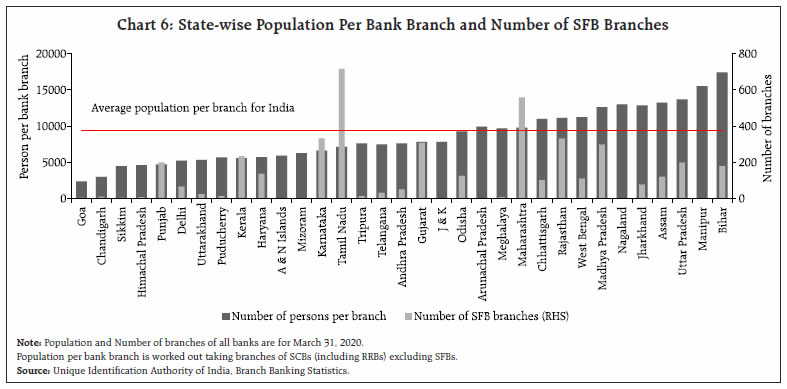 As the semi-urban category covers centres with a population of 10,000 to 1 lakh, covering a fairly broad spectrum of centres, a tier-wise distribution of branches for SFBs has been attempted. It suggests that about 31 per cent of the branches of SFBs are located in Tier 2 and 3 centres (with population ranging between 20,000 and 1 lakh), and about 8 per cent of the branches are located at Tier 4 centres (population ranging between 10,000 and 19,999), with Tier 5 and 6 centres (rural) (population less than 10,000) accounting for only 18 per cent of the SFB branches (Chart 8). In the case of only three SFBs, the share of rural branches to total was more than 25 per cent as on March 2020, while for others, the share ranged between 10 per cent and 22 per cent. Considering their small finance focus, the limited spread of SFBs at rural centres and even at smaller semi-urban centres leaves much to be desired. 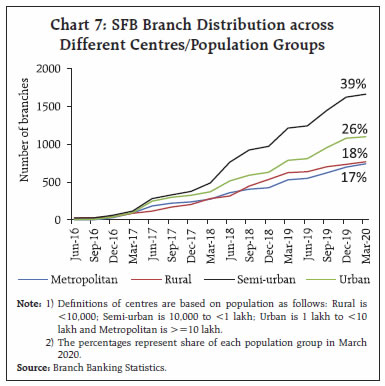
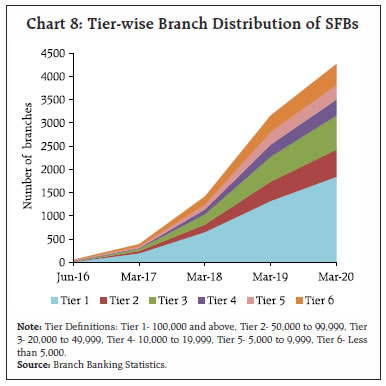 Interestingly again, SFBs show a branch distribution pattern similar to Private Sector Banks (PVBs); semi-urban centres had the highest share of about 32 per cent in total branches of PVBs with rural centres having a share of 21 per cent in March 2020. Dominant presence of priority sectors in the lending portfolio Given their differentiated priority sector lending (PSL) targets and also the fact that most of them, as MFIs, were serving the under-served economic sectors/sections of the population, SFBs have seen a dominant presence of priority sectors in their lending portfolio (Chart 9). At the systemic level, priority sectors accounted for about 75 per cent of the total credit of SFBs. At the bank level too, there was little variation with most SFBs reporting a share of over 75 per cent of priority sectors (Table 1).
| Table 1: Distribution of SFBs by Share of PSL | | Share of PSL in total advances* | Percentage of SFBs | | > =75% | 60 | | 50% =< & <75% | 40 | * The size categories and reported shares are based on data for March 2020. Most of the SFBs are either above or very close to the target of 75 per cent.
Source: Supervisory returns. | SFBs targeting the sectors relatively under-served by commercial banks SFBs reported a greater concentration of loans to agriculture, trade and professional services. These three sectors accounted for about 65 per cent of the total credit of SFBs in March 2020 as compared to SCBs which lent about 66 per cent of their credit to industry, personal loans and finance (Chart 10). Considering that SFBs, by design, were expected to extend small-sized loans, it may not be wrong to assume that they financed small agriculturists, small traders and small businesses. In fact, Micro, Small and Medium Enterprises (MSMEs) had a prominent presence in their overall loan portfolio as well as their portfolio of industrial and services sector credit (Table 2).
| Table 2: MSME Share in Total Credit | | Year | SFBs (%) | SCBs (%) | | Mar 2018 | 42 (81) | 17 | | Mar 2019 | 40 (83) | 18 | | Mar 2020 | 41 (82) | 17 | Note: MSME shares in industry plus services sector credit are shown in brackets.
SCBs includes PSBs, PVBs and FBs only.
Based on March 2020 data.
Source: Supervisory returns. | Credit portfolio featuring a large share of small-sized loans SFBs have been meeting the regulatory requirement relating to the size-wise distribution of their loan portfolio. In March 2020, 99.9 per cent and 83 per cent of their total loan accounts and total loan amount, respectively, had a credit limit of up to ₹25 lakh. Even within these, an impressive focus on very small-sized loans by these banks was evident; about 96 per cent and 48 per cent of their total loan accounts and total loan amount, respectively, had a credit limit of ₹2 lakh, or what are called as small borrowal accounts (Chart 11). Balance Sheet-related Features Rapid increase in deposit base As already noted, most SFBs were originally MFIs and one of the factors that was instrumental in their conversion to SFBs was the access to deposits. Expectedly, their deposits-to-assets ratio has been rising rapidly since inception. Moreover, there is little differential across SFBs in the growth of deposits (Chart 12). While the deposit base of SFBs has been expanding, they still have a long distance to cover as compared to other SCBs in mobilisation of current and savings accounts or CASA. While there has been a pick-up in the share of CASA in total deposits for SFBs, it stood at 15 per cent in March 2020 as compared to 41 per cent for other SCBs.
A high credit-to-deposits (CD) ratio SFBs started with a high CD ratio, which was more than 2.5 times that of other SCBs in the initial years (Chart 13). It fell over time with the growth in deposits but was still high at 111 per cent in March 2020. CD ratio varied widely across SFBs in 2017, after which the dispersion has come down. Financial Operations-related Features Higher cost of funds Despite an increasing access to deposits as discussed earlier, the cost of funds for SFBs has remained high (Chart 14). The high cost of funds needs to be seen in light of their lower percentage of CASA as compared to other SCBs. Higher return on funds The return on funds has been higher due to higher spreads maintained by the SFBs (Charts 15 and 16). Interestingly, there was not much differential across SFBs with regard to the cost of and return on funds (Table 3). Higher return on assets SFBs, on an average, reported a higher return on assets (RoA) (net profits/average total assets) as compared to other SCBs, following the higher return on funds as discussed earlier. However, such a comparison may be misleading considering that (a) the asset size of SFBs is much smaller than the other SCBs; (b) the other SCBs, particularly PSBs, have a legacy of NPAs, which has adversely affected their profitability over time. Hence, a better point of comparison of RoA for SFBs could be NBFC-MFIs. During the period under study, NBFC-MFIs have reported a higher RoA than SFBs but the gap between the two entities has been narrowing over time (Chart 17).
| Table 3: Distribution of SFBs, by Return on Funds, Cost of Funds and Spread | | Range of RoF/ CoF/Spread | Percentage of SFBs | | Return on funds (RoF) | Cost of funds (CoF) | Spread | | 3%-5% | - | - | 20 | | 5%-8% | - | 20 | 10 | | 8%-10% | - | 80 | 50 | | 10%-11% | 10 | - | 20 | | 11%-15% | 10 | - | - | | 15%-20% | 70 | - | - | | >20% | 10 | - | - | Note: Data relate to March 2020.
Source: Supervisory returns. |
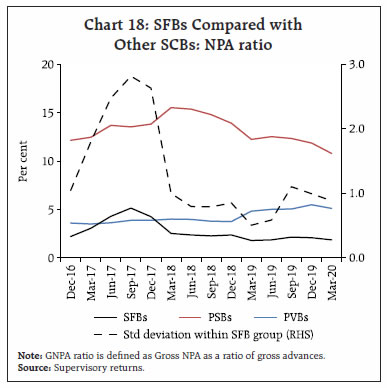
Lower NPA ratio Non-performing assets (NPAs) affect the profitability and thereby the internal accretion of capital of any financial institution. One of the creditable features associated with micro finance has been its lower loan defaults, which have been made possible by better management and supervision of the credit portfolio through the employment of social collateral of self-help groups. SFBs, many of which were erstwhile NBFC-MFIs, too have reported low NPA ratios. Furthermore, the dispersion in the NPA ratio among SFBs has also declined over time (Chart 18). 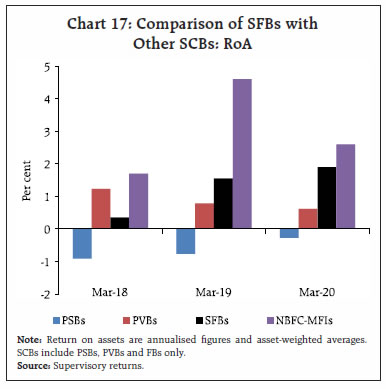
 In the near future, the NPA positions in SFBs, as in other SCBs, may be shaped by various regulatory interventions, including the moratorium and Resolution Framework, introduced to address the COVID-related stress. In the case of MSMEs, the COVID-related Resolution Framework has been aligned with the MSME restructuring package announced earlier in January 2019. Effectively, this has ensured a continued regulatory support to MSMEs, which form a major part of the loan portfolio of SFBs. V. Concluding Observations SFBs are a new entrant into the Indian banking system with a differentiated focus on financial inclusion. A preliminary assessment of these banks, based on supervisory and BSR data since the time of introduction of these institutions, is attempted in this article. SFBs have witnessed a rapid growth in terms of their balance sheet size and branch network. At present, however, they constitute a minuscule part of the financial system. There is a high degree of concentration within the SFB group, with top-two and top-three banks accounting for about 46 per cent and 60 per cent of total assets of the group, respectively. There is a noticeable trend of dissipating concentration in more recent years, as some of the small-sized SFBs have been posting a higher asset growth as compared to their large-sized counterparts. While there has been a rapid expansion in the branch network of SFBs, their branches, similar to PVBs, are concentrated in regions/states that are already well-banked. These include the southern, western and northern regions. More specifically, the states with high concentration of SFB branches are Tamil Nadu, Maharashtra, Karnataka, Kerala and Punjab, which have a much lower population per bank branch as compared to the national average. SFB branches also display concentration in the urban and semi-urban centres or more specifically Tier 1 to Tier 3 centres having population of 20,000 persons and above. Tier 5-6 (rural) centres with population of less than 10,000 persons accounted for only about 18 per cent of the SFB branches in March 2020. These banks are catering to the economic sectors that are relatively under-served by other SCBs. The sectors include agriculture, (small scale) trade and professional services. Moreover, even within the industrial and services sector credit, these banks have succeeded reasonably in reaching out to MSMEs. Apart from serving the under-served sectors, the loan portfolio of SFBs is also geared towards small-sized borrowers. At the aggregate level, about 83 per cent of their loan portfolio had a credit limit of up to ₹25 lakh in March 2020. Although the deposit base of SFBs has been on a striking rise, their percentage of CASA remains lower than other SCBs. An increase in the CASA base can augur well towards lowering the cost of funds for these banks, going forward. The return on funds of SFBs has been higher than other SCBs. Similarly, spread, which decides the return on funds, has been much higher. Consequently, the profitability of these institutions measured by RoA is much higher than their peers in the banking segment. It is, however, lower than NBFC-MFIs, their counterparts in the non-banking segment. The NPA ratio of SFBs has been moderate since their inception, underlining a healthy asset quality. This may be expected as these banks do not suffer from a legacy of NPAs as other SCBs. However, their low NPA ratio also reflects better management of credit risk despite serving a small-sized clientele. References Kumar, P., & Golait, R. (2009), “Bank penetration and SHG-Bank linkage programme: A critique”, Reserve Bank of India Occasional Papers, 29, 119–138. Maheshwari, Shriram (1995), “Rural Development in India: A Public Policy Approach”, Asia-Pacific Journal of Rural Development. 5(2), 121-126.
Appendix | Appendix Table 1: State-wise Distribution of Bank Branches | | State | Number of branches of | State’s share in total branches of | | PVBs | PSBs | SFBs | PVBs | PSBs | SFBs | | Tamil Nadu | 3701 | 6486 | 716 | 10.6% | 7.4% | 16.6% | | Maharashtra | 3920 | 7809 | 563 | 11.3% | 8.9% | 13.1% | | Rajasthan | 1490 | 4219 | 343 | 4.3% | 4.8% | 8.0% | | Karnataka | 2488 | 5913 | 332 | 7.1% | 6.7% | 7.7% | | Gujarat | 2166 | 5222 | 310 | 6.2% | 5.9% | 7.2% | | Madhya Pradesh | 1320 | 4117 | 302 | 3.8% | 4.7% | 7.0% | | Kerala | 2334 | 3393 | 235 | 6.7% | 3.9% | 5.5% | | Punjab | 1650 | 4271 | 204 | 4.7% | 4.9% | 4.7% | | Uttar Pradesh | 2141 | 10900 | 199 | 6.2% | 12.4% | 4.6% | | Bihar | 1037 | 4000 | 180 | 3.0% | 4.6% | 4.2% | | Haryana | 1409 | 2861 | 138 | 4.0% | 3.3% | 3.2% | | Odisha | 922 | 3087 | 126 | 2.6% | 3.5% | 2.9% | | Assam | 758 | 1458 | 123 | 2.2% | 1.7% | 2.9% | | West Bengal | 2459 | 5419 | 112 | 7.1% | 6.2% | 2.6% | | Chhattisgarh | 574 | 1488 | 103 | 1.6% | 1.7% | 2.4% | | Jharkhand | 438 | 2120 | 77 | 1.3% | 2.4% | 1.8% | | NCT of Delhi | 1226 | 2290 | 72 | 3.5% | 2.6% | 1.7% | | Andhra Pradesh | 1199 | 4627 | 48 | 3.4% | 5.3% | 1.1% | | Telangana | 1187 | 3137 | 31 | 3.4% | 3.6% | 0.7% | | Uttarakhand | 346 | 1471 | 24 | 1.0% | 1.7% | 0.6% | | Puducherry | 59 | 146 | 14 | 0.2% | 0.2% | 0.3% | | Tripura | 162 | 236 | 14 | 0.5% | 0.3% | 0.3% | | Chandigarh | 127 | 255 | 10 | 0.4% | 0.3% | 0.2% | | Himachal Pradesh | 175 | 1170 | 8 | 0.5% | 1.3% | 0.2% | | Meghalaya | 62 | 196 | 8 | 0.2% | 0.2% | 0.2% | | Goa | 199 | 473 | 4 | 0.6% | 0.5% | 0.1% | | Sikkim | 49 | 105 | 4 | 0.1% | 0.1% | 0.1% | | Arunachal Pradesh | 20 | 108 | 3 | 0.1% | 0.1% | 0.1% | | Manipur | 42 | 131 | 3 | 0.1% | 0.1% | 0.1% | | Mizoram | 35 | 77 | 1 | 0.1% | 0.1% | - | | Andaman & Nicobar Islands | 13 | 57 | 0 | 0.0% | 0.1% | - | | Dadra & Nagar Haveli And Daman & Diu | 42 | 69 | 0 | 0.1% | 0.1% | - | | Jammu & Kashmir | 958 | 446 | 0 | 2.8% | 0.5% | - | | Ladakh | 46 | 20 | 0 | 0.1% | 0.0% | - | | Nagaland | 43 | 120 | 0 | 0.1% | 0.1% | - | | Lakshadweep | 1 | 12 | 0 | 0.0% | 0.0% | - | | India | 34798 | 87909 | 4307 | 100% | 100% | 100% | Note: ‘-‘ represents nil/negligible.
Based on March 2020 data.
Source: Branch Banking Statistics. |
|