Structural changes in the Indian economy and shifts in pattern of India’s foreign trade warrant updates to the broad (existing 36-currency-based) indices of nominal/ real effective exchange rate (NEER/REER) of the Indian rupee. This article presents the updated series, with two important innovations: the base year is shifted from 2004-05 to 2015-16; and, the existing basket is expanded from 36 to 40 currencies, with the inclusion of eight new currencies and exclusion of four currencies. The new REER indices have remained around the benchmark (i.e., base year value of 100) for most part of the sample period from 2004-05 to 2019-20, reflecting India’s external competitiveness better than the old series. Inflation differentials between India and its major trading partners have declined and stabilised since the adoption of flexible inflation targeting (FIT) framework, boding well for India’s external competitiveness. Introduction Effective exchange rates (EERs) serve as a gauge for assessing the fair value of a currency, the external competitiveness of an economy and even serve as guideposts for setting monetary and financial conditions.1 An EER is a summary indicator of movements of the home currency against a basket of currencies of trading partners. The nominal effective exchange rate (NEER) is an index of the weighted average of bilateral exchange rates of home currency vis-à-vis currencies of trading partners, with weights derived from their shares in the trade basket of the home currency. A real effective exchange rate (REER) is the NEER adjusted by relative prices or costs, typically captured in inflation differentials between the home economy and trading partners. Conceptually, EERs are founded on the purchasing power parity (PPP) hypothesis (Balassa, 1964; Froot and Rogoff, 1994; Sarno and Taylor, 2002). The Reserve Bank compiles and disseminates indices of NEER and REER of the Indian rupee (both trade- and export-weighted), the latest series being constructed with the base year 2004-05.2 Structural changes in the Indian economy and shifts in the relative importance of India’s trading partners since 2004-05 warrant a review of the existing basket of currencies and the weighting scheme. Based on the assessment of India’s macroeconomic and external sector performance in a ‘normal’ year, 2015-16 is chosen as the new base year for the NEER/REER indices. In view of the growing importance of emerging market and developing economies (EMDEs) in India’s foreign trade and to better reflect shifts in external competitiveness, the coverage of the NEER/REER basket has been expanded from 36 to 40 currencies. The new indices of NEER/REER will replace the old series from 2004-05 onwards. The remainder of the article is organised as follows. Section II discusses the rationale for choosing 2015-16 as the new base year. The coverage and criteria for selection of currencies in the new currency basket are addressed in Section III and the new weighting diagram is presented. This is followed by a review of the methodology for computing the NEER/ REER indices in Section IV. An analysis of the main inferences that can be drawn from the new series of NEER/REER indices are discussed in Section V, followed by concluding remarks and some policy perspectives. II. Choice of Base Year The identification of an appropriate base year for the construction/rebasing of indices of NEER and REER involves an assessment of macroeconomic and external sector performance to check for broad correspondence with internal and external balance3. Internal balance implies that real output is at or close to its potential level, and the inflation is low and nonaccelerating (Wong, 2002). External balance refers to a situation in which the current account balance is sustained by capital inflows, and foreign exchange reserves are adequate and relatively stable (Montiel, 2002; Wong, 2002). Based on these definitions, 2015-16 is found to be a suitable year to rebase NEER/REER indices, with real GDP growth at 8.0 per cent, CPI inflation at 4.9 per cent and the current account deficit (CAD) at 1.1 per cent of GDP. III. Coverage and Selection of Currencies Reflecting India’s changing foreign trade pattern, the coverage of NEER/REER indices for the new base year, i.e., 2015-16, has been expanded from 36 to 40 currencies. The selection of currencies for the new NEER/ REER series is based on two major criteria. First, trading partners with extremely high and volatile inflation are excluded as their currencies tend to experience rapid nominal declines, undermining the stability of the NEER/REER indices and obscuring their usefulness in the assessment of external competitiveness.4 Second, data on inflation and exchange rates of trading partners should be available on a regular basis. Taking into account these caveats, bilateral merchandise trade shares are worked out as three-year arithmetic means of trade flows with major trading partners for the period from 2014-15 to 2016-17 (i.e., centred around 2015-16). The evolution of bilateral trade shares of major trading partners warranted the inclusion of eight new countries in the 40-currency basket, viz., Angola, Chile, Ghana, Iraq, Nepal, Oman, Tanzania, and Ukraine. Four countries included in the earlier 36-currency basket, viz., Argentina, Pakistan, Philippines, and Sweden, were replaced. The eight new entrants accounted for 5.4 per cent of India’s total merchandise trade vis-à-vis 1.4 per cent by the exiting countries. The new NEER/REER basket represents 88 per cent of India’s total trade as compared with 84 per cent in the case of the 36-currency basket. Time-varying bilateral trade weights are used to compute indices of NEER/REER of the rupee to reflect the dynamically changing pattern of India’s foreign trade.5 In order to derive the trade-based currency weights, the geometric means of India’s trade (exports plus imports) with trading partners during the preceding three years are computed and then normalised to 100. For instance, weights for 2020-21 are based on geometric means of bilateral trade flows during the preceding three years, i.e., 2017-18 to 2019-20 (Table 1). The new trade-weighted basket is dominated by the currencies of EMDEs. While the euro area retains its top position in the trade basket, the US is assigned the highest weight in the export basket in 2015-16. | Table 1: New 40-Currency NEER/REER Basket – Normalised Weights | | (Per cent) | | Country/Area | 2015-16 | 2020-21 (P) | | Trade-based Weight | Export-based Weight | Trade-based Weight | Export-based Weight | | 1. Euro Area | 11.4 | 14.0 | 11.6 | 14.7 | | 2. China | 10.0 | 5.0 | 12.0 | 5.6 | | 3. UAE | 9.4 | 12.4 | 7.8 | 10.4 | | 4. US | 9.1 | 14.7 | 11.6 | 18.4 | | 5. Saudi Arabia | 6.4 | 4.1 | 4.4 | 2.1 | | 6. Switzerland | 3.7 | 0.5 | 2.7 | 0.4 | | 7. Hong Kong | 2.9 | 4.8 | 3.9 | 4.6 | | 8. Indonesia | 2.9 | 1.8 | 2.8 | 1.6 | | 9. Singapore | 2.8 | 4.4 | 3.2 | 3.7 | | 10. Iraq | 2.7 | 0.4 | 3.2 | 0.6 | | 11. Korea | 2.5 | 1.6 | 2.9 | 1.7 | | 12. Kuwait | 2.5 | 0.4 | 1.3 | 0.5 | | 13. Japan | 2.5 | 2.3 | 2.3 | 1.7 | | 14. Qatar | 2.4 | 0.3 | 1.5 | 0.5 | | 15. Nigeria | 2.3 | 1.0 | 1.8 | 1.0 | | 16. UK | 2.2 | 3.5 | 2.2 | 3.3 | | 17. Malaysia | 2.2 | 1.8 | 2.2 | 2.2 | | 18. Iran | 2.1 | 1.5 | 1.4 | 1.1 | | 19. Australia | 2.0 | 0.9 | 2.2 | 1.2 | | 20. South Africa | 1.8 | 1.9 | 1.5 | 1.4 | | 21. Brazil | 1.5 | 2.2 | 1.1 | 1.3 | | 22. Thailand | 1.3 | 1.4 | 1.6 | 1.5 | | 23. Vietnam | 1.1 | 1.9 | 1.8 | 2.3 | | 24. Bangladesh | 0.9 | 2.2 | 1.3 | 3.1 | | 25. Taiwan | 0.9 | 0.9 | 0.9 | 0.8 | | 26. Angola | 0.9 | 0.2 | 0.6 | 0.1 | | 27. Russia | 0.9 | 0.8 | 1.3 | 0.9 | | 28. Turkey | 0.9 | 1.7 | 1.0 | 1.9 | | 29. Mexico | 0.9 | 0.8 | 1.2 | 1.3 | | 30. Israel | 0.9 | 1.3 | 0.7 | 1.3 | | 31. Sri Lanka | 0.8 | 1.9 | 0.7 | 1.6 | | 32. Canada | 0.8 | 0.8 | 0.9 | 1.0 | | 33. Egypt | 0.7 | 1.1 | 0.6 | 0.9 | | 34. Oman | 0.7 | 1.0 | 0.8 | 0.8 | | 35. Nepal | 0.6 | 1.4 | 1.1 | 2.6 | | 36. Kenya | 0.6 | 1.5 | 0.3 | 0.7 | | 37. Tanzania | 0.5 | 1.0 | 0.4 | 0.6 | | 38. Chile | 0.5 | 0.2 | 0.3 | 0.3 | | 39. Ukraine | 0.4 | 0.2 | 0.4 | 0.1 | | 40. Ghana | 0.2 | 0.3 | 0.5 | 0.2 | | Total | 100.0 | 100.0 | 100.0 | 100.0 | | Memo Items: | | AE Currencies | 41.7 | 49.7 | 45.0 | 52.6 | | EMDE Currencies | 58.3 | 50.3 | 55.0 | 47.4 | AE: Advanced economies. EMDE: Emerging market and developing economies. P: Provisional.
Source: RBI staff calculations. | IV. Methodology The methodology of computing NEER/REER indices is explained below. The NEER is calculated as the geometric weighted average of bilateral exchange rates of the home currency in terms of trading partner currencies. Specifically, the NEER can be calculated as follows: and the REER, which is the NEER adjusted by the weighted average of ratio of domestic price to foreign prices, is calculated as: where ‘e’ represents the exchange rate of the rupee against a numeraire, i.e., the IMF’s Special Drawing Right (SDR), in index form, and ‘ei’ is the exchange rate of the foreign currency ‘i’ against the numeraire in index form. A rise in ‘e’ or ‘e/ei’ represents an appreciation of the rupee relative to currency ‘i’ and vice versa. ‘P’ and ‘Pi’ represent price indices of the home economy and the trading partner ‘i’, respectively. ‘wi’ denotes trade-/export-based weight assigned to foreign currency/trading partner ‘i’, while ‘n’ is the number of currencies (other than home currency) included in NEER/REER basket. V. Performance of New NEER/REER Indices The new 40-currency NEER and REER indices (both trade- and export-weighted) and the old series, i.e., the 36-currency series, move closely, with a statistically significant correlation coefficient of almost 1 (Appendix Table 1). The new REER indices (both trade- and export-weighted), which have remained around the benchmark (i.e., base year value of 100), show a modest appreciation/higher depreciation relative to the old series during November 2015 to May 2019 (Charts 1a and 1b, and Appendix Tables 2 and 3). V.1. Inflation Differentials and REER The decomposition of REER into NEER and weighted average or effective relative price (ERP)6 shows that inflation differentials have remained broadly stable in recent years, following a steady increase during 2008-09 to 2014-15 (Charts 2a and 2b, and Appendix Table 4). This may be attributed to the formal adoption of flexible inflation targeting (FIT) framework by the Reserve Bank in June 2016. The mandate of maintaining price stability (defined by a target of 4 per cent for CPI headline inflation with a tolerance band of +/- 2 per cent around it), while keeping in mind the objective of growth has reduced inflation and anchored inflation expectations in the FIT regime (Eichengreen, Gupta and Choudhary, 2020). Average CPI-based inflation declined to below 4 per cent during 2017-18 to 2019-20 from more than 8 per cent during 2009-10 to 2015-16 (i.e., pre-FIT regime after the global financial crisis). 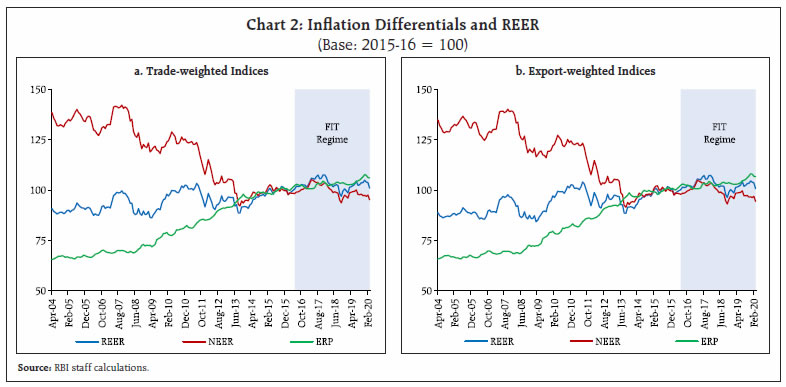 NEER is negatively correlated with inflation differentials during the sample period, with a statistically significant correlation coefficient of 0.95. This is consistent with the basic premise of the PPP hypothesis, according to which a rise in inflation differentials between the home economy and its trading partners induces a depreciation of the home currency and vice versa (Caginalp, 1982; Carbaugh, 2002; Sawyer and Sprinkle, 2015). The new REER indices have shown an appreciating trend since 2004-05, reflecting India’s rising productivity vis-à-vis its trading partners, i.e., the Balassa-Samuelson effect (Box I). Box I: Balassa-Samuelson Effect and New REER The standard version of the Balassa-Samuelson hypothesis (Balassa, 1964; Samuelson, 1964) assumes that purchasing power parity (PPP) holds for traded goods only in the long-run, and predicts that an increase in relative productivity of traded versus nontraded goods in a (fast growing) country vis-à-vis its trading partners induces an appreciation in the real exchange rate of the home currency (Ito et al., 1997; Choudhri and Schembri, 2009; Bordo et al., 2014). A positive relationship between real exchange rate and productivity differentials has been confirmed by a large body of evidence in the empirical literature (Choudhri and Khan, 2005; Ricci et al., 2008; Meshulam and Sanfey, 2019). Following Balassa (1964), Rogoff (1996), and Chong et al. (2010), India’s real GDP per capita relative to the US and a group of major trading partners (including the US) is taken as a proxy for productivity differentials. Using data from 2004 to 2019 on real GDP per capita in PPP terms (at constant 2017 international dollar) for India and its major trading partners (which figure in both old and new NEER/REER baskets), it is observed that India’s real GDP per capita relative to the US and its major trading partners has risen since 2004 (Chart I.1).1 For empirical analysis, monthly data on the new REER indices (trade- and export-weighted) are used for the period from 2004-05 to 2019-20. The correlations between REER and relative real GDP per capita are positive and statistically significant (Table I.1). The unit root test results suggest that the variables are difference-stationary, i.e., integrated of order 1 (Appendix Table 5). The evidence on direction of causation from productivity differentials to real exchange rate is supported in the literature; however, another strand of empirical literature provides evidence in support of the impact of real exchange rate changes on productivity (Harris, 2001; Guillaumont Jeanneney and Hua, 2003; Fung, 2008). Table I.1: Correlations between Productivity Differentials and New REER
(Sample Period: 2004M04 to 2020M03) | | | LPDUS | LPDMPT | LPDMPX | | LREERT | 0.76* | 0.76* | - | | LREERX | 0.81* | - | 0.80* | LREERT: log(REER, trade-weighted);
LREERX: log(REER, export-weighted);
LPDUS: log(India’s real GDP per capita relative to the US);
LPDMPT: log[India’s real GDP per capita relative to major trading partners (Trade basket)]
LPDMPX: log[India’s real GDP per capita relative to major trading partners (Export basket)]
* indicates significant at 1 per cent level.
Source: RBI staff calculations. | The literature on the impact of changes in real exchange rate on productivity argues that the appreciation of real exchange rate reduces the cost of imported capital goods and enhances the capital-labour ratio, thereby boosting technical progress and productivity. The appreciation in real exchange rate may also induce a rise in real wages and, thus, labour productivity in a country where wages of unskilled labourers are relatively low. Furthermore, the appreciation in real exchange rate may boost foreign competition, thereby inducing a rise in technical efficiency and productivity of firms. Given the evidence of bi-directional causation between the real exchange rate and productivity differentials in the literature, a vector autoregression (VAR) Granger causality test for new REER and productivity differentials is conducted. The results suggest that there is a bi-directional Granger causation between these variables (Table I.2). The direction of causality from productivity differentials to REER confirms the Balassa-Samuelson hypothesis, while the direction of causality from REER to productivity differentials indicates the real exchange rate driven productivity growth in the Indian economy. Table I.2: Granger Causality Test Results@
(Sample Period: 2004M04 to 2020M03) | | Dependent Variable | ΔLREERT | ΔLREERX | ΔLPDUS | ΔLPDMPT | ΔLPDMPX | | ΔLREERT | - | - | 27.42** | 27.61* | - | | ΔLREERX | - | - | 28.60** | - | 34.89** | | ΔLPDUS | 22.62* | 23.29* | - | - | - | | ΔLPDMPT | 26.68* | - | - | - | - | | ΔLPDMPX | - | 25.99* | - | - | - | @: Reported figures are Chi-sq. (χ1) statistics. Optimal lag length is based on Akaike Information Criterion (AIC).
Δ: First difference operator.
** and * indicate significant at 1 per cent and 5 per cent levels, respectively.
Source: RBI staff estimates. | In empirical literature, REER also serves as a useful vari-able for assessing the Marshall-Lerner condition to gauge the efficacy of exchange rate in correcting external trade imbalances. In the Indian context, Hsing (2010) and RBI (2015), among others, have found that the Marshall-Lerner condition holds. RBI (2015) estimates the real exchange rate (i.e., price) elasticity of exports to be in the range of 0.7 to 0.9, while elasticity of imports is found to be in the range of 0.3 to 0.5. In contrast, studies such as Raissi and Tulin (2015), and Chinoy and Jain (2019) have found real exchange rate elasticity of exports to be slightly higher in the range of 0.9 to 2.3.
1 Data on real GDP per capita in PPP terms (at constant 2017 international dollar) for India and its major trading partners are taken from the World Bank’s World Development Indicators database. As data on real GDP per capita are not available for Taiwan, only 31 India’s major trading partners (representing 93 per cent of total trade weights in the new NEER/REER basket) are included in the analysis. | VI. Concluding Remarks and Policy Perspectives Since the adoption of floating exchange rates, EERs have become a prominent summary measure of external competitiveness of an economy’s tradables sector relative to foreign tradables. For policymakers, movements in REER serve as a useful guidepost of the overall misalignment of the exchange rate of home currency. In fact, the issue relating to under/over-valuation of currencies has been at the core of several global trade disputes. The International Monetary Fund (IMF) uses REER models (along with current account model) to make external balance assessments for individual economies and produce multilaterally consistent estimates for the current account and real exchange rate norms and gaps. Given the fact that the global trade environment is undergoing a shift, it is important that the NEER/REER basket of the rupee is reviewed regularly. In the case of India, the relative importance of trading partners has shifted mainly towards EMDEs since 2004-05. Taking cognisance of these factors, the broad basket of NEER/ REER indices of the rupee has been expanded from 36 to 40 currencies and rebased to 2015-16. The new REER, on average, was 0.8 per cent above its base year level during 2016-17 to 2019-20, a period coinciding with moderate inflation observed since the adoption of FIT framework. This implies that the inflation differentials between India and its trading partners were less of a concern for former’s external competitiveness under FIT regime. Going forward, large capital inflows unless fully absorbed through current account deficit and/or mopped up as foreign exchange reserves can cause appreciation of the rupee and potentially undermine the export competitiveness. In such a milieu, focus on price stability under FIT regime should remain a policy priority to offset the erosion in external competitiveness which may emanate from appreciation of the rupee in nominal terms. References Balassa, B. (1964), “The purchasing-power parity doctrine: A reappraisal”, Journal of Political Economy, 72(6), 584-596. Bordo, M. D., Choudhri, E. U., Fazio, G. and MacDonald, R. (2014), “The real exchange rate in the long run: Balassa-Samuelson effects reconsidered”, NBER Working Paper Series, No. 20228. Caginalp, O. A. (1982), “Inflation differentials and exchange rate: Theory and empirical evidence”, Nebraska Journal of Economics and Business, 21(4), 19-31. Carbaugh, R. J. (2002), International economics, South- Western, Thomson Learning. Chong, Y., Jordà, Ò. and Taylor, A. M. (2010), “The Harrod-Balassa-Samuelson hypothesis: Real exchange rates and their long-run equilibrium”, NBER Working Paper Series, No. 15868. Choudhri, E. U. and Schembri, L. L. (2009), “Productivity, the terms of trade, and the real exchange rate: The Balassa-Samuelson hypothesis revisited”, Bank of Canada Working Paper 2009-22. Choudhri, E. U. and Khan, M. S. (2005), “Real exchange rates in developing countries: Are Balassa-Samuelson effects present”, IMF Staff Papers, 52(3), 387-409. Chinoy, S. Z. and Jain, T. (2019), “What drives India’s exports and what explains the recent slowdown? New evidence and policy implications”, in S. Shah, B. Bosworth and K. Muralidharan (eds), India Policy Forum 2018, National Council of Applied Economic Research, 15(1), 217-256. Eichengreen, B., Gupta, P. and Choudhary, R. (2020), “Inflation targeting in India: An interim assessment”, Policy Research Working Paper 9422, World Bank Group. Froot, K. A. and Rogoff, K. (1994), “Perspectives on PPP and long-run real exchange rates”, NBER Working Paper Series, No. 4952. Fung, L. (2008), “Large real exchange rate movements, firm dynamics, and productivity growth”, Canadian Journal of Economics, 41(2). Harris, R. G. (2001), “Is there a case for exchange rate induced productivity changes?”, Centre for International Economic Studies, Discussion Paper No. 0110, Adelaide University. Hsing, Yu (2010), “Test of the Marshall-Lerner condition for eight selected Asian countries and policy implications”, Global Economic Review, 39(1), 91-98. Ito, T., Isard, P. and Symansky, S. (1997), “Economic growth and real exchange rate: An overview of the Balassa-Samuelson hypothesis in Asia”, NBER Working Paper Series, No. 5979. Guillaumont Jeanneney, S. and Hua, P. (2003), “Real exchange rate and productivity in China”, Document de travail de la série, CERDI, Etudes et Documents, Ec 2003.28, Centre d’Etudes et de Recherches sur le Développement International. Joshi, V. (1984), “The nominal and real effective exchange rate of the Indian rupee 1971-83”, Reserve Bank of India Occasional Papers, 5(1), 27-87. Meshulam, D. and Sanfey, P. (2019), “The determinants of real exchange rates in transition economies”, Working Paper No. 228, European Bank for Reconstruction and Development. Monetary Authority of Singapore (2013), Monetary policy operations in Singapore, Monetary Authority of Singapore. Montiel, P. J. (2002), “The long-run equilibrium exchange rate: Theory and measurement”, in M. S. Khan, S. M. Nsouli and Chorng-Huey Wong (eds), Macroeconomic Management – Programs and Policies, IMF Institute, International Monetary Fund. Raissi, M. and Tulin, V. (2015), “Price and income elasticity of Indian exports – The role of supply-side bottlenecks”, IMF Working Paper, No. WP/15/161. Reserve Bank of India (2015), Annual Report 2014-15, Reserve Bank of India. Ricci, L. A., Milesi-Ferretti, G. M. and Lee, J. (2008), “Real exchange rates and fundamentals: A cross-country perspective”, IMF Working Paper, No. WP/08/13. Rogoff, K. (1996), “The purchasing power parity puzzle”, Journal of Economic Literature, XXXIV, 647-668. Samuelson, P. A. (1964), “Theoretical notes on trade problems”, The Review of Economics and Statistics, 46(2), 145-154. Sarno, L. and Taylor, M. P. (2002), “Purchasing power parity and the real exchange rate”, IMF Staff Papers, 49(1). Sawyer, W. C. and R. L. Sprinkle (2015), Applied international economics, Routledge, Taylor & Francis Group: London and New York. Wong, Chorng-Huey (2002), “Adjustment and internal-external balance”, in M. S. Khan, S. M. Nsouli and Chorng-Huey Wong (eds), Macroeconomic Management – Programs and Policies, IMF Institute, International Monetary Fund.
| Appendix Table 1: NEER/REER Indices – New and Old Series | | a. NEER Indices | | Year | Trade-weighted | Export-weighted | | Base: 2004-05 = 100 | Base: 2015-16 = 100 | Base: 2004-05 = 100 | Base: 2015-16 = 100 | | 2004-05 | 100.0 | 133.8 | 100.0 | 130.8 | | 2005-06 | 102.2 | 136.8 | 102.2 | 133.7 | | 2006-07 | 97.6 | 130.6 | 98.0 | 128.2 | | 2007-08 | 104.8 | 140.1 | 105.6 | 138.1 | | 2008-09 | 93.3 | 124.9 | 94.0 | 123.0 | | 2009-10 | 90.9 | 121.6 | 91.4 | 119.6 | | 2010-11 | 93.5 | 125.1 | 94.7 | 123.9 | | 2011-12 | 87.4 | 116.9 | 89.1 | 116.6 | | 2012-13 | 78.3 | 104.8 | 80.1 | 104.7 | | 2013-14 | 72.3 | 96.7 | 73.6 | 96.2 | | 2014-15 | 74.1 | 99.1 | 75.2 | 98.4 | | 2015-16 | 74.8 | 100.0 | 76.4 | 100.0 | | 2016-17 | 74.7 | 100.1 | 76.4 | 99.6 | | 2017-18 | 76.9 | 103.2 | 78.9 | 103.1 | | 2018-19 (P) | 72.6 | 97.5 | 74.2 | 97.1 | | 2019-20 (P) | 73.3 | 98.0 | 74.3 | 97.4 | | b. REER Indices | | Year | Trade-weighted | Export-weighted | | Base: 2004-05 = 100 | Base: 2015-16 = 100 | Base: 2004-05 = 100 | Base: 2015-16 = 100 | | 2004-05 | 100.0 | 89.2 | 100.0 | 87.4 | | 2005-06 | 102.4 | 91.3 | 102.0 | 89.1 | | 2006-07 | 100.8 | 89.9 | 100.5 | 87.8 | | 2007-08 | 109.2 | 97.4 | 109.2 | 95.4 | | 2008-09 | 99.6 | 88.9 | 99.7 | 87.1 | | 2009-10 | 103.9 | 92.7 | 105.0 | 91.7 | | 2010-11 | 112.7 | 100.5 | 115.0 | 100.5 | | 2011-12 | 110.3 | 98.4 | 113.2 | 98.9 | | 2012-13 | 105.6 | 94.2 | 108.7 | 95.0 | | 2013-14 | 103.3 | 92.1 | 105.5 | 92.2 | | 2014-15 | 109.0 | 97.2 | 111.2 | 97.2 | | 2015-16 | 112.1 | 100.0 | 114.4 | 100.0 | | 2016-17 | 114.5 | 101.8 | 116.4 | 101.4 | | 2017-18 | 119.7 | 105.9 | 121.9 | 105.7 | | 2018-19 (P) | 114.0 | 100.6 | 116.3 | 100.3 | | 2019-20 (P) | 116.8 | 103.2 | 119.6 | 102.8 | P: Provisional.
Source: RBI staff calculations. |
| Appendix Table 2: NEER Indices (Base: 2015-16 = 100) | | | Apr. | May | Jun. | Jul. | Aug. | Sep. | Oct. | Nov. | Dec. | Jan. | Feb. | Mar. | | a. Trade-weighted Index | | 2004-05 | 138.5 | 135.8 | 134.2 | 132.1 | 131.8 | 132.6 | 132.0 | 131.4 | 133.2 | 134.1 | 135.1 | 134.4 | | 2005-06 | 135.5 | 137.0 | 138.8 | 140.1 | 138.4 | 137.6 | 136.2 | 134.4 | 134.1 | 136.1 | 136.8 | 136.3 | | 2006-07 | 133.3 | 129.9 | 129.4 | 128.1 | 127.1 | 128.7 | 131.0 | 131.5 | 130.6 | 132.4 | 132.6 | 132.5 | | 2007-08 | 137.0 | 141.3 | 141.7 | 141.5 | 140.8 | 141.2 | 142.2 | 140.7 | 141.3 | 140.7 | 138.9 | 134.3 | | 2008-09 | 135.2 | 129.1 | 127.1 | 126.2 | 128.5 | 123.8 | 120.6 | 122.7 | 121.6 | 121.2 | 123.4 | 119.0 | | 2009-10 | 119.9 | 121.2 | 121.8 | 119.8 | 119.5 | 118.2 | 121.3 | 121.3 | 121.9 | 123.9 | 124.5 | 126.5 | | 2010-11 | 128.9 | 127.8 | 126.6 | 123.1 | 123.1 | 124.2 | 126.4 | 124.9 | 125.4 | 124.0 | 123.5 | 123.7 | | 2011-12 | 124.2 | 122.8 | 122.7 | 123.6 | 121.1 | 117.2 | 114.0 | 110.7 | 107.8 | 111.0 | 115.2 | 112.4 | | 2012-13 | 108.8 | 104.7 | 102.7 | 103.8 | 103.3 | 104.2 | 107.1 | 103.9 | 103.7 | 104.3 | 105.6 | 105.3 | | 2013-14 | 105.2 | 104.4 | 98.6 | 98.4 | 93.1 | 92.2 | 94.7 | 93.6 | 94.8 | 95.1 | 94.7 | 96.2 | | 2014-15 | 97.4 | 99.1 | 98.6 | 98.2 | 97.3 | 98.4 | 98.6 | 98.9 | 98.5 | 99.7 | 101.7 | 102.7 | | 2015-16 | 101.9 | 99.6 | 100.1 | 101.4 | 100.3 | 99.5 | 100.8 | 100.1 | 99.7 | 99.8 | 97.7 | 98.7 | | 2016-17 | 98.5 | 98.5 | 98.3 | 99.2 | 99.1 | 99.7 | 100.3 | 100.5 | 101.2 | 100.7 | 101.6 | 103.4 | | 2017-18 | 105.2 | 104.9 | 104.3 | 103.8 | 103.9 | 102.6 | 102.4 | 103.0 | 103.6 | 103.1 | 101.5 | 100.7 | | 2018-19 (P) | 100.0 | 98.8 | 99.2 | 98.9 | 98.5 | 95.1 | 93.7 | 96.1 | 97.5 | 96.9 | 96.1 | 98.7 | | 2019-20 (P) | 99.0 | 99.3 | 99.4 | 100.1 | 97.9 | 97.8 | 98.1 | 97.3 | 97.4 | 96.9 | 97.6 | 95.3 | | b. Export-weighted Index | | 2004-05 | 134.9 | 132.1 | 130.8 | 128.9 | 128.4 | 129.2 | 129.0 | 129.0 | 131.1 | 131.8 | 132.6 | 132.1 | | 2005-06 | 132.9 | 134.3 | 135.7 | 136.7 | 135.4 | 134.5 | 132.8 | 131.0 | 130.8 | 133.1 | 133.7 | 133.3 | | 2006-07 | 130.6 | 127.7 | 126.9 | 125.6 | 124.8 | 126.1 | 128.3 | 129.2 | 128.5 | 130.0 | 130.3 | 130.3 | | 2007-08 | 134.6 | 138.9 | 139.2 | 139.3 | 138.4 | 139.0 | 140.2 | 139.0 | 139.3 | 139.1 | 137.5 | 133.3 | | 2008-09 | 133.8 | 127.6 | 125.7 | 125.0 | 126.9 | 122.1 | 118.6 | 120.4 | 119.4 | 118.7 | 120.9 | 116.6 | | 2009-10 | 117.6 | 119.0 | 119.5 | 117.5 | 117.2 | 116.1 | 119.3 | 119.3 | 119.9 | 122.0 | 122.7 | 124.9 | | 2010-11 | 127.3 | 126.1 | 125.0 | 122.3 | 121.6 | 122.9 | 125.2 | 123.7 | 124.5 | 123.1 | 122.6 | 123.0 | | 2011-12 | 123.4 | 122.1 | 122.2 | 123.3 | 121.0 | 117.0 | 113.8 | 110.5 | 107.6 | 110.8 | 114.8 | 112.3 | | 2012-13 | 108.8 | 104.6 | 102.6 | 103.7 | 103.3 | 104.1 | 107.0 | 103.9 | 103.7 | 104.2 | 105.5 | 105.1 | | 2013-14 | 105.3 | 104.4 | 98.7 | 97.7 | 92.4 | 91.5 | 93.9 | 92.9 | 94.1 | 94.3 | 94.0 | 95.5 | | 2014-15 | 96.7 | 98.5 | 97.9 | 97.5 | 96.6 | 97.8 | 97.9 | 98.1 | 97.6 | 98.9 | 101.1 | 102.1 | | 2015-16 | 102.1 | 99.9 | 100.4 | 101.5 | 100.3 | 99.4 | 100.8 | 100.1 | 99.6 | 99.6 | 97.5 | 98.6 | | 2016-17 | 98.4 | 98.2 | 97.9 | 98.5 | 98.5 | 99.0 | 99.7 | 99.9 | 100.7 | 100.3 | 101.2 | 103.0 | | 2017-18 | 104.9 | 104.5 | 104.0 | 103.5 | 103.7 | 102.5 | 102.2 | 102.8 | 103.4 | 103.1 | 101.6 | 100.7 | | 2018-19 (P) | 100.0 | 98.7 | 99.2 | 98.4 | 98.0 | 94.7 | 93.1 | 95.6 | 97.0 | 96.6 | 95.8 | 98.4 | | 2019-20 (P) | 98.6 | 98.7 | 98.9 | 99.7 | 97.2 | 97.1 | 97.3 | 96.6 | 96.7 | 96.4 | 96.9 | 94.4 | P: Provisional.
Source: RBI staff calculations. |
| Appendix Table 3: REER Indices (Base: 2015-16 = 100) | | | Apr. | May | Jun. | Jul. | Aug. | Sep. | Oct. | Nov. | Dec. | Jan. | Feb. | Mar. | | a. Trade-weighted Index | | 2004-05 | 90.9 | 89.4 | 88.9 | 88.2 | 88.7 | 89.1 | 89.1 | 88.4 | 88.8 | 89.9 | 90.1 | 89.2 | | 2005-06 | 90.0 | 90.3 | 91.6 | 93.7 | 92.6 | 91.8 | 91.2 | 91.1 | 90.4 | 91.2 | 91.4 | 90.8 | | 2006-07 | 89.0 | 87.5 | 88.3 | 87.7 | 87.5 | 89.2 | 91.9 | 92.3 | 91.0 | 91.5 | 91.6 | 91.1 | | 2007-08 | 94.2 | 97.3 | 98.0 | 99.0 | 98.7 | 98.8 | 99.7 | 98.4 | 98.5 | 97.3 | 95.9 | 93.5 | | 2008-09 | 93.6 | 88.8 | 87.9 | 88.2 | 90.9 | 88.3 | 87.6 | 89.6 | 87.9 | 88.1 | 89.5 | 86.5 | | 2009-10 | 86.2 | 87.8 | 88.9 | 90.4 | 90.8 | 90.3 | 93.5 | 95.3 | 95.7 | 98.0 | 97.1 | 98.2 | | 2010-11 | 99.9 | 99.7 | 99.7 | 99.0 | 98.7 | 100.1 | 102.1 | 101.2 | 102.5 | 102.3 | 100.7 | 100.6 | | 2011-12 | 100.8 | 100.0 | 101.3 | 103.4 | 102.2 | 99.8 | 97.3 | 94.8 | 91.7 | 94.6 | 98.4 | 96.3 | | 2012-13 | 94.0 | 91.2 | 90.4 | 92.6 | 93.0 | 94.2 | 97.2 | 94.8 | 94.4 | 95.4 | 96.7 | 96.4 | | 2013-14 | 96.4 | 96.3 | 92.1 | 92.8 | 88.7 | 88.6 | 91.6 | 91.8 | 91.9 | 91.7 | 91.0 | 92.6 | | 2014-15 | 93.4 | 95.5 | 95.6 | 96.7 | 96.5 | 97.3 | 97.4 | 98.0 | 97.0 | 98.2 | 100.0 | 101.0 | | 2015-16 | 99.8 | 98.0 | 99.4 | 100.9 | 100.6 | 100.1 | 101.9 | 101.5 | 100.4 | 100.7 | 97.9 | 98.6 | | 2016-17 | 99.2 | 99.9 | 100.6 | 102.1 | 101.9 | 101.9 | 102.8 | 102.6 | 102.5 | 101.6 | 102.3 | 104.1 | | 2017-18 | 106.0 | 105.7 | 105.5 | 106.7 | 107.5 | 105.6 | 105.9 | 107.6 | 107.6 | 106.3 | 103.8 | 103.0 | | 2018-19 (P) | 102.8 | 101.7 | 102.3 | 102.7 | 102.4 | 98.4 | 97.0 | 99.6 | 100.6 | 99.7 | 98.6 | 101.4 | | 2019-20 (P) | 101.7 | 102.3 | 103.0 | 104.5 | 102.4 | 102.7 | 103.7 | 103.7 | 105.0 | 104.1 | 103.7 | 101.0 | | b. Export-weighted Index | | 2004-05 | 88.8 | 87.2 | 86.9 | 86.3 | 86.6 | 87.0 | 87.2 | 86.8 | 87.5 | 88.2 | 88.4 | 87.6 | | 2005-06 | 88.2 | 88.5 | 89.4 | 91.3 | 90.4 | 89.5 | 88.8 | 88.7 | 88.1 | 89.0 | 89.1 | 88.5 | | 2006-07 | 86.9 | 85.7 | 86.2 | 85.7 | 85.5 | 87.0 | 89.6 | 90.2 | 89.1 | 89.3 | 89.3 | 88.9 | | 2007-08 | 92.0 | 95.1 | 95.8 | 96.9 | 96.5 | 96.7 | 97.8 | 96.6 | 96.5 | 95.3 | 94.1 | 91.9 | | 2008-09 | 92.2 | 87.4 | 86.4 | 86.9 | 89.3 | 86.6 | 85.7 | 87.6 | 86.0 | 85.9 | 87.3 | 84.4 | | 2009-10 | 85.1 | 86.8 | 87.9 | 89.3 | 89.6 | 89.3 | 92.5 | 94.2 | 94.8 | 97.1 | 96.4 | 97.6 | | 2010-11 | 99.5 | 99.2 | 99.3 | 99.3 | 98.5 | 100.0 | 102.0 | 101.2 | 102.7 | 102.5 | 100.9 | 101.0 | | 2011-12 | 100.9 | 100.3 | 101.7 | 104.0 | 103.0 | 100.4 | 97.9 | 95.3 | 92.2 | 95.1 | 98.8 | 97.0 | | 2012-13 | 94.7 | 91.8 | 91.1 | 93.5 | 93.8 | 95.0 | 98.0 | 95.6 | 95.3 | 96.2 | 97.5 | 97.3 | | 2013-14 | 97.0 | 96.8 | 92.7 | 92.7 | 88.6 | 88.5 | 91.5 | 91.6 | 91.7 | 91.5 | 90.9 | 92.4 | | 2014-15 | 93.3 | 95.5 | 95.6 | 96.6 | 96.6 | 97.3 | 97.4 | 98.0 | 96.9 | 98.2 | 100.2 | 101.0 | | 2015-16 | 100.0 | 98.2 | 99.5 | 101.0 | 100.6 | 100.0 | 101.8 | 101.4 | 100.3 | 100.5 | 97.9 | 98.7 | | 2016-17 | 99.3 | 99.8 | 100.2 | 101.5 | 101.3 | 101.4 | 102.2 | 102.2 | 102.1 | 101.2 | 102.0 | 103.7 | | 2017-18 | 105.6 | 105.3 | 105.2 | 106.5 | 107.3 | 105.5 | 105.6 | 107.3 | 107.3 | 106.2 | 103.9 | 103.0 | | 2018-19 (P) | 102.6 | 101.5 | 102.1 | 102.1 | 101.8 | 97.9 | 96.4 | 99.1 | 100.3 | 99.5 | 98.6 | 101.3 | | 2019-20 (P) | 101.6 | 101.9 | 102.6 | 104.3 | 102.0 | 102.3 | 103.3 | 103.3 | 104.6 | 104.0 | 103.6 | 100.7 | P: Provisional.
Source: RBI staff calculations. |
Appendix Table 4: Inflation Differentials and REER
(Base: 2015-16 = 100) | | Year | a. Trade-weighted Index | b. Export-weighted Index | | REER | NEER | ERP | REER | NEER | ERP | | 2004-05 | 89.2 | 133.8 | 66.7 | 87.4 | 130.7 | 66.8 | | 2005-06 | 91.3 | 136.8 | 66.8 | 89.1 | 133.7 | 66.7 | | 2006-07 | 89.9 | 130.6 | 68.8 | 87.8 | 128.2 | 68.5 | | 2007-08 | 97.4 | 140.1 | 69.5 | 95.4 | 138.1 | 69.1 | | 2008-09 | 88.9 | 124.9 | 71.2 | 87.1 | 123.0 | 70.9 | | 2009-10 | 92.7 | 121.6 | 76.2 | 91.7 | 119.6 | 76.7 | | 2010-11 | 100.5 | 125.1 | 80.4 | 100.5 | 123.9 | 81.1 | | 2011-12 | 98.4 | 116.9 | 84.2 | 98.9 | 116.6 | 84.9 | | 2012-13 | 94.2 | 104.8 | 89.9 | 95.0 | 104.7 | 90.7 | | 2013-14 | 92.1 | 96.7 | 95.3 | 92.2 | 96.2 | 95.9 | | 2014-15 | 97.2 | 99.1 | 98.1 | 97.2 | 98.4 | 98.8 | | 2015-16 | 100.0 | 100.0 | 100.0 | 100.0 | 100.0 | 100.0 | | 2016-17 | 101.8 | 100.1 | 101.7 | 101.4 | 99.6 | 101.8 | | 2017-18 | 105.9 | 103.2 | 102.6 | 105.7 | 103.1 | 102.6 | | 2018-19 (P) | 100.5 | 97.4 | 103.2 | 100.3 | 97.1 | 103.2 | | 2019-20 (P) | 103.2 | 98.0 | 105.3 | 102.8 | 97.4 | 105.6 | P: Provisional.
Source: RBI staff calculations. |
| Appendix Table 5: Unit Root Test Results | | Variable | Level | | Constant | Constant, Trend | | ADF | PP | KPSS | ADF | PP | KPSS | | LREERT | -1.94 | -2.05 | 1.20 | -3.31 | -2.88 | 0.05** | | LREERX | -1.78 | -1.89 | 1.31 | -3.22 | -2.74 | 0.05** | | LPDUS | -1.62 | -1.09 | 1.69 | -1.64 | -3.51* | 0.23 | | LPDMPT | -1.29 | -0.89 | 1.67 | -2.52 | -3.27 | 0.16** | | LPDMPX | -1.68 | -1.44 | 1.68 | -1.57 | -2.68 | 0.33 | | Variable | First Difference | | Constant | Constant, Trend | | ADF | PP | KPSS | ADF | PP | KPSS | | LREERT | -12.05** | -11.96** | 0.03** | -12.02** | -11.93** | 0.03** | | LREERX | -11.81** | -11.72** | 0.04** | -11.78** | -11.69** | 0.03** | | LPDUS | -2.20 | -16.96** | 0.15** | -2.55 | -17.27** | 0.07** | | LPDMPT | -2.23 | -17.03** | 0.11** | -2.36 | -17.15** | 0.06** | | LPDMPX | -2.31 | -16.97** | 0.20** | -2.70 | -17.16** | 0.05** | ** and * indicate significant at 1 per cent and 5 per cent levels, respectively.
ADF: Augmented Dickey-Fuller.
PP: Phillips-Perron.
KPSS: Kwiatkowski-Phillips-Schmidt-Shin.
Source: RBI staff estimates. |
|