COVID-19 sent financial markets in India as also the world into a tailspin. Financial institutions were faced with liquidity stress, loss of access to funding and tightening of financial conditions amidst disruption of cash flows and working capital cycles. In response, the Reserve Bank deployed several conventional and unconventional tools to restore orderly conditions in financial markets and maintain normal functioning of financial intermediaries. This article evaluates the efficacy of this unprecedented policy effort with actual outcomes. “May you live in interesting times.” This ancient, apocryphal, Chinese curse pithily depicts the life and ethos of modern central banks. Crises summon them up from anonymous depth of their day-to-day existence into which they relapse when the job is done. Over recent decade, visitations of crises have reoccurred with disturbing frequency and intensity and consequently, central banks are repeatedly called upon to assume the mantle of defenders of the first resort. The COVID-19 pandemic is, however, exploding into a crisis like no other in the recent human history. The unconscionable loss of human lives and destruction of economic activity has induced extreme uncertainty in financial markets under what has been called as ‘The Great Lockdown’ (IMF, 2020). Financial markets in India went into a tailspin and several financial institutions faced stress in terms of loss of access to/higher cost of funding amidst disruption of cash flows and working capital cycles. The Reserve Bank acted swiftly and proactively, deploying several conventional and unconventional tools to restore orderly conditions in financial markets. This unprecedented policy offensive was launched on the platform of extraordinary monetary policy accommodation in which the policy repo rate has been lowered by 115 bps since March 2020, taking the size of cumulative rate cuts to 250 bps since February 2019. In the event, the entire term structure of interest rates has softened in sync with the monetary policy stance, and liquidity constraints have been dissipated before they could morph into solvency concerns in the financial system. Against this backdrop, this article attempts to analyse the impact of the Reserve Bank’s measures on borrowing costs, new issuances of marketable instruments and financing conditions. The rest of the article is divided into four sections. Section II discusses liquidity conditions in the banking system. Section III deals with the money market and Sections IV and V assess the impact of the Reserve Bank’s measures on the government bond market and the corporate bond market, respectively. Section VI deliberates on the conditions in equity markets and Section VII concludes with lessons drawn from this unique experience and some policy perspective. II. Liquidity Conditions Banking system liquidity refers to the availability of reserve funds with the banks, the dominant financial intermediaries in India with preferred access to central bank liquidity. On a given day, system liquidity is in deficit (i.e., system demand for borrowed reserves is positive), if the banking system is a net borrower from the Reserve Bank at its liquidity windows. Per contra, the system liquidity is in surplus (i.e., system demand for borrowed reserves is negative) if the banking system is a net lender to the Reserve Bank. System liquidity is mirrored in the net-Liquidity Adjustment Facility (LAF) position1. The Reserve Bank publishes this vital statistic on liquidity condition in its Money Market Operations (MMO) press release every day. Box-1: Revised Liquidity Management Framework Liquidity management, which is the operating procedure of monetary policy, seeks to ensure adequate liquidity in the banking system and is designed to aid the first step in the monetary policy transmission, i.e., transmission of changes in the policy rate to the inter-bank call money rate, the market for central bank reserves. Since successful conduct of monetary policy requires effective liquidity operations, the liquidity management framework needs to be carefully designed and deployed. While the liquidity management framework deployed by the Reserve Bank in 2014 had proved to be robust and resilient during the demonetisation period, based on the experience gained in the conduct of liquidity management operations, it was felt necessary to review the liquidity management framework. Accordingly, as announced in the Statement on Developmental and Regulatory Policies of June 06, 2019, an Internal Working Group (IWG) was constituted with a mandate to review the current liquidity management framework with a view to simplifying it and suggest measures to clearly communicate the objectives and the toolkit for liquidity management. The report of the IWG was published on the Reserve Bank website on September 26, 2019 for comments from the stakeholders and members of public. Based on the feedback received, it was decided to fine-tune the existing liquidity management framework. The key elements of the revised framework are - -
The weighted average call rate (WACR) will continue to be the operating target. -
With the WACR being the single operating target, the need for specifying a one-sided target for liquidity provision of one percent of net demand and time liabilities (NDTL) was removed and the daily fixed rate repo and four 14-day term repos conducted every fortnight were withdrawn. -
Markets were assured that the Reserve Bank will ensure adequate provision/absorption of liquidity as warranted by underlying and evolving market conditions - unrestricted by quantitative ceilings - at or around the policy rate. -
A 14-day term repo/reverse repo operation at a variable rate and conducted to coincide with the cash reserve ratio (CRR) maintenance cycle was made the main liquidity management tool for managing frictional liquidity requirements. The main liquidity operation would be supported by fine-tuning operations, overnight and/or longer, to tide over any unanticipated liquidity changes during the reserve maintenance period. -
Standalone Primary Dealers (SPDs) were allowed to participate directly in all overnight liquidity management operations. -
In order to improve communication on the Reserve Bank’s liquidity management framework and procedures - (a) the Press Release detailing Money Market Operations (MMO) was modified to show both the daily flow impact as well as the stock impact of the Reserve Bank’s liquidity operations; and, (b) a quantitative assessment of durable liquidity conditions of the banking system on a fortnightly basis would be published with a lag of one fortnight. Based upon the revised liquidity management framework as above, the Reserve Bank published the suite of liquidity facilities and the instruments were clearly demarcated to manage short-term/transient liquidity and durable liquidity. | System liquidity, which was in slight deficit at the start of 2019, turned into surplus by May 2019. The surplus increased to ₹1 lakh crore on a net daily average basis, starting July 2019 and expanded manifold since then. Starting February 2020, the Reserve Bank was absorbing around ₹3 lakh crore from the banking system on a daily average basis (Chart 1). And then COVID-19 broke out. By March 11, 2020, the World Health Organisation (WHO) declared a pandemic; by March 25, India went into lockdown. The Reserve Bank launched into overdrive. Setting aside its scheduled bi-monthly meetings, the monetary policy committee (MPC) met off-cycle on March 24 to 27 and May 20 to 22, 2020, and voted to reduce the policy rate by 115 bps, over and above the reduction of 135 bps during February 2019 to February 2020, bringing the cumulative reduction in the policy rate to 250 bps. The general easing of financial conditions that ensued, created congenial conditions and set the stage for unveiling an array of measures aimed at boosting – (1) system level liquidity (2) sector specific funding (3) institution level liquidity; and, (4) instrument level liquidity (Annex-1) III. Money Markets Money markets have remained flush with surplus liquidity due to the Reserve Bank’s support through LAF windows. The net LAF position, which was around ₹3.0 lakh crore on an average, during Q4: 2019-20, increased to an average of ₹4.7 lakh crore during Q1: 2020-21 (up to June 22, 2020). In fact, the Reserve Bank has had to engage in daily absorption operations with the average deposit of funds in the overnight reverse repo window increasing more than three times - from an average of ₹2.4 lakh crore to ₹7.0 lakh crore during the same period. Due to abundant surplus liquidity, the weighted average overnight money market rate (WAMM) has hugged the bottom of the policy corridor, i.e., reverse repo rate rather than the repo rate. Further, the tri-party repo rate (TREPS) and market repo rate have consistently remained lower than the reverse repo rate (Chart 2). The weighted average call money rate (WACR), which averaged 17 bps below the repo rate during January-March 2020, fell 37 bps below the repo rate, on an average, during April-June 2020. The average spread between the Repo rate and TREPS rate, which was at 72 bps during January-March 2020 widened to 135 bps during April-June 2020. In August 2018, the Infrastructure Leasing & Financial Services Ltd. (IL&FS), a non-bank finance company (NBFC), defaulted on its commercial paper (CPs) obligations. This default brought the funding structure and ALM mismatches of NBFCs under scrutiny, and these concerns got extended to housing finance companies (HFCs) after the collapse of a large housing finance company in 2019. The resultant default/contagion fears led to an equity market sell-off and brought the focus on NBFCs (including HFCs), especially their exposures, adverse selection of assets and funding of long-term assets with short-term liabilities. The markets became extremely risk averse towards NBFCs and HFCs in general, and in particular to those perceived to be more vulnerable. While system liquidity conditions remained comfortable starting from H2 of FY 2018-19, increase in funding costs and partial loss of market access in some cases led to liquidity stress for such NBFCs and HFCs. 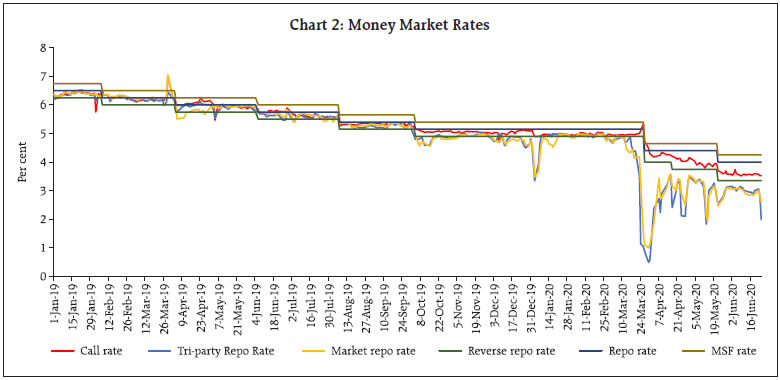 The Reserve Bank acted with a sense of urgency and provided support by permitting commercial banks to provide partial credit enhancement to bonds issued by select NBFCs and HFCs, permitting banks to reckon government securities held by them up to an amount equal to their incremental outstanding credit to NBFCs and HFCs as Level-1 high quality liquid assets (HQLA), and increasing the pace and quantum of liquidity infusion via open market operations (OMOs) and term repos. The list of eligible borrowers for external commercial borrowings (ECBs) was also expanded to include HFCs and the average maturity requirement for ECBs in the infrastructure segment was reduced from 5 years to 3 years. These measures, along with liberal provision of liquidity and policy easing throughout 2019, helped to stabilise the market financing conditions. As regards the short-term financing conditions facing corporate entities, on account of the general slowdown in the economy, there was a drop in fresh CP issuances by all category of borrowers in January and February 2020. The yield on 3-month CPs also increased in January 2020 as compared to previous month, especially for private NBFCs. However, as a result of the Reserve Bank’s policy interventions, CP issuances improved by 50 per cent in March 2020 over the previous month. The yields on CPs (3-month) in primary market have also dropped in tandem with other interest rates while for All India Financial Institutions (AIFIs) and HFCs, the yields have dropped even below the overnight policy rate (Chart 3 and 4). 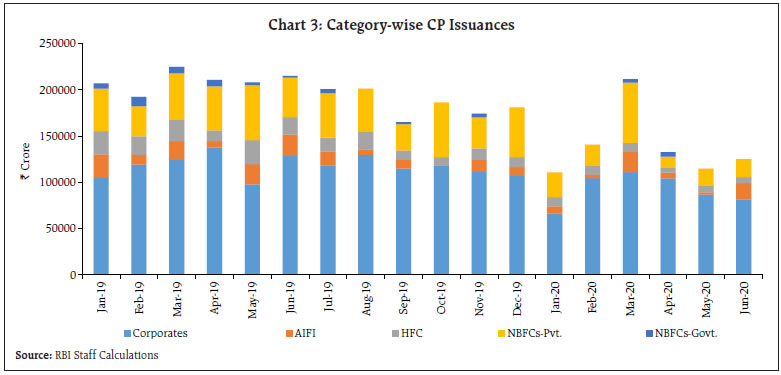 Total outstanding CPs, which stood at ₹6.88 lakh crore as on July 31, 2018, declined by 39 per cent to ₹4.17 lakh crore as on April 30, 2020 primarily in the case of private NBFCs and HFCs. Issuances by corporates and AIFIs remained largely unchanged. Outstanding CPs of private NBFCs, in particular, fell by 71 per cent, from ₹2.22 lakh crore as on July 31, 2018 to ₹64,253 crore as on April 30, 2020 (Rituraj, et al. 2020). Thus, while corporates and AIFIs continue to benefit from lower interest rates on short-term instruments, the NBFCs and HFCs have had to reduce their reliance on short-term financing. Given the nature of balance sheet of NBFCs, especially those engaged in infrastructure and other long-term financing activities, and HFCs, this development, if sustained, could impart the much-needed resilience to the sector. 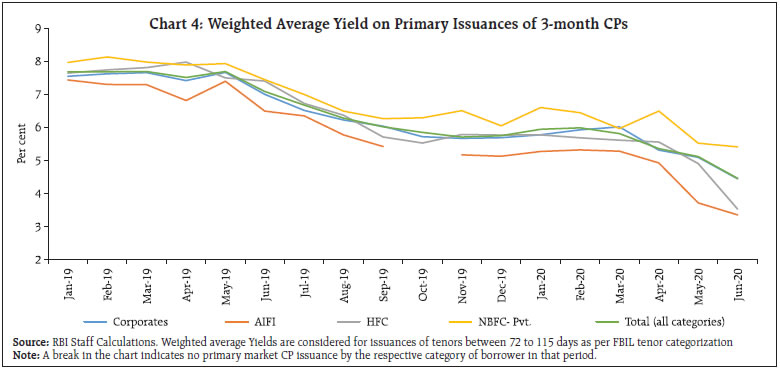 Interest rates on Certificate of Deposits (CDs), important short-term financing instruments, especially for the banks with a low current and savings account (CASA) base, have also decreased. The yields on 3- and 6-month CDs have fallen below the policy repo rate. In fact, the yield on 3-month CDs fell below the reverse repo rate in the past few days (Chart 5). While policy easing has played an important role, surplus liquidity in the banking system has reduced the reliance of banks on CDs as a mode of financing. The current level of surplus liquidity in the system has ensured that the short-term rates have remained anchored and soft relative to the policy repo rate, aiding monetary policy transmission with positive spillovers to other segments of the market spectrum. IV: Government Securities Market and the Risk-Free Curve The first port of call in the transmission of changes in the policy rate is the inter-bank call money rate, as described in Section III. Subsequently, this impulse gets transmitted to longer term risk-free interest rates and other traded financial instruments, and finally to loan and deposit rates. Before COVID-19, sentiment in the government securities (G-sec) market was agitated by concerns about fiscal slippages due to fall in government revenue receipts, lower than projected Goods and Services Tax (GST) collections and gap in disinvestment proceeds in relation to the target, and fears of additional borrowing kept the market on edge. Consequently, monetary policy transmission via the G-sec market was lagged and incomplete. As against the policy repo rate reduction of 135 bps between February and December 2019, the 10-year benchmark security yield had fallen by around 88 bps only. The MPC’s decision to pause in December 2019 caught the market - which was positioned for a rate cut - off-guard. The 10-year benchmark yield jumped by 14 bps (from 6.47 per cent to 6.61 percent) on the day the MPC decision was announced and continued to climb, touching 6.75 per cent on December 19, 2019. While the short end of the yield curve remained anchored on account of liquidity surplus, fears of excess supply of paper led to hardening of longer-term yields. As all market instruments are priced off the G-sec yield curve, the increase in yields of government securities has a corresponding impact on the yields of corporate bonds and other instruments, constraining market access and undermining the effect of policy easing. In order to overcome this impasse, the Reserve Bank decided to conduct special OMOs2 involving simultaneous purchase of longer-dated securities and sale of short-tenor securities. The first such operation was announced on December 19, 2020. The announcement effect itself had the desired impact and domestic bond yields declined across the curve on the next day, with the 10-year benchmark yield closing lower by 15 bps at 6.60 per cent. After the Union Budget announcement on February 01, 2020, the 10-year yield fell sharply as some select G-Secs were opened fully for Foreign Portfolio Investors (FPIs) and no additional borrowing was announced in the budget. The Reserve Bank backed the fall in yields by announcing the revised liquidity management framework (Box-1) and additional liquidity infusion through Long Term Repo Operations (LTROs) of 1-year and 3-year tenor in the Statement of Regulatory and Developmental policies of February 06, 2020. The 10-year benchmark yield closed at 6.45 per cent on February 06, 2020 along with a pronounced downward movement in the 1-3 year yields. In retrospect, it was the combination of the policy easing and the liquidity measures that caused yields on G-Secs to drop to their lowest level in more than a decade (Chart 6). 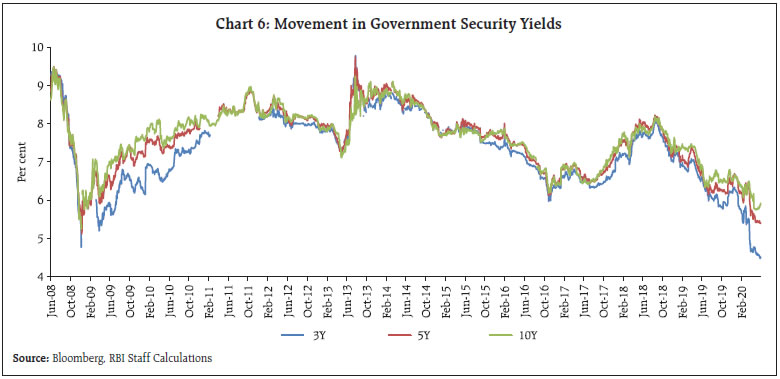 Abundant liquidity anchored the short-term G-Sec yields closer to the policy repo rate. In fact, the 3-month T-bill cut-off in the primary issuances has generally remained lower than the reverse repo rate since March 2020. In the secondary market, the 3-month T-bill yield has dropped by around 183 bps since the LTRO announcement in February 2020. The 3-year G-Sec yield, too, has fallen by 163 bps since the LTRO announcement, benefitting from the tenor of this instrument (up to 3 years). The term premium up to one year, defined as the spread of T-Bill3 yields over the policy repo rate, turned negative since mid-April 2020 (Chart 7). On the other hand, the spreads between the longer-term G-Sec yields and the repo rate, which were near their highs in May/June 2018, have also dropped after another special OMO was conducted in April 2020. Nonetheless, long-term rates have not fallen commensurately with T-Bill yields due to additional borrowing by the government necessitated by COVID-19 (Chart 8). This has steepened the G-Sec yield curve. The 2y-10y spread, which touched 173 bps on May 11, 2020 after the announcement of additional government borrowing, has dropped to 158 bps on June 25, 2020 (Table 1). 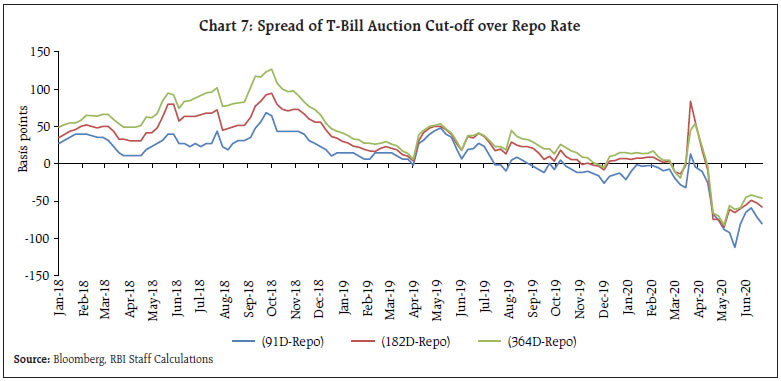 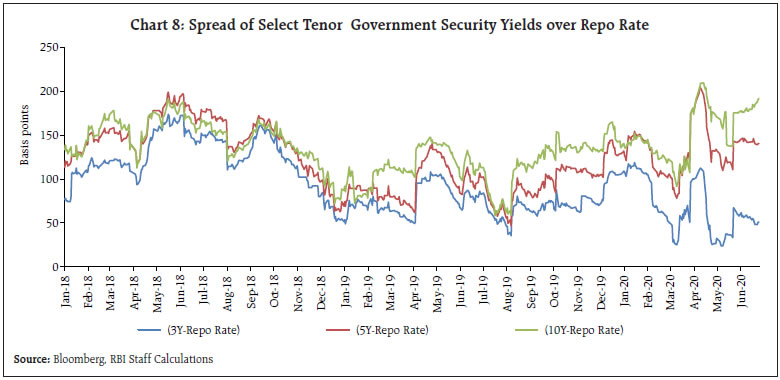
| Table 1: Spread between Different Tenors of Government Security Yields (bps) | | Tenors | Apr 02, 2019 | Jul 01, 2019 | Oct 01, 2019 | Jan 01, 2020 | Apr 02, 2020 | Jun 25, 2020 | | 2Y-5Y | 35 | 49 | 61 | 64 | 102 | 104 | | 3Y-7Y | 48 | 33 | 43 | 36 | 116 | 140 | | 5Y-10Y | 40 | 11 | 36 | 10 | 2 | 53 | | 2Y-10Y | 75 | 60 | 97 | 74 | 104 | 158 | | Source: Bloomberg, RBI Staff Calculations | On May 08, 2020 the Government of India revised its budgeted estimate (BE) and announced that it would borrow ₹12 lakh crore instead of ₹7.80 lakh crore in 2020-21. The borrowing limits for the States for the year were also raised to 5 per cent of GSDP from 3 per cent. A portion of the additional borrowing by the States would be contingent on their performance against identified benchmarks. Despite the increase in government borrowings and the significant loss of revenue due to the lockdown, the G-Sec market has remained resilient and stable owing to targeted interventions from the Reserve Bank comprising LTROs, outright OMO purchases of ₹1.61 lakh crore and Operation Twists. Since the start of this year, both 3-month and 3-year yields have dropped by 188 bps, the 7-year yield by 92 bps, the 10-year yield 86 bps and the 15-year yield has dropped by around 68 bps (Chart 9). 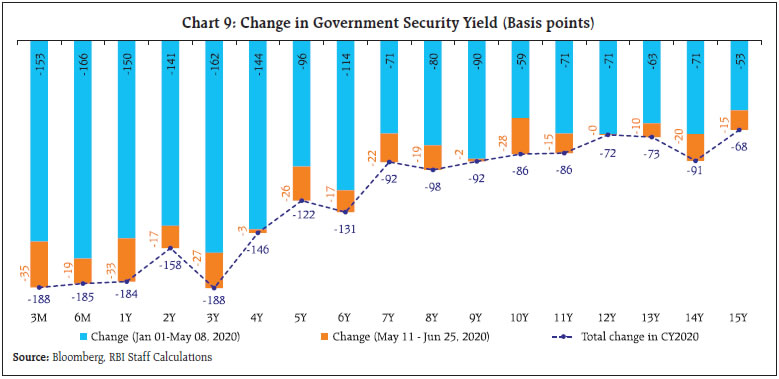 Apart from market operations, the Reserve Bank has also taken several additional steps to support the Central as well as State governments at this critical time. The limits on Ways and Means Advances (WMA) of the Central and State Governments have been increased to give them time to plan their additional borrowings. The norms for withdrawal from the Consolidated Sinking Fund (CSF) of the States have been relaxed to enable management of redemption pressure without resorting to additional borrowings. V. Corporate Bond Market The corporate bond market is an important source of financing for the private sector. An active corporate bond market also provides an avenue for institutional investors such as insurance companies and provident and pension funds with long term financial assets, to match their liabilities (RBI, 2016). Yields on better-rated corporate bonds, which were on a downtrend after the taper tantrum of 2013 till the end of 2017, started to inch up from the beginning of 2018 as financial conditions tightened. The corporate bond market suffered a major setback after the IL&FS event of 2018, which adversely impacted the market access of NBFCs and HFCs. An increase in yield not only impedes the ability of issuers to access the market; it also affects existing investors as the prices of bonds fall. Therefore, a pervasive risk aversion prevailed among investors, even though corporate bond yields were on a downward trajectory during 2019 (Charts 10 and 11). 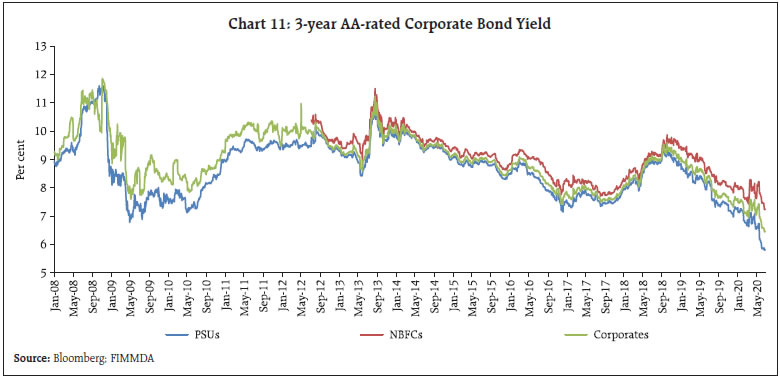 With the spread of COVID-19 and the consequent nation-wide lockdown, liquidity and credit risk premiums in the corporate bond market surged as investors feared defaults due to loss of revenue streams. Risk aversion impeded participation in secondary markets. While the LTROs eased access to the corporate bond market, the Reserve Bank announced Targeted Long Term Repo Operations (TLTROs) on March 27, 2020 for ₹1.0 lakh crore to address higher illiquidity premiums in the corporate bond market. The 3-year funds availed by the banks under this facility had to be deployed in fresh acquisition of investment grade corporate bonds, CPs and Non-convertible Debentures (NCDs) in both primary and secondary segments of the markets. During April, May and June 2020, market access opened up and became much more broad-based, with all category of entities being able to access the primary market (Chart 12). The total primary market issuances, which had dropped by almost 20 per cent in March 2020 from a month ago, registered a growth of 15 per cent in April 2020 and 7 per cent in May 2020, rising to ₹73,000 crore, a three month high. The weighted average rate of issuances of corporate bonds in the 2-3 years bucket (TLTRO funds were available for 3-year period) was lower by around 150 bps in April from its level in March 2020 (Rituraj, et al., 2020). This drop in yields occurred despite an increase in the supply of corporate bonds in that tenor. Around 74 per cent of the total issuance in April 2020 was in 2-3 years bucket as compared to around 41 per cent and 24 per cent during February and March 2020, respectively, clearly showing the impact of the TLTROs. While the corporate bond market in India has traditionally been a bastion of AAA-rated entities, the stylised evidence suggests that the recent Reserve Bank measures were successful in rekindling the investors’ risk appetite. In the months when deployment of funds availed by banks under LTROs/ TLTROs was underway, even non-AAA rated entities were able to access the market. In February 2020, when the LTROs were conducted, the share of non-AAA rated issuances increased to 19 per cent from 11 per cent in January 2020. Similarly, when deployment of TLTRO funds was underway in April-May 2020, the share of non-AAA rated issuances was higher (Chart 13). 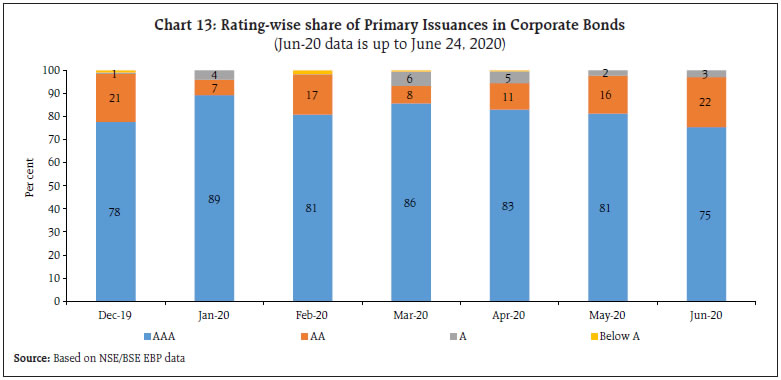 The Reserve Bank announced TLTRO 2.0 on April 17, 2020 to channelise liquidity to small and mid-sized corporates, including NBFCs and micro finance institutions (MFIs). The funds availed under TLTRO 2.0 were deployed in investment grade bonds, CPs and NCDs of NBFCs. Importantly, it was mandated that at least 50 per cent of the total funds availed have to be invested in the securities/instruments issued by MFIs and smaller NBFCs. This led to a further improvement in the share of non-AAA rated borrowers to 25 per cent in June from 19 per cent in May 2020. Additionally, the Reserve Bank provided special refinance facilities for a total amount of ₹65,000 crore to the AIFIs, viz., the National Bank for Agriculture and Rural Development (NABARD), the Small Industries Development Bank of India (SIDBI), the National Housing Bank (NHB) and the Export Import Bank (Exim) to enable them to meet the sectoral credit needs of the economy. This facility complemented and backstopped the targeted liquidity provision made through TLTRO 2.0 and helped in meeting the funding requirements of agriculture and the rural sector, small industries, HFCs, NBFCs and MFIs. As on July 07, 2020, the NABARD had availed ₹22,000 crore out of ₹25,000 crore under the refinance facility and the NHB had availed ₹9,537 crore (out of ₹10,000 crore). Total availment by the SIDBI was ₹7,935 crore so far while Exim Bank has not availed refinance under this facility yet. The lines of credit provided relief and finance at a time when market access was constrained, and risk aversion was overwhelming for these entities/sectors. In response to the stipulation of investing a fraction of TLTRO funds in the secondary market, the daily average secondary market trading volume registered a sharp increase of 77 per cent in April 2020 as compared to December 2019. The monthly trading volume in the secondary market crossed ₹2 lakh crore each during March and April 2020 for the first time since 2008 (Chart 14). 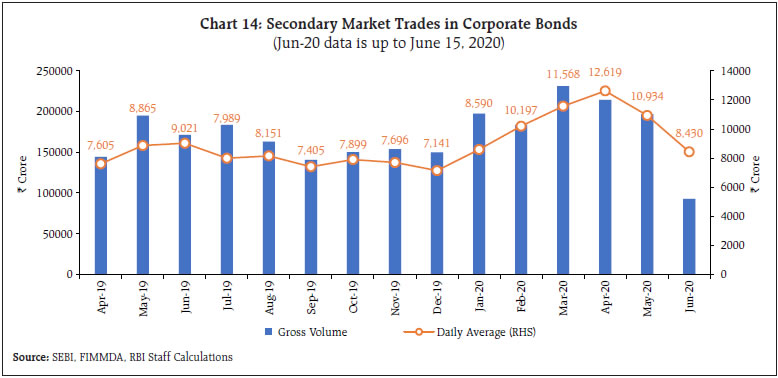 The provision of liquidity through unrestricted (LTROs) as well as targeted instruments (TLTROs), together with policy easing, has helped in reducing borrowing costs for AAA- and AA-rated borrowers to their lowest level in a decade and the yields for both categories have also reduced (Chart 15 and 16). The fall in the AAA yields is similar to that of the G-Secs, with short-term yields falling more than the long-term yields. However, for AA-rated entities, the yields have fallen most in the 2-3 year tenor. This reveals that the TLTROs helped to ease the stress for non-AAA rated entities as well. Within the same tenor, the fall in yield has varied for different categories of entities, based on risk perceptions. The fall in yield has been maximum for PSUs followed by corporates. The fall in yield for NBFCs, though substantial, has lagged the other two categories. 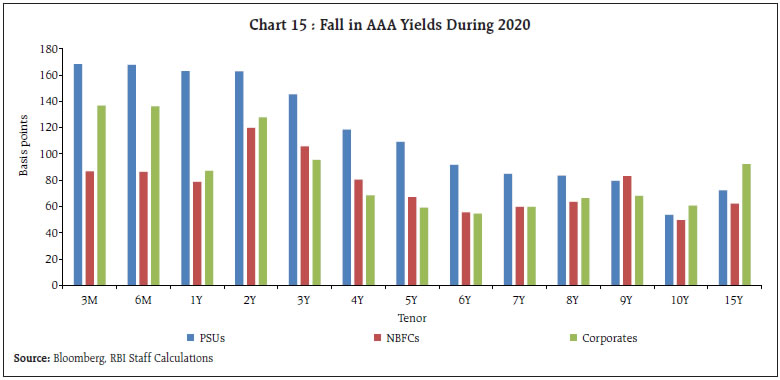 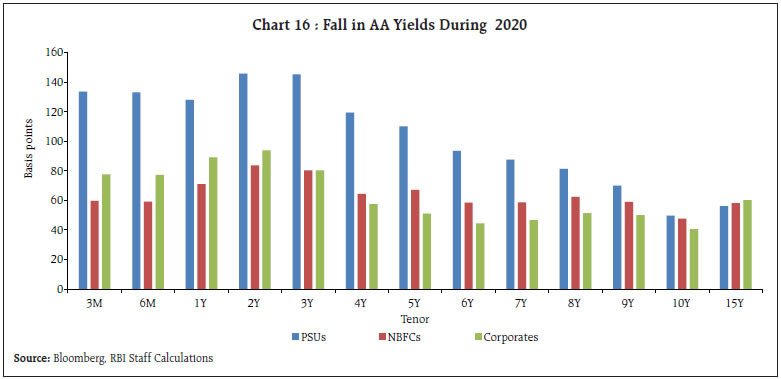 Further evidence of improvement in risk appetite after the announcement of TLTROs is the compression of spreads of corporate bond yields over similar tenor G-Secs from the elevated levels witnessed in the last week of March 2020. The fall in the spread of AAA-rated NBFCs has been the maximum at 170 bps, followed by PSUs, FIs and banks (147 bps) and corporates (146 bps). For AA-rated entities, the fall in spreads was 156 bps for NBFCs, 143 bps for PSUs, FIs and banks and 138 bps for corporates. Spreads on the instruments issued by the PSUs, FIs and banks category have reverted to the pre-COVID levels (Chart 17 and 18). 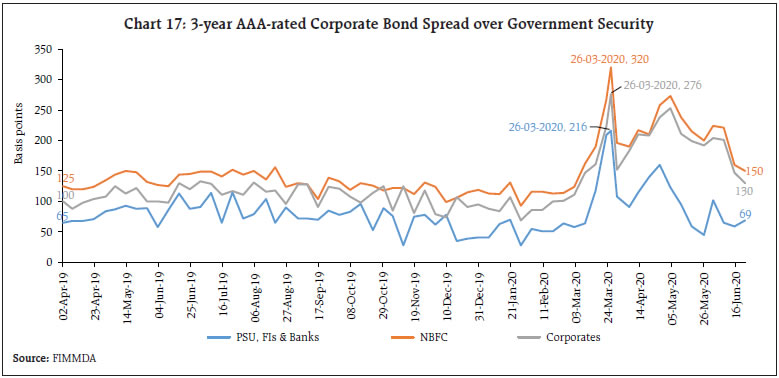 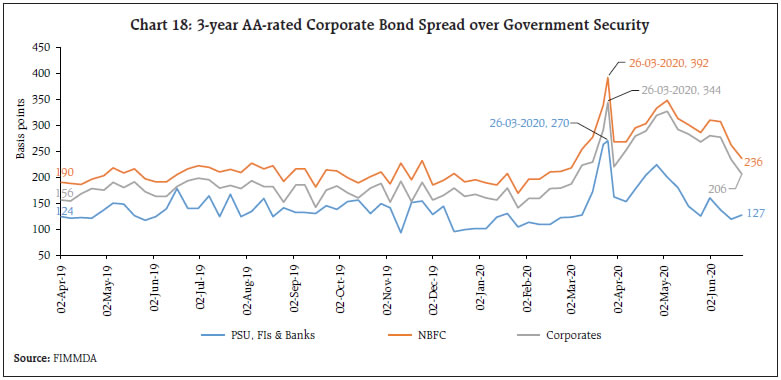 A deeper dive into the primary issuance data of corporate bonds from December 2019 till June 24, 2020 shows that the market has priced risk differently even between similar rated entities. The impact of COVID-19 is different for different sectors of the economy, which may be reflected in the coupons on primary issuances of entities belonging to different sectors. For example, an entity in the aviation industry has faced stronger headwinds than a similar rated entity in the essential commodity space (Table 2). | Table 2: Tenor-wise Coupon Range and WAR of Primary Issuances in Corporate Bonds | | Rating Category | Coupon (Per cent) | 1-year | 2-3 years | 4-6 years | 7-10 year | Above 10 year | | AAA | Min | 6.10 | 5.05 | 5.63 | 5.25 | 6.65 | | Max | 7.60 | 9.33 | 8.83 | 8.75 | 9.04 | | WAR | 7.01 | 6.64 | 7.23 | 7.51 | 7.57 | | AA | Min | 6.74 | 6.90 | 7.55 | 8.15 | 8.99 | | Max | 13.80 | 10.85 | 9.95 | 9.90 | 10.75 | | WAR | 8.38 | 8.40 | 8.66 | 8.89 | 9.04 | | A | Min | 6.60 | 8.40 | 9.55 | 8.70 | 9.75 | | Max | 9.35 | 17.18 | 12.05 | 15.50 | 13.75 | | WAR | 8.48 | 11.30 | 10.31 | 9.26 | 11.24 | | Source: Based on NSE/BSE EBP data | In March-April 2020, mutual funds (MFs) faced redemption pressure due to volatility in capital markets. The redemption pressure intensified after closure of some debt MF schemes. The Reserve Bank introduced a Special Liquidity Facility for Mutual Funds (SLF-MF) with several regulatory benefits with a view to easing liquidity pressure on MFs and preserving financial stability. The funds availed under SLF-MF were to be used by banks exclusively for meeting the liquidity requirements of MFs by (1) extending loans, and (2) undertaking outright purchase of and/or repos against the collateral of investment grade corporate bonds, CPs, debentures and CDs held by MFs. On April 30, 2020, the regulatory benefits announced under the SLF-MF scheme were extended to banks, which deployed their own resources. While easing the redemption pressure on mutual funds, these measures also helped to increase the trading volume in the secondary market for corporate bonds. The data compiled by the Reserve Bank shows that banks deployed ₹5,522 crore from their own resources under the SLF-MF scheme. This is in addition to the ₹2,430 crore availed from the Reserve Bank under the SLF-MF scheme. VI. Equity Markets Equity markets in India were buoyant at the start of 2020 with the BSE Sensex and NSE NIFTY-50 closing at their all-time highs of 41,953 and 12,362, respectively, on January 14, 2020. However, as COVID-19 cases started to rise in India, the equity markets felt the jitters and went into a sharp fall after announcement of lockdown in March, a trend which was also witnessed in other emerging markets (Chart 19). Indian equities, which had performed better than other emerging markets in January 2020 and remained aligned in February 2020, suffered a precipitous fall in March 2020. Both the Sensex and NIFTY fell by almost 23 per cent in March 2020, as compared to a fall of 16 per cent in MSCI Emerging Market Index4, with both indices posting their worst monthly fall since October 2008. However, after March 23, 2020, the market witnessed a technical bounce-back, and in the next 16 trading sessions (March 24 to April 20, 2020), it recovered by 22 per cent. On year-to-date basis, both Sensex and NIFTY have fallen by around 11 per cent as on July 07, 2020. As the market witnessed wild swings in March 2020, volatility also spiked sharply. India VIX touched 83.6 per cent on March 24, 2020, just a tad short of the highest reading of 85.1 per cent ever on record, witnessed during the GFC in 2008. However, with the recovery in the markets, Indian VIX has also receded to 25 per cent on Apr 20, 2020, not far above its long-term average of 19 per cent. The broader market indices as well as major sectoral indices moved in tandem with the benchmark indices. NSE Bank Index lost 34 per cent while NSE Financial Services Index lost 31 per cent in March 2020. These indices underperformed the benchmark indices in April and May 2020 on account of concerns relating to banks’ balance sheets after the announcement of moratorium by the Reserve Bank and stress in the financial services sector in general. However, in June 2020, both these indices have outperformed the benchmark indices (Table 3). Similar to other emerging markets, in March 2020, the Indian equity markets witnessed record net FPI outflow of ₹62,000 crore (USD 8 billion approximately) (Chart 20). This was followed by an outflow of ₹6,340 crore in April 2020. However, the measures taken by the Reserve Bank to reduce stress in the financial system, coupled with those taken by the Government to relieve the hardships of people and businesses, and to improve long-term growth prospects of the economy helped to elevate the mood in the economy in general and all financial markets in particular. As a result, May and June 2020 witnessed the return of FPIs into the equity markets. VII. Conclusion To sum-up, abundant liquidity provided through generic (LTROs) as well as targeted instruments (TLTROs), and the other policy measures announced by the Reserve Bank in the backdrop of dislocations observed in the financial markets, have brought down financing costs in the corporate bond market to decadal lows, eased the access of non-AAA rated entities, and led to record primary issuances. Yields have dropped and the spreads have compressed despite FPI outflows of around USD 3 billion from corporate bonds in 2020. COVID-19 has posed a challenge of gargantuan proportions. The halt in economic activity over several weeks has led to acute risk aversion and increased demand for precautionary liquidity by individuals, corporations and financial agents. The unprecedented uncertainty has also exposed vulnerabilities in the financial system and threatened financial stability. In these challengingly austere conditions, the Reserve Bank acted proactively and with unprecedented alacrity to ensure that financial markets remained stable and that financial stability was preserved. All the conventional and unconventional tools deployed have sought to engender conducive financial conditions and normal functioning of financial markets and institutions by providing adequate system level liquidity as well as targeted liquidity to sectors and entities experiencing liquidity constraints and/or hindrances in market access. Additionally, several measures announced by the Government of India as a part of the economic stimulus to fight the adverse effects of the pandemic, such as special liquidity facility to NBFCs, Partial Credit Guarantee Scheme (PCGS) and structural reforms have ensured that liquidity strains do not cascade into solvency problems. Several measures have been announced for Micro, Small and Medium Enterprises (MSMEs) to ensure that they are not deprived of survival funding and growth capital. As a result, markets have remained resilient, liquid and stable, establishing conditions for a finance-led recovery of the economy ahead of the revival of demand. References: Rituraj, M Jagadeesh, Abhishek Kumar and Amit Meena, “Market Financing Conditions for NBFCs: Issues and Policy Options”, Monthly Bulletin, June 2020, Reserve Bank of India, Mumbai International Monetary Fund (2020), World Economic Outlook, April 2020 Reserve Bank of India, Mumbai. Reserve Bank of India (2019), Report of the Internal Working Group to Review the Liquidity Management Framework. Reserve Bank of India (2016), Report of Working Group on Development of Corporate Bond Market in India (Chairman: Shri H R Khan)
| Annex-1 | | A chronology of important RBI announcements since the onset of COVID-19 (Contd.) | | Date of announcement | Measure | Quantum of support
(₹ crore) | Brief Description | | Feb 06, 2020 | Long term repo operations (LTROs) | 1,25,117* | Available to Scheduled Commercial Banks (SCBs) at fixed policy repo rate; no end-use restrictions. | | Cash Reserve Ratio (CRR) exemption for specific sectors | N.A. | SCBs were allowed to deduct equivalent of incremental credit disbursed by them for automobiles, residential housing and Micro, Small and Medium Enterprise (MSMEs) from their net demand and time liabilities (NDTL) for maintenance of CRR. | | Mar 20, 24 & 26, 2020 and other select dates | OMOs (incl. NDS-OM) | 1,61,499* | RBI conducted three OMO auctions on March 20, 24 and 26, 2020 for ₹40,000 crore. Further, RBI purchased GoI securities worth ₹1,21,499 crore on NDS-OM on various dates. | | Mar 23, 2020 | Term Repos | 89,517@ | Variable rate repos were undertaken to address the frictional year-end liquidity requirements caused by COVID related dislocations. All term repos have since matured. | | Mar 27, 2020 | CRR reduction and leeway in minimum daily CRR maintenance | 1,37,000 | CRR reduced by 100 basis points to 3.0 per cent of NDTL for all banks. The requirement of minimum daily CRR balance maintenance was reduced from 90 per cent to 80 per cent. | | Enhancement of Standing Liquidity Facility (SLF) for PDs | 7,200 | Liquidity available to SPDs under the SLF was temporarily enhanced from ₹2,800 crore to ₹10,000 crore. | | Policy repo rate reduced by 75 bps. | N.A. | Repo rate was reduced to 4.40 per cent from 5.15 per cent. | | Monetary Policy corridor widened | N.A. | The existing policy rate corridor was widened from 50 bps to 65 bps. The reverse repo rate under the LAF was adjusted 40 bps lower than the policy repo rate and MSF rate 25 bps above the policy repo rate. | | Targeted long term repo operations (TLTROs) | 1,00,050* | Three-year funds to be deployed in investment grade corporate bonds, CPs, and non-convertible debentures (NCDs). Up to fifty per cent of deployment in primary market and the remaining fifty per cent from the secondary market, including from mutual funds and NBFCs. | | MSF Limit Enhancement | 1,37,000 | Limit for borrowing by banks under the marginal standing facility (MSF) by dipping into the Statutory Liquidity Ratio (SLR) increased from 2 per cent to 3 per cent. | | Mar 30, 2020 | Extension of fixed-rate reverse repo and MSF windows | N.A. | To provide market participants flexibility in liquidity management, the fixed-rate reverse repo and MSF windows were made available from 09:00 hrs to 23:59 hrs as against from 17:30 hrs to 23:59 hrs earlier. |
| Annex-1 | | A chronology of important RBI announcements since the onset of COVID-19 (Concld.) | | Date of announcement | Measure | Quantum of support
(₹ crore) | Brief Description | | Apr 03, 2020 | Change in market hours | N.A. | Keeping in view the lockdown, social distancing, and restrictions on movement of people, market hours were revised from 9 AM to 5 PM to 10 AM to 2 PM. | | Apr 17, 2020 | Reduction in reverse repo rate | N.A. | Reverse repo rate under the LAF was reduced by 25 basis points from 4.0 per cent to 3.75 per cent. The policy repo rate and MSF rate remained unchanged at 4.40 per cent and 4.65 per cent respectively. | | TLTRO 2.0 | 12,850* | Three-year funds to be invested in investment grade bonds, CPs, and NCDs of NBFCs, with at least 50 per cent of the total amount availed going to small and mid-sized NBFCs and MFIs | | Refinance Facility to NABARD/SIDBI/NHB | 26,893* | To support agriculture and rural activities, MSMEs and HFCs | | Apr 23, 2020 | Special OMO
(Simultaneous Purchase and Sale) | 10,000 (purchase)
10,000 (sale) | To flatten the yield curve while being liquidity neutral | | Apr 27, 2020 | SLF-MF | 2,430* | An on-tap, open-ended repo facility for 90-day tenor at the fixed repo rate to commercial banks. Funds availed was to be used by banks exclusively for meeting the liquidity requirements of MFs. | | May 22, 2020 | Policy repo rate reduced by 40 bps. | | The policy repo rate was reduced to 4.0 per cent from 4.40 per cent. Accordingly, the MSF rate was reduced to 4.25 per cent from 4.65 per cent and the reverse repo rate was adjusted to 3.35 per cent from 3.75 per cent. | *Amount outstanding as on June 22, 2020
@Amount availed by market participants |
|