The overall financial resource balance of the economy moderated during 2018-19 as net borrowings of non-financial corporations increased and household savings slowed. The balance sheet of other depository corporations contracted as households shifted from deposits to other competing financial instruments. The financial net worth of general government and public non-financial corporations went deeper into negative territory. India remained a net borrower from the rest of the world. Introduction The financial stocks and flows (FSF) account for the Indian economy presents sectoral outstanding positions and transactions through financial instruments on a ‘from-whom-to-whom’ (FWTW) basis. The Reserve Bank of India (RBI) has been compiling and publishing the flow of funds (FoF) accounts for the Indian economy since 19641. The FSF account traces the interaction between the real and the financial sectors and the level of financial development in the economy. It also provides insights into sources and uses of financial funds and movements of sectoral financial balances. The FSF account covers five institutional sectors, in line with the UN’s System of National Accounts 2008 (SNA 2008): (i) financial corporations (FC): (ii) non-financial corporations (NFCs), public and private; (iii)general government (GG); (iv) households and non-profit institutions serving households (NPISH)2; and (v) the rest of the world (RoW) (Exhibit 1). Transactions between these sectors are classified under nine financial instruments, viz., (i) currency; (ii) deposits; (iii) debt securities; (iv) loans and borrowings; (v) equity; (vi) investment funds (such as mutual funds); (vii) insurance, pension and provident funds; (viii) monetary gold; and (ix) other accounts (including trade debt) and other liabilities/assets not elsewhere classified (NEC). The article is organised into six sections. Section II presents the international experience on compilation of financial accounts. A brief account of the sectoral financial resource gaps is given in Section III for the period 2016-17 to 2018-19, with preliminary estimates for 2019-20. Section IV discusses the sectoral mapping of the financial flows, with instrument-wise financial flows in Section V. Section VI concludes with some policy perspectives. II. International Experience In the aftermath of global financial crisis, the G20 Finance Ministers and Central Bank Governors (FMCBG) endorsed the G20 Data Gaps Initiative (DGI) in October 2009, and its second phase in 2015. This included the recommendation ‘to compile and disseminate, on a quarterly and annual frequency, sectoral accounts flows and balance sheet data, based on the internationally agreed template, including data for the other (non-bank) financial corporations sector, and develop from-whom-to-whom matrices for both transactions and stocks to support balance sheet analysis’ (IMF, 2016). Data availability on a FWTW basis varies across countries in terms of frequency and time lags (Table 1). Among EMEs, for instance, Turkey adheres to the SNA 2008 in both instrument-wise as well as sector-wise classification in both consolidated and unconsolidated formats. China does not publish financial stocks, only instrument-wise classification of the final sources and uses of each sector are presented. Countries ranging from Belgium, Canada, New Zealand, Switzerland and the UK to Colombia, Brazil and Indonesia reported complete absence of FWTW information, while France and the United States have annual and quarterly FWTW information only for some instruments. As per the survey conducted by the Organisation for Economic Co-operation and Development (OECD) for G-20 countries and its key accession partners regarding availability of sectoral data, 13 European countries and one non-European country, i.e., Australia, had FWTW data in respect of all the major eight instruments at quarterly as well as at annual frequencies. | Table 1: Financial Stocks and Flows Data for Select Countries | | Country | Data Publishing Authority | Frequency | FWTW
Metric | | United States | US Federal Reserve | Annual & Quarterly | Yes | | United Kingdom | Office for National Statistics | Annual & Quarterly | Yes | | European Union | European Central Bank | Annual & Quarterly | Yes | | Turkey | Central Bank of the Republic of Turkey in coordination with Turkstat and Ministry of Finance | Annual & Quarterly | Yes | | Russia | Central Bank of Russian Federation | Annual & Quarterly | No | | Indonesia | Statistics Indonesia | Annual & Quarterly | No | | China | People's Bank of China | Annual | No | III. Sectoral Financial Resource Gaps In India, balance sheet data required for the compilation of FSF account are released with varying lags3 by various sectors of the economy. The sector-wise financial resource position indicates that households (HHs), financial corporations and private non-financial corporations (PvNFCs) had positive financial net worth, while general government and public non-financial corporations (PuNFCs) had negative financial net worth during the period 2011-12 to 2019-20 (Table 2). Also, financial net worth has been deteriorating for both GG and PuNFCs during the period, while for PvNFCs, it stabilised after worsening during 2018-19. The financial net worth of households has however, improved during 2019-20, as per preliminary estimates. In terms of net flow of resources, non-financial corporations and general government are the major deficit sectors, while financial corporations and households (HHs) are the major surplus sectors. The overall financial resource balance of the economy - measured as net acquisition of financial assets less net incurrence of liabilities - moderated during 2018-19 primarily due to increase in net borrowings of non-financial corporations and moderation in household saving (Table 3). The marginal surplus in the overall financial resource balance in 2018-19 turned into a deficit in 2019-20 on account of the widening resource deficits of general government and public non-financial corporations. IV. Sectoral Financial Balances and Trajectories4 Analysis of financial assets and liabilities of each sector, which are mapped to other sectors, provides some interesting insights on the Indian economy. Table 2: Sectoral Financial Net Worth
(Per cent of Net National Income at current market prices) | | | 2011-12 | 2012-13 | 2013-14 | 2014-15 | 2015-16 | 2016-17 | 2017-18 | 2018-19 | 2019-20# | | Assets | | | | | | | | | | | 1 Financial Corporations | 222.7 | 225.4 | 227.1 | 229.3 | 229.9 | 228.9 | 233.3 | 233.0 | 239.4 | | 2 Non-Financial Corporations | 132.7 | 123.9 | 123.2 | 122.9 | 117.1 | 106.7 | 94.3 | 90.6 | 89.5 | | 2.a Public Non-Financial Corporations | 18.1 | 17.1 | 16.2 | 15.3 | 11.9 | 11.6 | 12.2 | 11.1 | 10.8 | | 2.b Private Non-Financial Corporations | 114.6 | 106.8 | 107.0 | 107.5 | 105.2 | 95.0 | 82.1 | 79.5 | 78.7 | | 3 General Government | 31.5 | 30.9 | 30.3 | 28.8 | 30.0 | 30.1 | 30.3 | 29.9 | 30.6 | | 4 Household Sector | 135.9 | 132.5 | 129.8 | 130.1 | 129.4 | 128.3 | 130.1 | 131.3 | 134.5 | | 5 Rest of the World | 46.0 | 48.0 | 50.1 | 50.6 | 49.7 | 45.6 | 45.2 | 40.8 | 45.8 | | Liabilities | | | | | | | | | | | 1 Financial Corporations | 189.3 | 190.8 | 192.2 | 194.1 | 194.8 | 193.2 | 197.5 | 197.2 | 204.0 | | 2 Non-Financial Corporations | 110.0 | 105.0 | 106.1 | 107.2 | 103.6 | 94.5 | 85.3 | 83.2 | 83.6 | | 2.a Public Non-Financial Corporations | 19.6 | 20.4 | 21.3 | 22.1 | 20.8 | 21.5 | 22.2 | 21.8 | 23.0 | | 2.b Private Non-Financial Corporations | 90.4 | 84.6 | 84.8 | 85.1 | 82.8 | 73.0 | 63.0 | 61.4 | 60.6 | | 3 General Government | 77.8 | 77.5 | 77.3 | 76.8 | 78.8 | 78.8 | 79.6 | 79.6 | 82.6 | | 4 Household Sector | 39.1 | 38.4 | 37.7 | 37.4 | 36.9 | 36.6 | 37.8 | 38.3 | 39.1 | | 5 Rest of the World | 23.3 | 22.4 | 23.8 | 24.5 | 24.6 | 22.3 | 22.7 | 21.8 | 25.3 | | Financial Net Worth | | | | | | | | | | | 1 Financial Corporations | 33.4 | 34.6 | 34.9 | 35.2 | 35.1 | 35.7 | 35.8 | 35.8 | 35.3 | | 2 Non-Financial Corporations | 22.6 | 18.8 | 17.2 | 15.6 | 13.5 | 12.1 | 9.1 | 7.4 | 5.9 | | 2.a Public Non-Financial Corporations | -1.5 | -3.3 | -5.0 | -6.8 | -8.9 | -9.9 | -10.0 | -10.7 | -12.2 | | 2.b Private Non-Financial Corporations | 24.2 | 22.1 | 22.2 | 22.4 | 22.4 | 22.0 | 19.1 | 18.1 | 18.1 | | 3 General Government | -46.3 | -46.6 | -47.1 | -48.0 | -48.8 | -48.7 | -49.2 | -49.7 | -52.1 | | 4 Household Sector | 96.8 | 94.1 | 92.2 | 92.7 | 92.5 | 91.6 | 92.3 | 93.0 | 95.4 | | 5 Rest of the World | 22.7 | 25.6 | 26.3 | 26.1 | 25.1 | 23.3 | 22.5 | 18.9 | 20.5 | Note: Financial net worth is calculated as the difference between outstanding assets and liabilities (excluding shareholders’ equity).
# : Preliminary estimates based on leading indicators available for respective sectors. Due to lags in availability of balance sheet data, sector-wise compilation of FWTW tables for 2019-20 is not feasible. |
Table 3: Sectoral Financial Resource Balance
(Per cent of Net National Income at current market prices) | | | 2012-13 | 2013-14 | 2014-15 | 2015-16 | 2016-17 | 2017-18 | 2018-19 | 2019-20# | | 1 Financial Corporations | 3.0 | 2.6 | 2.5 | 1.8 | 2.3 | 1.9 | 1.8 | 0.3 | | 2 Non-Financial Corporations | -8.9 | -6.4 | -5.7 | -5.2 | -3.2 | -2.3 | -4.2 | -5.0 | | 2.a Public Non-Financial Corporations | -2.8 | -2.6 | -2.8 | -3.1 | -2.5 | -2.0 | -2.2 | -3.0 | | 2.b Private Non-Financial Corporations | -6.2 | -3.8 | -2.9 | -2.1 | -0.7 | -0.4 | -2.0 | -2.0 | | 3 General Government | -5.7 | -5.8 | -5.6 | -5.4 | -5.1 | -5.4 | -5.3 | -5.7 | | 4 Household Sector | 8.4 | 8.4 | 8.0 | 9.1 | 8.4 | 8.7 | 8.2 | 8.7 | | 5 Total (1+2+3+4) | -3.3 | -1.2 | -0.8 | 0.3 | 2.4 | 2.8 | 0.5 | -1.8 | Note: Financial resource balance is calculated as the difference between the flow of net financial assets and net financial liabilities (including shareholders’ equity). Since liabilities here also include shareholders’ equity, financial resource balance will not be equal to the difference between the net worth of two consecutive years.
#: Preliminary estimates based on leading indicators available for respective sectors. Due to lags in availability of balance sheet data, sector-wise compilation of FWTW tables for 2019-20 is not feasible. | IV.1 Financial Corporations Among the financial corporations, other depository corporations (ODCs)5 constitute 52 per cent of total assets, followed by other financial corporations (OFCs)6 (38 per cent) and the central bank (10 per cent), the latter is kept separate from ODCs, in view of the responsibility for monetary policy and financial stability. Among depository institutions, scheduled commercial banks had the preponderant share of 44 per cent, highlighting the bank-based nature of the Indian economy. Within OFCs, insurance had the highest share of 11 per cent in total assets of the FC sector, followed by non-deposit taking non-banking financial companies (NBFC-ND) (7 per cent), mutual funds (6 per cent) and provident and pension funds (5 per cent) (Chart 1). IV.1.1 Central Bank The balance sheet7 size of the Reserve Bank declined moderately as a percent to GDP in 2018-19. It has, however, expanded significantly during 2019-20 owing to various measures taken by the Reserve Bank to augment system-level liquidity (Chart 2). The main liability of the Reserve Bank is currency in circulation, with around 95 per cent held by the household sector. The increase in currency in 2018-19 was much lower than in 2017-18 - the year of remonetisation, and processing and reconciliation of specified banknotes (SBNs). The second most important central bank liability is deposits, which are mostly assets of banks maintained as balances in their current accounts to meet cash reserve ratio (CRR) requirements and payment and settlement obligations (RBI, 2019a). Overall deposits of banks with the Reserve Bank declined in absolute terms for the second year in succession in 2018-19. While bankers’ deposits with the Reserve Bank increased due to higher deposit mobilisation, this was more than offset by the decline in deposits under reverse repo. On the assets side, the predominant instrument is debt securities issued by the rest of the world (RoW) and the Central Government. The Reserve Bank’s domestic investments increased by 45.4 per cent during 2018-19, on account of net purchase of government securities as part of its liquidity management operations. Loans to the other depository corporations by the Reserve Bank decreased sharply in 2018-19 from a year ago, primarily reflecting lower use of liquidity facility under repo/term repo/marginal standing facility (MSF) against government securities as collateral. IV.1.2 Other Depository Corporations (ODC) Other depository corporations, despite being the dominant sector, have experienced a declining balance sheet since 2013-14, reflecting a shift in the preferences away from deposits towards other competing financial instruments such as mutual funds and insurance (Chart 3). Within the ODC sector, scheduled commercial banks and deposit taking non-banking financial companies (NBFCs-D) exhibit complementarity in their financial intermediation roles. The consolidated balance sheet of NBFCs has been buoyed by strong credit expansion, aided by low NPA levels relative to banks and stronger capital buffers during 2016-17 and 2017-18 (RBI, 2019b). However, credit outflow from the NBFC-D moderated during 2018-19, owing to liquidity crisis triggered by Infrastructure Leasing & Financial Services Limited (IL&FS) crisis and subsequent rating downgrade faced by the NBFCs sector.
Liabilities of Other Deposit Corporations (ODCs) Household deposits are the most important instruments on the liabilities side, followed by loans from OFCs (Chart 4). The secular deceleration in deposit mobilisation which set in since 2009-10, barring the year of demonetisation, was arrested in 2018-19 due to stiff competition among banks for raising resources including through higher deposit rates. With higher deposit mobilisation, the borrowings of the ODCs sector declined (RBI, 2019b). The ODCs’ liability towards the rest of the world (RoW) contracted during 2018-19 in the wake of global economic slowdown and reversal of capital flows towards advanced economies. Assets of Other Deposit Corporations (ODCs) On the assets side, loans and advances to households and non-financial corporations remain the most important instrument, followed by investment in government securities (Chart 5). Disbursement of loans and advances, which had picked up in 2017-18 continued to maintain momentum in 2018-19. This was aided by improvement in the credit environment caused by near complete recognition of non-performing assets (NPAs), recapitalisation of public sector banks (PSBs) and the ongoing resolution process under the Insolvency and Bankruptcy Code (IBC) (RBI, 2019b). Overall financial net worth of this sector improved marginally in 2018-19 after a gap of seven years, mainly on account of improvement in the asset quality of SCBs. IV.1.3 Other Financial Corporations (OFC) In India, the balance sheet size of other financial corporation (OFC) sector constituted 38 per cent of total assets of FCs. It continued to expand in 2018-19, reflecting changing preference for financial instruments, as discussed in the previous section (Chart 6).
Post IL&FC crisis, raising resources through debentures became costlier and as investor confidence waned for non-deposit taking non-banking financial companies (NBFC-NDs), they had to take recourse to bank borrowing (RBI, 2019b). This was reflected in higher financial claims on OFCs from other depository corporations during 2018-19 (Chart 7). The assets side of their balance sheet is dominated by government debt securities, followed by loans issued to Public Non-Financial Corporations and deposits with the ODC sector (Chart 8). Bifurcation of financial flows into transactions and valuation changes8 reveals that, on an average, 26 per cent of the change in assets of OFCs sector during the period 2016-17 to 2018-19 was due to appreciation of its assets (Statement 3.1). IV.2 Non-Financial Corporations (NFCs) Non-financial Corporations, with a share of around 17 per cent of the total financial assets of the economy and comprising of Public Non-Financial Corporations and Private Non-Financial Corporations, contribute to growth of the economy through investment in productive assets. The financial net worth of the NFCs continued to decline in 2018-19 on account of a sharp fall in the financial assets of Private Non-Financial Corporations (Table 2). The persisting negative net worth of Public Non-Financial Corporations reflects the dismal performance of ailing Central Public Sector Units (CPSUs). 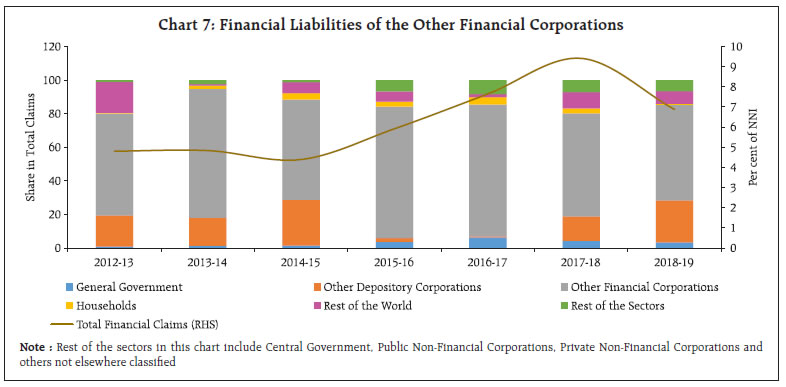 Among non-financial corporations, private units prefer equity finance (44 per cent of resources), while public units favour loans and borrowings as external finance. Equity flows to PvNFCs had turned negative during 2017-18 due to share buyback by many firms in order to avoid the dividend distribution tax. In 2018-19, they resumed largely on account of conversion of outstanding loans into equity for stressed power sector enterprises such as GMR Chhattisgarh and Resurgent Power Ventures (Chart 9).
The resource gap of private corporations widened to 2.2 per cent in 2018-19 from 0.2 per cent in 2017-18, as flows in the form of loans and borrowings recorded an uptick (Chart 10). In case of the public corporations too, the resource gap increased in 2018-19 (Chart 11). IV.3 General Government9 In India, both the central government and the state governments run deficits and are net borrowers in the economy. Liabilities of general government remained at an elevated level in 2018-19, which were dominated by debt securities constituting around 83 per cent of total liabilities in 2018-19 - two-thirds of which was subscribed by ODCs and OFCs (Statement 3.1 and Chart 12). On the assets side, equity holding in PSUs has the largest share, followed by deposits with ODCs. On an average, around 82 per cent of general government assets are held in the form of equity. Assets in the form of deposits with ODCs are more pronounced in the case of state governments, which had accumulated large cash balances, reflecting poor cash management. IV.4 Households and NPISHs Households are typically net savers and net lenders and enjoy positive financial net worth. The net financial surplus of the household sector declined to 8.2 per cent of net national income (NNI) in 2018-19 from 8.7 per cent in the previous year10, due to a larger moderation in acquisition of financial assets than in liabilities (Chart 13). Loans and borrowings from banks and other financial institutions are the primary constituent of households liabilities, while household assets are held mostly in the form of deposits, insurance and currency. Outstanding loans and borrowings by households exhibit a secular rise in recent years, gradually increasing from 32.0 per cent of GDP in 2016-17 to 33.8 per cent of GDP in 2018-19. This is in contrast to declining overall credit growth over the same period as SCBs preferred retails loans over large industrial loans due to lower NPAs in the former (RBI, 2019b).
On the asset side, deposits constitute nearly half of households’ assets, with its share in total assets remaining stable. Currency holding, which had fluctuated significantly during 2016-17 and 2017-18 due to demonetisation and subsequent re-monetisation, returned to the pre-demonetisation level during 2018-19. There has been sustained increase in acquisition of insurance, pension funds and investment in debt securities. IV.5 Rest of the World India is a net borrower from the rest of the world (RoW), with its net borrowings rising over time. The main source of funds for the RoW is through issuance of debt securities, primarily subscribed by central bank and private corporates (Chart 14). On the other hand, most of the asset of RoW are in the form of foreign direct investment and portfolio investment in equities and debt securities, lending to Indian corporates and deposits held by non-resident Indians (Chart 15). Flows under equity and debt instruments shrank during 2018-19 owing to large sell-off triggered by tighter monetary policy in the United States, and shadow of slowdown looming large. Loans and borrowings by Indian companies rose to a five-year high in 2018-19 reflecting higher interest rate in the domestic market, and increased risk aversion among domestic lenders inflicted by high non-performing assets. Net borrowing from RoW as proportion of GDP, however, narrowed down for four successive years. Overall, net borrowing from the rest of the world as a proportion to GDP declined during 2019-20. Other major trends included strong equity flows, decline in trade credit and advances and an uptick in the Reserve Bank’s subscription to debt securities issued abroad. V. Financial Flows by Instruments Loans and borrowing have the highest share of 29.0 per cent in total financial transactions, followed by debt securities and deposits with a share of 20.9 and 18.0 per cent, respectively. Loans and borrowings are largely disbursed by ODCs (67 per cent) and are largely held as liability in the balance sheet of households and PvNFCs. Some shifts have been observed in the use of instruments in financial transactions. Share of deposits is on decline despite some uptick during 2018-19. Around 99 per cent of deposits are liabilities of ODCs, 62 per cent of which are held by the households. The share of currency, which improved in 2017-18 due to remonetisation, waned in 2018-19. Debt securities – the second most important instrument in financial liabilities – declined significantly during 2018-19, owing to lower issuance of debt securities by general government and RoW. Debt securities are mostly subscribed by OFCs (42 per cent), followed by Central Bank and ODCs. The use of equity – which had declined during 2017-18 owing to share buyback by corporate sector – bounced back during 2018-19. The share of mutual funds, which has been increasing over the years, declined during 2018-19, owing to volatility in the financial market (Table 4). 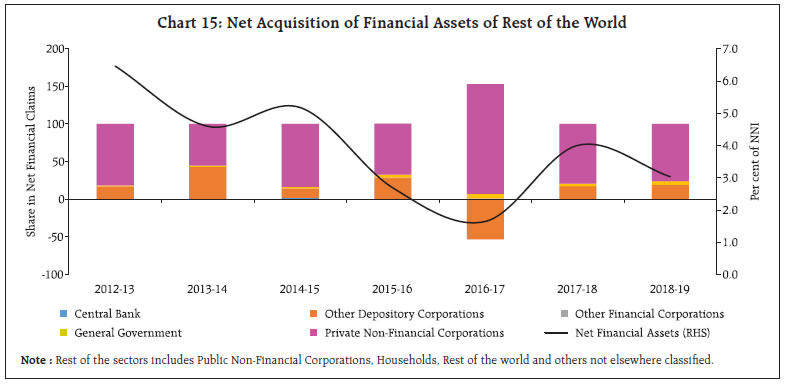
Table 4 : Financial Flows by Type of Instruments
(Share in Total Claims Issued in per cent) | | | 2012-13 | 2013-14 | 2014-15 | 2015-16 | 2016-17 | 2017-18 | 2018-19 | | Currency | 2.6 | 1.9 | 2.6 | 4.1 | -6.9 | 8.4 | 4.6 | | Deposits | 26.4 | 25.8 | 21.3 | 17.5 | 33.5 | 16.1 | 18.0 | | Debt Securities | 20.1 | 17.2 | 25.7 | 22.1 | 32.7 | 34.3 | 20.9 | | Loans and borrowing | 31.1 | 21.7 | 17.7 | 23.3 | 7.0 | 20.9 | 29.0 | | Equity | 17.0 | 13.3 | 10.8 | 12.2 | 10.6 | 2.9 | 9.9 | | Investment fund shares/ units | 1.6 | 0.9 | 1.7 | 2.4 | 7.3 | 4.3 | 1.6 | | Insurance and retirement guarantee schemes | 6.5 | 6.9 | 9.1 | 7.5 | 14.2 | 10.2 | 9.7 | | Other account receivable / payable | -5.4 | 12.4 | 10.8 | 10.7 | 0.9 | 2.1 | 5.8 | | Other items | 0.1 | 0.0 | 0.3 | 0.3 | 0.8 | 0.9 | 0.5 | VI. Conclusion The overall financial resource balance of the economy, though in marginal surplus, deteriorated during 2018-19 and with the protracted economic slowdown during 2019-20, the resource balance of the overall economy is expected to worsen further. This would imply higher overseas financial flows unless the financial surpluses of households and non-financial corporations improve and the deficit of government sector reduces. Potential growth of the economy will depend to a large extent on the strength of funding from the financial corporations. Financial net worth of the other depository corporations showed some improvement in 2018-19 backed by declining NPAs. Going forward, the credit flow from banking sector needs to improve in order to help revive the manufacturing sector and private investment in the economy. At the same time, continued strengthening of NBFC sector, post the liquidity crisis triggered by IL&FS default in September 2018, should gain momentum, which will ensure extension of liquidity to the financial periphery. The financial corporations can play a pivotal role in making the financial climate more conducive to borrowers and lenders, and thereby encourage investment. In case of non-financial corporations, the resource gap of both private and public entities widened in 2018-19 on account of larger borrowings. In 2019-20, while the private corporate sector is expected to lower its resource gap owing to reduction in capital formation, the public sector deficit is likely to increase. NFC’s balance sheet had been over-leveraged even before the onset of the pandemic. A combination of policies including subsidised credit, additional credit lines to cater to working capital needs, and tax concessions to revive capex and generate adequate cash-flow and profit could prove crucial in mitigating stress in the corporate sector’s balance sheet. Revival of balance sheets of public non-financial corporations needs special attention. The government deficit is slated to increase further mainly due to a decline in gross revenue under corporation tax, reflecting mid-year cut in tax rates. Decline in net financial surplus of households in 2018-19 had adverse implications for the rest of the sectors in terms of reduced availability of finances. Household financial savings appear to have improved in 2019-20 mainly due to increase in bank deposits and sharper decline in loans and borrowings by households, whereas their investment in insurance and mutual funds remained at the same level as in the previous year. On the road to recovery from the catastrophic economic impact of the pandemic, ensuring seamless flow of resources among all sectors will remain pivotal. Bank deposits are likely to see a spike due to increase in precautionary savings of households while lower investment demand is likely to moderate offtake of credit resulting in widening of resource gap of the other depository corporations. The role of financial intermediaries, therefore, is going to be vital in ensuring delivery of credit to sectors severely affected by the pandemic. Looking further ahead in 2020-21, the COVID-19 pandemic is also expected to induce behavioural changes such as, increase in internet-based transactions vis-à-vis cash and card-based transactions. References Aggarwal, D. K. (2017, February 24). “Buybacks hit six-year high in FY17; more companies are lining up offers”, The Economic Times. https://economictimes.indiatimes.com/markets/stocks/news/buybacks-hit-six-year-high-in-fy17-more-companies-are-lining-up-offers/articleshow/57328786.cms?from=mdr de Beer, B., Nhlapo, N., & Nhleko, Z. (2010). “A perspective on the South African flow of funds compilation–theory and analysis”. IFC Bulletin, 33, 239-48. IMF and Financial Stability Board (2016), “The Financial Crisis and Information Gaps, Second Phase of the G20 DGI-2 First Progress Report”. IMF and Financial Stability Board (2018), “The Financial Crisis and Information Gaps, Second Phase of the G20 DGI-2 Third Progress Report”. IMF and Financial Stability Board (2019), “The Financial Crisis and Information Gaps, G20 DGI-2 The Fourth Progress Report—Countdown to 2021.” Misra, Sangita, Samir Ranjan Behera, Kaushiki Singh and Saksham Sood (2020), “Provisional Accounts of Central Government Finances 2019-20: An Assessment”, RBI Bulletin, June, 2020. OECD (2017), “Understanding Financial Accounts”, Edited by Peter Van De Ven and Daniele Fano, OECD Publishing, Paris. Prakash, Anupam, Avdhesh Kumar Shukla, Anand Prakash Ekka and Kunal Priyadarshi (2018), “Quarterly Estimates of Households’ Financial Assets and Liabilities”, RBI Bulletin, March 2018. Prakash, Anupam, Avdhesh Kumar Shukla, Anand Prakash Ekka, Kunal Priyadarshi and Chaitali Bhowmick (2019), “Financial Stocks and Flows of the Indian Economy 2011-12 to 2017-18”, RBI Bulletin, July 2019. Prakash, Anupam, Anand Prakash Ekka, Kunal Priyadarshi, Chaitali Bhowmick and Ishu Thakur (2020), “Quarterly Estimates of Households’ Financial Assets and Liabilities”, RBI Bulletin, June 2020. Government of India (2018), “Report of the Committee on Financial Sector Statistics”, Central Statistical Organisation, Ministry of Statistics & Programme and Implementation, Government of India. RBI (2019a), “Annual Report 2018-19”, Reserve Bank of India. RBI (2019b), “Report on Trend and Progress of Banking in India 2018-19”, Reserve Bank of India. RBI (2017), “Annual Report 2016-17”, Reserve Bank of India. Sultana, Nasrin (2017, August 21), “Share buybacks poised to climb to a record ₹ 48,000 crore in 2017-18”, Livemint. https://www.livemint.com/Money/LAKl4VcG9hi0TSm5wUXUGO/Share-buybacks-poised-to-climb-to-a-record-Rs48000-crore-in.html Singh, Kaushiki, Saksham Sood, Kirti Gupta and Neeraj Kumar (2019), “Union Budget 2019-20: An Assessment”, RBI Bulletin, September, 2019. Tissot, B. (2016). “Development of financial sectoral accounts: New opportunities and challenges for supporting financial stability analysis”[Conference Paper]. 34th IARIW General Conference, Dresden, Germany.
|