This article analyses data on investment intentions of the private corporate sector in India during 2018-19 and 2019-20 and finds signs of improvement in the envisaged capital expenditure (capex) for the year 2019-20 based on the projects already sanctioned/contracted previously across different channels of financing. The total cost (in terms of value) of projects sanctioned/contracted through the major channels of financing can provide lead information about the near term momentum of investment activity and in the current context of weak private investment demand in the economy, this article highlights likely beginning of a turnaround in the investment cycle. Introduction Economic growth hinges on private investments. In the growth literature, investment has been regarded as one of the primary engines of growth. Investment, as a key component of GDP, can also influence labour productivity, capacity creation, introduction of new technology, employment generation, etc., and accordingly, could provide early indication about the growth outlook. Thus, for short to medium-term economic analysis and forecasting purposes, timely information on capital expenditure (capex) is vital. However, hard data on private investments from published annual accounts of companies comes with a considerable time lag and, therefore may not be very useful for short-term analysis. Thus, countries often use survey-based methods to generate information on envisaged corporate investments (Abberger, 2005; Aurizio and Stefano, 2011; Barnes and Ellis, 2005; Ferrari, 2005; Osterholm, 2013). The survey-based results offer a valuable tool for the assessment of both current investment behaviour and investment intentions that are likely to materialise in the short-term. Following international best practices, efforts have been geared towards conducting surveys in India also since the late 1980s for the assessment and forecasting of the investment intentions. Since 1970s, the Reserve Bank of India has been tracking capex plans of the private corporate sector (projects that are already funded by financial institutions) for providing an outlook on investment intentions based on the methodology adopted by Rangarajan (1970) on time phasing of capex. Such articles were published initially in the Economic and Political Weekly and subsequently (since 1989) in the RBI Bulletin. The primary source of data on investment intentions are the financiers of capex projects, viz., banking sector and financial institutions (FIs)1 as well as external commercial borrowings (ECBs)2, foreign currency convertible bonds (FCCBs), rupee denominated bonds (RDBs) and initial public offerings (IPOs), follow-on public offerings (FPOs), and rights issues for a year. This article delves into the investment intentions of the private corporate sector during 2018-19 and 2019-20 captured from their project implementation plans. The article is structured into six sections. Section II sets out the methodology and its limitations. Section III addresses the characteristics of projects sanctioned or contracted during the period of review, funding thereof, distributional aspects in terms of regions and industries. Section IV deals with the phasing profile of the sanctioned/contracted loans/ financing and estimates the growth of corporate investment. Section V presents an analysis of private placements and foreign direct investment made during the year. Section VI concludes the study. II. Methodology The short-term (one-year ahead) forecasting of capex based on time phasing of corporate projects financed by financial institutions was pioneered by Dr. C. Rangarajan in 1970. For the estimation of capex under this methodology, data on projects sanctioned are obtained from banks/FIs, supplemented with data on finances raised through other sources such as ECBs/FCCBs/IPOs/FPOs/rights issues. Based on ex ante phasing plans furnished by the companies at the time of appraisal, an estimate of the likely level of capex that would have been made during the year is obtained. In this analysis, due care has been taken to ensure that each project enters the information set only once, even if it is financed through multiple channels by using databases internal to the RBI as well as information provided by the Securities and Exchange Board of India (SEBI). Projects not financed through any of the aforementioned channels or of a size lower than ₹10 crore are not covered. Projects with private ownership below 51 per cent or undertaken by trusts, Central and State governments, and educational institutions are also excluded. The estimates are obtained based on the assumption that companies adhere to their ex ante expenditure plans. However, these estimates digress in scope and methodology from the ex post estimates of corporate fixed investment available in the National Accounts Statistics (NAS) in view of the possibility that some ex ante intentions may not fructify into realised investment in terms of their amount and timing of investment. III. Characteristics of Projects Sanctioned / Contracted During 2018-19, banks and FIs sanctioned 414 project proposals of the private companies with a total cost of ₹1,76,581 crore. There are 535 companies, which did not avail of any financing from the banks/FIs, but contracted loan amount of ₹76,515 crore through ECBs/FCCBs. Similarly, 39 companies did not avail of any bank finance or ECBs/FCCBs but raised ₹609 crore for their capex needs through domestic equity issues. Altogether, investment plans of 988 projects were made during 2018-19 aggregating to ₹2,53,705 crore as against 955 projects with investment intentions totalling ₹2,07,673 crore in 2017-18 (Annex: Table A1-A4). The size-wise distribution of the projects describes how the cost of individual projects, sanctioned in a particular span of time, are distributed. The empirical results reveal that the statistical distribution of project cost carries a heavy right-tail. The average cost of projects sanctioned in a period tends to be driven by the nature and profile of this tail reflecting the relative presence of outliers (large values). The size-wise distribution of projects showed a marginal increase in the number of mega projects (₹5,000 crore & above) from three in 2017-18 to five in 2018-19 along with an increase in their combined share in the total project cost. This partly contributed to the rise in the total project cost in 2018-19, which otherwise witnessed a decline in the total number of projects in 2018-19 vis-à-vis 2017-18. Mega projects generally run over a longer span of time, as reflected in their phasing plan, and the presence of such projects boost the total cost of projects sanctioned in a year. There were 40 large projects of size ₹1,000 crore-₹5,000 crore with a combined share of around 41 per cent in the total project cost (Box 1 and Annex: Table A5). A look at the purpose-wise pattern of projects indicates that investment in green field (new) projects occupied the largest share (76.9 per cent) in the total cost of projects sanctioned by banks and FIs during 2018-19, followed by expansion and modernisation of existing projects constituting 19.7 per cent of the total project cost, which is an increase in its share vis-à-vis 2017-18 (Annex: Table A6). Box 1: Statistical Distribution of Project Cost The aggregate cost of projects sanctioned in a particular time period is jointly influenced by the number of projects and their individual amounts. As indicated in the earlier section, projects with cost of ₹10 crore and above are only reported by the entities, and therefore, information on very small projects (of less than ₹10 crore) is not captured in the dataset. To study the profile (in terms of size), the set of all 2,112 projects sanctioned by the banks/FIs during the 5-year period (2014-15 to 2018-19) was considered. The results reveal that the statistical distribution of project cost is highly skewed (asymmetrical) with a heavy (thick) right tail having an arithmetic mean of ₹332.91 crore, which is larger than its 75th percentile. The distribution shows that around 30 per cent of the projects were of the cost ranging from ₹10 crore to less than ₹30 crore. The last 5 per cent of observations lie in the wide range of ₹1,480 crore to ₹15,000 crore, reflecting existence of low frequency and varied-sized large projects (Table B1 and Chart B1). The fitting of the distribution of the dataset of project cost identified that the 3-parameter lognormal distribution describes the dataset appropriately. The probability density function of a 3-parameter lognormal distribution is defined as: wherein, γ, μ and σ are the three parameters of the distribution. The distribution transforms to the traditional 2-parameter lognormal distribution with γ=0.
| Table B1: Descriptive Statistics of Project Cost-size | | Number of Projects | 2112 | 25th Percentile (Q1) | 24.43 | | Mean | 332.91 | Median (Q2) | 69.04 | | Standard deviation | 880.64 | 75th Percentile (Q3) | 278.72 | | Minimum | 10.00 | 95th Percentile | 1480.00 | | Maximum | 15000.00 | Skewness | 7.93 | | Range | 14990.00 | Kurtosis | 94.66 | Estimated parameters of the lognormal distribution with the estimated parameter could be useful in assessing the profile of the project cost and in computing various relevant probabilities (e.g. probability that a particular project cost will fall in a particular band). Three test statistics viz, Kolmogorov-Smirnov, Anderson-Darling and Chi-Square confirm appropriateness of the lognormal distribution in describing the nature of the distribution of cost of projects (Table B2). Further, the probability-probability (PP) plot, exhibiting a straight line at an angle of 45o, reconfirms the log-normality of the distribution of the project cost (Chart B2). Further, having identified and established the appropriateness of the said distribution, it would be desirable to estimate the parameters in order to describe subsets of this dataset, which are expected to be more homogeneous. For example, the 3-parameter lognormal distribution was fitted to two data subsets – split by location (viz., single-state and multi-states). The fitting and estimated parameters reveal differential characteristics of projects by location. The average size of the project cost in multi-state projects was larger than that of the single-state projects. However, the former are found to be less skewed and less leptokurtic (peaked). | Table B2: Estimates of Parameters and Test Statistics for Goodness of Fit | | Parameter Estimates | Test Statistics | | γ | 9.9083 | Kolmogorov-Smirnov (KS) | 0.029 | | µ | 4.1071 | Anderson-Darling (AD) | 2.799 | | σ | 1.9516 | Chi-Square | 39.665 | | Note: The Kolmogorov-Smirnov, Anderson-Darling and Chi-Square tests are used for testing goodness of fit, i.e. how well the chosen theoretical distribution fits the underlying dataset. | An analysis of the profile of infrastructure sector projects relative to non-infrastructure sector projects suggests that the share of infrastructure sector projects, led by power, roads and airports, has broadly been within the range of about 50 per cent to 70 per cent (by amount), although in terms of the number of projects share constitute about 30 per cent. The median sizes of the infrastructure and non-infrastructure projects, using the estimated lognormal distribution were computed as ₹283.87 crore and ₹40.30 crore respectively, which are comparable with the empirical data. | Table B3: Descriptive Statistics of Project Cost-size by location | | Statistics | Multi-state | Single-state | | Number of Projects | 72 | 2040 | | Mean | 1001.80 | 309.30 | | Standard deviation | 1284.20 | 853.89 | | Median | 396.22 | 65.44 | | Skewness | 2.43 | 8.61 | | Kurtosis | 10.99 | 108.82 | | Fitting of 3-parameter lognormal | | γ | 12.2740 | 9.9044 | | µ | 5.9003 | 4.0432 | | σ | 1.7007 | 1.9293 |
| Table B4: Descriptive Statistics of Project Cost-size by Infrastructure / Non-Infrastructure | | Statistics | Infrastructure | Non-Infrastructure | | Number of Projects | 661 | 1451 | | Mean | 622.14 | 201.15 | | Standard deviation | 1084.00 | 733.93 | | Median | 283.87 | 40.30 | | Skewness | 5.66 | 11.02 | | Kurtosis | 52.25 | 167.65 | | Fitting of 3-parameter lognormal | | γ | 5.3906 | 9.8992 | | µ | 5.4444 | 3.5443 | | σ | 1.5423 | 1.7773 | | Industry-wise, the infrastructure sector, comprising (i) power, (ii) telecom, (iii) ports and airports, (iv) storage and water management, (v) Special Economic Zone (SEZ), industrial, biotech and IT park, and (vi) roads and bridges, recorded a surge in its share to 58.5 per cent in 2018-19 from 51.8 per cent in 2017-18, despite significant fall in the share of its largest component, viz., ‘power sector’. ‘Ports and airports’ have witnessed a remarkable surge in aggregate cost of projects sanctioned by banks/ FIs. Out of 5 projects sanctioned in 2018-19, four were ‘new’ and one was for ‘expansion and modernisation’.
The share of ‘cement’ projects in the aggregate project cost, which rose sharply from a meagre 0.6 per cent in 2017-18 to 5.7 per cent in 2018-19, may facilitate the infrastructure sector to expand in the forthcoming years. Total project cost (and number of projects) in “cement’ industry rose markedly from ₹1,068 crore in 2017-18 to ₹10,138 crore in 2018-19 (from three to eleven projects respectively). Out of these eleven projects sanctioned in 2018-19, eight were ‘new’ and three were for ‘expansion and modernisation’. However, industry groups like ‘metal and metal products’; and ‘construction’ demonstrated lacklustre momentum in activities in 2018-19 as revealed from their significant reduction in aggregate project cost as well as number of projects and this slippage is likely to impact the growth for some time. Among other important industries, while the share of ‘mining and quarrying’ witnessed a remarkable surge, the share of ‘chemical and chemical products’ slipped. Aggregate project cost as well as the number of projects increased for ‘mining and quarrying’ with four ‘new’ projects and two other projects for ‘expansion and ‘modernisation’ (Chart 1 and Annex: Table A7).The deciding factors for the location of a project are accessibility of raw materials, availability of skilled labour, adequate infrastructure, market size, and growth prospects. Data for the last five years (2014-15 to 2018-19) revealed that 56 per cent of the projects were taken up in six states, viz., Andhra Pradesh, Gujarat, Karnataka, Maharashtra, Rajasthan and Tamil Nadu indicating their locational advantages over other states (Chart 2a).
The spread of projects encompassing more than one state has declined significantly during the quinquennial period of 2014-19 over the quinquennial period of 2009-14. This is partly due to lower share of multi-state mega projects (project cost of ₹5,000 crore and more) in total number of mega projects. Only one out of fifteen mega projects (6.67 per cent) sanctioned during 2014-19 had spread across multi-states, as against nine multi-state projects out of 63 mega projects (14.29 per cent) sanctioned during 2009-14 (Chart 2a and Chart 2b). In 2018-19, Andhra Pradesh accounted for the highest share (11.8 per cent) in total cost of projects sanctioned by banks/FIs followed by Tamil Nadu (11.5 per cent), Maharashtra (10.9 per cent), Gujarat (9.9 per cent), Telangana (8.2 per cent), Rajasthan (6.8 per cent) and Uttar Pradesh (6.2 per cent). States like Maharashtra and Karnataka registered a marked fall in their share from the previous year. On the other hand, Telangana recorded significant gains in their share followed by Tamil Nadu and Uttar Pradesh (Chart 3 and Annex: Table A8). IV. Phasing Profile of Investment Intentions The information on the phasing profile of envisaged capex from the cohorts of projects sanctioned during different years helps short-term (one year) forecasting of capex. The phasing from the cohort of projects sanctioned by the banks/FIs in 2018-19 indicates that around 35 per cent (₹62,561 crore) of the total proposed expenditure would be spent in 2018-19, 30 per cent (₹53,351 crore) in 2019-20 and another 24 per cent (₹42,281 crore) in the subsequent years. Around 11 per cent of total cost of the projects sanctioned in 2018-19 was already spent during 2015-16 to 2017-18 (Annex: Table A1). 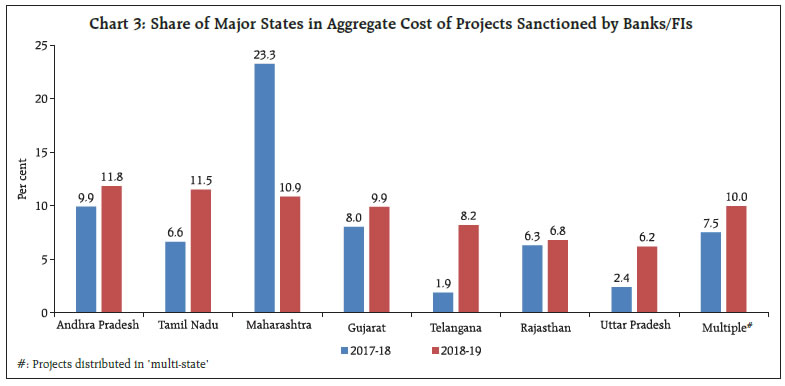 From the planned expenditure, the aggregate capex envisaged in 2018-19 showed an increase over the previous year despite a fall in the number of sanctions by banks/FIs. In 2018-19, capex planned to be incurred from resources raised through international bond markets increased sharply by around 133 per cent from its level a year ago. The capital market (equity route) enabled financing of envisaged capex of ₹1,179 crore in 2018-19, which was significantly lower than in the previous year (Annex: Table A1, A2, A3). To sum up, it is assessed that a total capex (from all channels) of ₹1,96,312 crore (of which, ₹1,11,710 crore was from fresh sanctions during the year) would have been incurred by the private corporate sector in 2018-19, translating into a substantial improvement by around 24 per cent. This improvement can be mainly attributed to ECB channel of capex financing. To add to it, the planned capex based on the pipeline projects3 (already sanctioned in preceding years) is poised to be high at around ₹1,20,157 crore in 2019-20, marking a significant improvement over the previous year (₹84,602 crore) (Annex: Table A2, A4). Going forward, the aggregate envisaged capex in 2019-20 would also be contingent upon the level of corporate investment in 2019-20 from the new cohort of projects getting sanctioned in 2019-20. The envisaged capex from the major channels of financing may further improve driven by higher amount sanctioned/contracted in the first half of 2019-20 over first half of 2018-19. The total project cost sanctioned by banks and financial institutions also increased markedly from ₹86,607 crore to ₹1,25,305 crore. Total loan amount contracted for capex purpose through the ECB channel increased significantly from ₹39,833 crore to ₹61,833 crore (Table 1). | Table 1: Projects Funded through Banks/FIs/ECBs/ FCCBs/RDBs/IPOs* | | | H1:2019-20 | H1:2018-19 | | Number of projects | Amount sanctioned/ contracted (in ₹ crore) | Number of projects | Amount sanctioned/ contracted (in ₹ crore) | | Banks/FIs | 142 | 1,25,305 | 193 | 86,607 | | ECBs/FCCBs/RDBs | 272 | 61,833 | 262 | 39,833 | | IPOs | 9 | 78 | 30 | 481 | | Total | 423 | 1,87,216 | 485 | 1,26,921 | | *Provisional data. | V. Corporate Investment Financed by Private Placements and Foreign Direct Investment In recent years, debt instruments like bonds and debentures and foreign direct investment (FDI) have assumed prominence as alternative sources of capex financing. Mobilisation of funds through private placement of debt (bonds and debentures) rose substantially during the period from 2013-14 to 2016-17 but moderated during 2017-18 and 2018-19. Preference for FDI as an alternative source of capex financing is also observed, with an upsurge in FDI amount from 2012-13 to 2016-17. Thereafter, it subsided in 2017-18 but rose again in 2018-19. The rise in FDI inflows continued in the first half of 2019-20 as compared to the corresponding period of the previous year (Table 2). | Table 2: Private Placements and FDI (in ₹ crore) | | Period | Debt-Private Placements* | Foreign Direct Investments** | | 2011-12 | 27,040 | 1,65,146 | | 2012-13 | 59,188 | 1,21,907 | | 2013-14 | 56,042 | 1,47,518 | | 2014-15 | 97,358 | 1,81,682 | | 2015-16 | 1,17,394 | 2,62,322 | | 2016-17# | 1,53,136 | 2,91,696 | | 2017-18# | 1,35,988 | 2,88,889 | | 2018-19# | 1,34,540 | 3,09,867 | | H1:2019-20# | 51,068 | 1,82,000 | | (H1:2018-19)# | (55,022) | (1,55,117) | *: Only for the manufacturing and services companies in the private sector
**: FDI inflows includes equity capital only.
#: Provisional Data.
Source: Prime Database and Government of India. | VI. Conclusion This article uses data on investment intentions of firms to assess the outlook for investment activity in 2019-20. The phasing profile of financing for projects sanctioned /contracted helps generate forward looking assessment of likely investment to be undertaken in the near term. This article demonstrates existence of heavy right tail in the distribution of project cost. It finds that a lognormal distribution could describe this positive skewness in project cost data appropriately and, therefore, could be useful in exploring future research on the subject. High value and mega projects sanctioned/ contracted during a particular year affects the phasing profile of the cohort of projects. The number of new mega projects, sanctioned by banks/FIs, has been small since 2011-12 in the aftermath of global financial crisis of 2008-09. However, it is noteworthy that projects, which were already announced and implemented prior to/around the global financial crisis, got higher financial capital from multiple sources to execute sanctioned investment plans. The planned or envisaged capex from all sources based on the pipeline projects sanctioned in all preceding years points to a noticeable improvement in 2019-20. The investment cycle appears to be poised to gain momentum in the short to medium term, but, its sustainability needs to be watched closely. References Abberger, K (2005), “The Use of Qualitative Business Tendency Surveys for Forecasting Business Investment in Germany”, ifo Working Paper No. 13, June Aurizio, L. D. and Stefano, I. (2011), “Investment Forecasting with Business Survey Data”, Working Paper Number 832, November, Bank of Italy. Barnes, S. and Ellis, C. (2005), “Indicators of short-term Movements in Business Investment”, Bank of England, Quarterly Bulletin, Spring, 30-38. Ferrari, N (2005), “Forecasting corporate investment-An indicator based on revisions in the French Investment survey”, DESE Working Paper, October. Osterholm, P. (2013), “Forecasting Business Investment in the Short Term Using Survey Data”, Working Paper, Number 131, November, National Institute of Economic Research. Rangarajan, C. (1970), “Forecasting Capital Expenditure in the Corporate Sector”, Economic and Political Weekly, December 19. Reserve Bank of India: Various data releases and other publications.
Annex | Table A1: Phasing of Capex of Projects Sanctioned by Banks/FIs | | Year of sanction ↓ | No. of Projects | Project Cost in the Year of Sanction(in ₹ crore) | Project Cost due to Revision/ Cancella- tion@(in ₹ crore) | 2010-11 | 2011-12 | 2012-13 | 2013-14 | 2014-15 | 2015-16 | 2016-17 | 2017-18 | 2018-19 | 2019-20 | Beyond 2019-20 | | 1 | 2 | 3 | 4 | 5 | 6 | 7 | 8 | 9 | 10 | 11 | 12 | 13 | 14 | | Up to | | | | | | | | | | | | | | | | 2010-11 | | | | 3,13,583 | 2,23,698 | 1,23,259 | 58,668 | 11,938 | 118 | 869 | | | | | | 2011-12 | 636 | 2,12,002 | 1,91,592 (9.6) | 23,005 | 66,915 | 55,384 | 28,190 | 9,470 | 2,926 | | | | | | | 2012-13 | 414 | 1,96,345 | 1,89,483 (3.5) | 82 | 36,664 | 56,725 | 48,976 | 27,325 | 11,219 | 6,447 | 2,045 | | | | | 2013-14 | 472 | 1,34,019 | 1,27,328 (5.0) | | 1,332 | 15,139 | 34,769 | 44,925 | 19,909 | 7,105 | 2,677 | 1,472 | | | | 2014-15 | 326 | 87,601 | 87,253 (0.4) | | | 98 | 14,822 | 34,589 | 25,765 | 9,535 | 1,246 | 162 | 1,036 | | | 2015-16 | 346 | 95,371 | 91,781 (3.8) | | | | 3,787 | 7,434 | 37,517 | 28,628 | 8,079 | 4,964 | 1,152 | 220 | | 2016-17 | 541 | 1,82,807 | 1,79,249 (2.0) | | | | 1,352 | 3,952 | 25,388 | 71,186 | 41,075 | 21,643 | 8,566 | 6,087 | | 2017-18 | 485 | 1,72,831 | 1,68,239 (2.6) | | | | | 620 | 15,184 | 12,445 | 63,001 | 41,436 | 22,767 | 12,786 | | 2018-19 | 414 | 1,76,581 | | | | | | | 569 | 6,847 | 10,972 | 62,561 | 53,351 | 42,281 | | Total# | | | | 3,36,670 | 3,28,609 | 2,50,605 | 1,90,564 | 1,40,253 | 1,38,595 | 1,43,062 | 1,29,095 | 1,32,238 | 86,872 | 61,374 | | Percentage change | | | | | -2.4 | -23.7 | -24.0 | -26.4 | -1.2 | 3.2 | -9.8 | 2.4 | * | | #: Column totals indicate envisaged capex in a particular year covering the projects which received financial assistance in various years. The estimate is ex ante, incorporating only envisaged investment. They are different from those actually realized/utilised.
*: Per cent change for 2019-20 is not worked out as capex from proposals that are likely to be sanctioned in 2019-20 is not fully available.
@: Figures in bracket are percentage of revision/cancellation. |
| Table A2: Phasing of Capex Projects* Funded Through ECBs/FCCBs/RDBs** | | Loans contracted in ↓ | No. of Companies | Total loan contracted
(in ₹ crore) | 2010-11 | 2011-12 | 2012-13 | 2013-14 | 2014-15 | 2015-16 | 2016-17 | 2017-18 | 2018-19 | 2019-20 | Beyond 2019-20 | | 1 | 2 | 3 | 4 | 5 | 6 | 7 | 8 | 9 | 10 | 11 | 12 | 13 | | Up to | | | | | | | | | | | | | | | 2010-11 | | | 31,829 | 13,130 | 2,873 | 500 | | | | | | | | | 2011-12 | 438 | 40,012 | | 25,212 | 12,800 | 1,900 | 100 | | | | | | | | 2012-13 | 519 | 65,692 | | | 37,792 | 20,267 | 6,300 | 1,333 | | | | | | | 2013-14 | 563 | 80,736 | | | | 56,197 | 20,976 | 3,563 | | | | | | | 2014-15 | 478 | 57,327 | | | | | 36,791 | 16,806 | 3,151 | 575 | 2 | 2 | | | 2015-16 | 314 | 38,885 | | | | | | 28,998 | 7,311 | 2,572 | 4 | | | | 2016-17 | 346 | 22,154 | | | | | | | 14,953 | 6,005 | 1,192 | 2 | 2 | | 2017-18 | 419 | 37,896 | | | | | | | | 17,822 | 13,054 | 6,484 | 536 | | 2018-19 | 535 | 76,515 | | | | | | | | | 48,643 | 25,706 | 2,166 | | Total& | | | 31,829 | 38,342 | 53,465 | 78,864 | 64,167 | 50,700 | 25,415 | 26,974 | 62,895 | 32,194 | 2,704 | | Percentage change | | | | 20.5 | 39.4 | 47.5 | -18.6 | -21.0 | -49.9 | 6.1 | 133.2 | # | | *: Projects which did not receive assistance from banks/FIs.
**: Rupee Denominated Bonds (RDBs) have been included since 2016-17.
#: Per cent change for 2019-20 is not worked out as capex from proposals that are likely to be drawn in 2019-20 is not fully available.
&: The estimate is ex ante, incorporating only envisaged investment, they are different from those actually realised/utilised. |
| Table A3: Phasing of Capex of Projects Funded Through Equity Issues* | | Equity issued during↓ | No. of Companies | Capex Envisaged
(₹ crore) | 2010-11 | 2011-12 | 2012-13 | 2013-14 | 2014-15 | 2015-16 | 2016-17 | 2017-18 | 2018-19 | 2019-20 | Beyond 2019-20 | | 1 | 2 | 3 | 4 | 5 | 6 | 7 | 8 | 9 | 10 | 11 | 12 | 13 | | Up to | | | | | | | | | | | | | | | 2010-11 | | | 1,923 | 726 | 95 | | | | | | | | | | 2011-12 | 21 | 973 | 153 | 460 | 360 | | | | | | | | | | 2012-13 | 25 | 1,135 | | | 533 | 494 | 108 | | | | | | | | 2013-14 | 21 | 454 | | | | | 384 | 70 | | | | | | | 2014-15 | 24 | 1,078 | | | | | 189 | 557 | 332 | | | | | | 2015-16 | 40 | 4,511 | | | | | 11 | 644 | 2,753 | 849 | 183 | 71 | | | 2016-17 | 29 | 1,159 | | | | | | 14 | 471 | 368 | 163 | 143 | | | 2017-18 | 51 | 1,538 | | | | | | | | 419 | 327 | 787 | 5 | | 2018-19 | 39 | 609 | | | | | | | | | 506 | 90 | 13 | | Total& | | | 2,076 | 1,186 | 988 | 494 | 692 | 1,285 | 3,556 | 1,636 | 1,179 | 1,091 | 18 | | Percentage change | | | | -42.9 | -16.7 | -50.0 | 40.0 | 85.7 | 176.9 | -54.0 | -27.9 | # | | * : Projects which did not receive assistance from banks/FIs/ECBs/FCCBs/RDBs.
#: Per cent change for 2019-20 is not worked out as capex from proposals that are likely to be implemented in 2019-20 is not fully available.
& : The estimate is ex ante, incorporating only envisaged investment, they are different from those actually realised/utilised. |
| Table A4: Phasing of Capex of Projects Funded Through Banks/FIs/IPOs/ECBs/FCCBs/RDBs*/IPOs | | Year of sanction ↓ | No. of Companies | Project Cost
(₹ crore) | 2010-11 | 2011-12 | 2012-13 | 2013-14 | 2014-15 | 2015-16 | 2016-17 | 2017-18 | 2018-19 | 2019-20 | Beyond 2019-20 | | Banks/ FIs, ECBs/ FCCBs/ RDBs/ IPOs | | 1 | 2 | 3 | 4 | 5 | 6 | 7 | 8 | 9 | 10 | 11 | 12 | 13 | | Upto | | | | | | | | | | | | | | | 2010-11 | | | 3,47,335 | 2,37,554 | 1,26,227 | 59,168 | 11,938 | 118 | 869 | 0 | - | - | - | | 2011-12 | 1,095 | 2,32,577 | 23,158 | 92,587 | 68,544 | 30,090 | 9,570 | 2,926 | - | - | - | - | - | | 2012-13 | 958 | 2,56,310 | 84 | 36,664 | 95,050 | 69,737 | 33,733 | 12,552 | 6,447 | 2,045 | - | - | - | | 2013-14 | 1,056 | 2,08,518 | - | 1,332 | 15,139 | 90,966 | 66,285 | 23,542 | 7,105 | 2,677 | 1,472 | - | - | | 2014-15 | 828 | 1,45,658 | - | - | 98 | 14,822 | 71,569 | 43,128 | 13,018 | 1,821 | 164 | 1,038 | - | | 2015-16 | 700 | 1,35,177 | - | - | - | 3,787 | 7,445 | 67,159 | 38,692 | 11,500 | 5,151 | 1,223 | 220 | | 2016-17 | 916 | 2,02,562 | - | - | - | 1,352 | 3,952 | 25,402 | 86,610 | 47,448 | 22,998 | 8,711 | 6,089 | | 2017-18 | 955 | 2,07,673 | - | - | - | - | 620 | 15,184 | 12,445 | 81,242 | 54,817 | 30,038 | 13,327 | | 2018-19 | 988 | 2,53,705 | - | - | - | - | - | 569 | 6,847 | 10,972 | 1,11,710 | 79,147 | 44,460 | | Total& | | | 3,70,577 | 3,68,145 | 3,05,058 | 2,69,922 | 2,05,112 | 1,90,580 | 1,71,164 | 1,57,705 | 1,96,312 | 1,20,157 | 64,096 | | Percentage change | | | | -0.7 | -17.1 | -11.5 | -24.0 | -7.1 | -10.2 | -7.9 | 24.5 | # | | *: Rupee Denominated Bonds (RDBs) have been included since 2016-17.
#: Per cent change for 2019-20 is not worked out as capex from proposals that are likely to be sanctioned in 2019-20 is not fully available.
&: The estimate is ex ante, incorporating only envisaged investment, they are different from those actually realised/utilised. |
| Table A5: Size-wise Distribution of Projects Sanctioned by Banks/FIs: 2009-10 to 2018-19 | | Period | Less than ₹100 crore | ₹100 crore to ₹500 crore | ₹500 crore to ₹1000 crore | ₹1000 crore to ₹5000 crore | ₹5000 crore & above | Total | | 2009-10 | No. of Projects | 439 | 189 | 40 | 39 | 22 | 729 | | | Per cent Share | 3.8 | 11.0 | 6.8 | 20.8 | 57.5 | 100 (4,09,502) | | 2010-11 | No. of Projects | 412 | 172 | 42 | 51 | 20 | 697 | | | Per cent Share | 4.4 | 10.2 | 8.6 | 29.3 | 47.5 | 100 (3,75,176) | | 2011-12 | No. of Projects | 420 | 145 | 36 | 26 | 9 | 636 | | | Per cent Share | 8.3 | 17.0 | 13.7 | 27.6 | 33.4 | 100 (1,91,592) | | 2012-13 | No. of Projects | 245 | 119 | 20 | 23 | 7 | 414 | | | Per cent Share | 4.8 | 14.6 | 7.3 | 26.8 | 46.4 | 100 (1,89,483) | | 2013-14 | No. of Projects | 306 | 115 | 25 | 21 | 5 | 472 | | | Per cent Share | 8.3 | 20.0 | 13.9 | 29.1 | 28.7 | 100 (1,27,328) | | 2014-15 | No. of Projects | 223 | 65 | 18 | 19 | 1 | 326 | | | Per cent Share | 9.0 | 16.6 | 14.6 | 47.8 | 12.0 | 100 (87,253) | | 2015-16 | No. of Projects | 214 | 76 | 34 | 21 | 1 | 346 | | | Per cent Share | 8.6 | 20.9 | 26.0 | 38.5 | 5.9 | 100 (91,781) | | 2016-17 | No. of Projects | 287 | 180 | 29 | 40 | 5 | 541 | | | Per cent Share | 5.8 | 23.3 | 11.9 | 41.7 | 17.4 | 100 (1,79,249) | | 2017-18 | No. of Projects | 263 | 149 | 28 | 42 | 3 | 485 | | | Per cent Share | 5.2 | 21.0 | 10.8 | 43.9 | 19.1 | 100 (1,68,239) | | 2018-19 | No. of Projects | 215 | 115 | 39 | 40 | 5 | 414 | | | Per cent Share | 4.3 | 15.8 | 15.3 | 41.1 | 23.5 | 100 (1,76,581) | Note: i. Figures in bracket are total cost of projects in ₹ crore.
ii. Per cent share is the share in total cost of projects. |
| Table A6: Purpose-wise Distribution of Projects Sanctioned by Banks/FIs: 2010-11 to 2018-19 | | Period | Number and Share of Projects | New | Expansion & Modernisation | Diversification | Others | Total | | 2010-11 | No. of Projects | 454 | 224 | 6 | 13 | 697 | | | Per cent Share | 66.8 | 30.9 | 1.8 | 0.5 | 100 (3,75,176) | | 2011-12 | No. of Projects | 449 | 172 | 5 | 10 | 636 | | | Per cent Share | 70.6 | 23.1 | 0.1 | 6.3 | 100 (1,91,592) | | 2012-13 | No. of Projects | 303 | 107 | - | 4 | 414 | | | Per cent Share | 84.2 | 14.7 | - | 1.1 | 100 (1,89,483) | | 2013-14 | No. of Projects | 361 | 95 | 2 | 14 | 472 | | | Per cent Share | 65.2 | 20.1 | - | 14.7 | 100 (1,27,328) | | 2014-15 | No. of Projects | 203 | 92 | 2 | 29 | 326 | | | Percent Share | 39.4 | 14.7 | 0.2 | 45.7 | 100 (87,253) | | 2015-16 | No. of Projects | 260 | 64 | 3 | 19 | 346 | | | Per cent Share | 73.6 | 14.3 | 0.1 | 12.0 | 100 (91,781) | | 2016-17 | No. of Projects | 429 | 97 | 4 | 11 | 541 | | | Per cent Share | 78.6 | 9.9 | 0.1 | 11.3 | 100 (1,79,249) | | 2017-18 | No. of Projects | 396 | 80 | 2 | 7 | 485 | | | Per cent Share | 89.0 | 9.4 | 0.1 | 1.5 | 100 (1,68,239) | | 2018-19 | No. of Projects | 320 | 78 | - | 16 | 414 | | | Per cent Share | 76.9 | 19.7 | - | 3.4 | 100 (1,76,581) | Note: i. Figures in bracket are total cost of projects in ₹ crore.
ii. Per cent share is the share in total cost of projects.
iii. - : Nil/ Negligible. |
| Table A7: Industry-wise Distribution of Projects Sanctioned by Banks/FIs: 2009-10 to 2018-19 | | Industry | 2009-10 | 2010-11 | 2011-12 | 2012-13 | 2013-14 | 2014-15 | 2015-16 | 2016-17 | 2017-18 | 2018-19 | | Num ber of Pro jects | Per cent Share | Num ber of Pro jects | Per cent Share | Num ber of Pro jects | Per cent Share | Num ber of Pro jects | Per cent Share | Num ber of Pro jects | Per cent Share | Num ber of Pro jects | Per cent Share | Num ber of Pro jects | Per cent Share | Num ber of Pro jects | Per cent Share | Num ber of Pro jects | Per cent Share | Num ber of Pro jects | Per cent Share | | Infrastructure | 100 | 48.9 | 121 | 53.7 | 107 | 47.4 | 82 | 47.9 | 87 | 39.8 | 74 | 48.8 | 108 | 72.0 | 204 | 62.6 | 150 | 51.8 | 125 | 58.5 | | i) Power | 75 | 30.7 | 105 | 46.3 | 82 | 42.4 | 71 | 39.4 | 70 | 35.1 | 65 | 42.2 | 92 | 57.1 | 170 | 45.4 | 117 | 36.5 | 81 | 25.1 | | ii) Telecom | 6 | 16.4 | 2 | 5.7 | 1 | 0.0 | 2 | 5.6 | 1 | 0.0 | 1 | 4.9 | 1 | 0.3 | 1 | 0.0 | - | - | - | - | | iii) Ports & Airports | 2 | 0.3 | 1 | 0.7 | 1 | 1.3 | 1 | 1.9 | 1 | 0.8 | - | - | 3 | 2.4 | 8 | 5.7 | 6 | 3.1 | 5 | 14.6 | | iv) Storage & Water Management | 2 | 0.9 | 1 | 0.0 | 12 | 0.5 | - | - | 5 | 1.1 | 2 | 0.6 | 4 | 4.2 | 6 | 3.7 | 2 | 0.4 | 15 | 5.3 | | v) SEZ, Industrial, Biotech and IT Park | 15 | 0.6 | 12 | 1.1 | 11 | 3.2 | 8 | 0.9 | 8 | 1.5 | 3 | 0.9 | 1 | 0.4 | 2 | 0.4 | 9 | 1.6 | 6 | 2.2 | | vi) Roads & Bridges | - | - | - | - | - | - | - | - | 2 | 1.2 | 3 | 0.3 | 7 | 7.6 | 17 | 7.3 | 16 | 10.1 | 18 | 11.3 | | Chemicals & Fertilizers | 28 | 0.8 | 27 | 1.3 | 17 | 3.5 | 19 | 1.1 | 15 | 1.0 | 7 | 2.6 | 11 | 1.6 | 10 | 2.1 | 23 | 11.4 | 20 | 6.6 | | Cement | 29 | 2.8 | 15 | 2.7 | 9 | 2.0 | 11 | 3.9 | 12 | 7.1 | 7 | 3.8 | 5 | 1.9 | 5 | 2.3 | 3 | 0.6 | 11 | 5.7 | | Mining & Quarrying | 9 | 3.4 | 1 | 0.2 | 4 | 0.2 | 2 | 0.1 | 1 | 0.6 | 2 | 0.1 | 10 | 2.7 | 4 | 0.4 | 1 | 0.0 | 7 | 5.0 | | Textiles | 77 | 2.2 | 77 | 2.9 | 94 | 7.0 | 31 | 1.9 | 58 | 10.3 | 50 | 4.1 | 49 | 4.8 | 57 | 4.1 | 54 | 3.7 | 29 | 4.2 | | Metal & Metal Products | 134 | 18.1 | 113 | 21.1 | 73 | 16.3 | 51 | 28.9 | 44 | 17.0 | 17 | 17.4 | 14 | 1.5 | 23 | 4.9 | 21 | 9.7 | 15 | 2.7 | | Rubber Products | 15 | 0.4 | 19 | 0.5 | 18 | 0.9 | 7 | 0.5 | 9 | 0.3 | 8 | 0.8 | 4 | 0.5 | 8 | 0.2 | 10 | 2.5 | 6 | 2.5 | | Construction | 20 | 11.5 | 18 | 3.3 | 23 | 1.8 | 20 | 2.8 | 27 | 2.1 | 29 | 4.0 | 26 | 1.8 | 60 | 12.0 | 39 | 5.3 | 28 | 2.5 | | Hospitals | 23 | 0.9 | 22 | 0.6 | 9 | 0.3 | 17 | 1.4 | 10 | 0.7 | 2 | 0.1 | 1 | 0.0 | 22 | 1.1 | 18 | 1.8 | 15 | 2.3 | | Hotel & Restaurants | 56 | 2.6 | 63 | 3.5 | 51 | 4.6 | 31 | 3.1 | 29 | 2.7 | 15 | 1.1 | 16 | 1.1 | 12 | 0.8 | 29 | 2.9 | 28 | 1.7 | | Pharmaceuticals | 31 | 0.5 | 18 | 0.3 | 20 | 0.8 | 10 | 0.4 | 19 | 1.3 | 9 | 1.5 | 11 | 0.3 | 12 | 1.1 | 15 | 0.6 | 23 | 1.5 | | Food Products | 41 | 0.5 | 39 | 0.7 | 41 | 1.5 | 36 | 0.9 | 43 | 1.8 | 34 | 2.9 | 26 | 1.8 | 38 | 0.9 | 47 | 2.8 | 28 | 1.3 | | Other Services | 2 | 0.0 | 3 | 0.1 | 4 | 0.1 | 2 | 0.1 | 8 | 0.8 | 2 | 0.1 | - | - | 3 | 0.1 | - | - | 11 | 1.2 | | Other Manufacturing | 18 | 0.5 | 22 | 0.2 | 22 | 0.4 | 8 | 0.1 | 15 | 0.7 | 7 | 0.1 | 9 | 1.4 | 7 | 0.2 | 9 | 0.7 | 20 | 0.7 | | Transport Equipment | 25 | 1.3 | 27 | 0.8 | 26 | 2.6 | 17 | 0.9 | 16 | 1.2 | 7 | 5.3 | 4 | 2.5 | 9 | 3.6 | 10 | 0.3 | 5 | 0.7 | | Others* | 121 | 5.6 | 112 | 8.2 | 118 | 10.5 | 70 | 5.7 | 79 | 12.6 | 56 | 7.3 | 52 | 6.0 | 67 | 3.6 | 56 | 5.9 | 43 | 3.0 | | Total | 729 | 100 | 697 | 100 | 636 | 100 | 414 | 100 | 472 | 100 | 326 | 100 | 346 | 100 | 541 | 100 | 485 | 100 | 414 | 100 | | Total cost of projects (₹ crore) | 4,09,502 | 3,75,176 | 1,91,592 | 1,89,483 | 1,27,328 | 87,253 | 91,781 | 1,79,249 | 1,68,239 | 1,76,581 | * : Comprise industries like Agricultural & related activities, Paper & Paper products, Printing & Publishing, Rubber, IT Software, Communication, Trading of services, Entertainments, etc.
- : Nil/Negligible.
Note: Per cent share is the share in total cost of project. |
| Table A8: State-wise Distribution of Projects Sanctioned by Banks/FIs: 2009-10 to 2018-19 | | State | 2009-10 | 2010-11 | 2011-12 | 2012-13 | 2013-14 | 2014-15 | 2015-16 | 2016-17 | 2017-18 | 2018-19 | | Num ber of Pro jects | Per cent Share | Num ber of Pro jects | Per cent Share | Num ber of Pro jects | Per cent Share | Num ber of Pro jects | Per cent Share | Num ber of Pro jects | Per cent Share | Num ber of Pro jects | Per cent Share | Num ber of Pro jects | Per cent Share | Num ber of Pro jects | Per cent Share | Num ber of Pro jects | Per cent Share | Num ber of Pro jects | Per cent Share | | Andhra Pradesh | 73 | 7.1 | 65 | 11.4 | 52 | 5.1 | 35 | 5.7 | 37 | 4.0 | 24 | 8.1 | 33 | 12.3 | 47 | 8.0 | 22 | 9.9 | 29 | 11.8 | | Tamil Nadu | 66 | 5.5 | 93 | 6.1 | 58 | 5.7 | 22 | 1.8 | 33 | 5.4 | 27 | 2.9 | 26 | 9.3 | 22 | 4.4 | 28 | 6.6 | 33 | 11.5 | | Maharashtra | 117 | 10.0 | 71 | 7.4 | 86 | 19.1 | 67 | 10.7 | 76 | 19.7 | 38 | 14.8 | 36 | 9.4 | 57 | 8.8 | 65 | 23.3 | 37 | 10.9 | | Gujarat | 69 | 3.2 | 65 | 9.6 | 75 | 9.0 | 58 | 5.6 | 66 | 14.5 | 71 | 9.5 | 61 | 15.1 | 102 | 23.0 | 71 | 8.0 | 55 | 9.9 | | Telangana | - | - | - | - | - | - | - | - | - | - | - | - | 10 | 3.8 | 52 | 6.8 | 17 | 1.9 | 25 | 8.2 | | Rajasthan | 23 | 2.9 | 28 | 0.8 | 49 | 4.9 | 41 | 5.3 | 24 | 1.4 | 29 | 11.1 | 10 | 0.9 | 23 | 2.8 | 33 | 6.3 | 20 | 6.8 | | Uttar Pradesh | 27 | 0.4 | 32 | 4.6 | 42 | 7.8 | 26 | 4.4 | 21 | 1.1 | 20 | 5.4 | 15 | 2.3 | 22 | 3.7 | 30 | 2.4 | 29 | 6.2 | | Karnataka | 42 | 1.4 | 40 | 7.2 | 39 | 12.0 | 20 | 1.6 | 39 | 6.2 | 27 | 5.4 | 21 | 6.2 | 52 | 6.8 | 64 | 9.6 | 33 | 4.7 | | Punjab | 23 | 0.4 | 38 | 1.1 | 37 | 1.7 | 12 | 10.9 | 28 | 1.5 | 6 | 0.3 | 11 | 1.7 | 29 | 2.1 | 31 | 2.2 | 14 | 1.8 | | West Bengal | 33 | 2.6 | 29 | 3.3 | 19 | 4.9 | 13 | 1.0 | 12 | 1.2 | 9 | 1.3 | 14 | 3.1 | 18 | 1.7 | 14 | 1.8 | 15 | 1.6 | | Madhya Pradesh | 23 | 4.2 | 21 | 5.2 | 16 | 5.6 | 13 | 3.9 | 30 | 6.1 | 14 | 3.9 | 21 | 6.9 | 18 | 7.5 | 10 | 0.7 | 11 | 1.4 | | Odisha | 25 | 13.9 | 25 | 7.4 | 15 | 6.3 | 10 | 26.8 | 10 | 11.7 | 5 | 15.9 | 6 | 3.1 | 6 | 3.1 | 5 | 3.0 | 9 | 1.3 | | Chhatisgarh | 23 | 6.0 | 31 | 12.1 | 11 | 2.4 | 9 | 4.1 | 16 | 10.7 | 8 | 7.4 | 8 | 4.7 | 15 | 4.0 | 7 | 4.8 | 5 | 0.8 | | Jammu & Kashmir | 2 | 0.1 | 3 | 0.1 | 5 | 0.2 | 10 | 0.2 | 10 | 5.2 | 2 | 0.1 | 9 | 0.2 | 3 | 0.1 | 8 | 2.0 | 12 | 0.4 | | Himachal Pradesh | 19 | 0.6 | 13 | 0.8 | 7 | 0.5 | 5 | 0.3 | 3 | 1.8 | 3 | 0.1 | 8 | 1.4 | 1 | 0.0 | 8 | 2.3 | 7 | 0.3 | | Multiple# | 45 | 29.0 | 48 | 16.2 | 34 | 4.5 | 15 | 7.7 | 21 | 6.9 | 10 | 9.5 | 13 | 13.5 | 17 | 11.8 | 16 | 7.5 | 16 | 10.0 | | Others* | 119 | 12.7 | 95 | 6.7 | 91 | 10.3 | 58 | 10.0 | 46 | 2.6 | 33 | 4.3 | 44 | 6.1 | 57 | 5.4 | 56 | 7.7 | 64 | 12.4 | | Total | 729 | 100 | 697 | 100 | 636 | 100 | 414 | 100 | 472 | 100 | 326 | 100 | 346 | 100 | 541 | 100 | 485 | 100 | 414 | 100 | | Total cost of projects (₹ crore) | 4,09,502 | 3,75,176 | 1,91,592 | 1,89,483 | 1,27,328 | 87,253 | 91,781 | 1,79,249 | 1,68,239 | 1,76,581 | #: Comprise projects over several States.
*: Comprise remaining States / Union Territories.
‘ -’ information not available.
Note: Per cent share is the share in total cost of project. |
|