Using data on credit ratings from the Central Repository of Information on Large Credits (CRILC) mapped with Prowess, this article examines the efficacy of ratings in facilitating a sound and timely assessment of the asset quality of large borrowers. About one-fourth of the sampled Non-Performing Asset (NPA) exposure from CRILC was found to be in investment grade a quarter before slipping into the NPA category. The percentage of NPA exposure with an investment grade rating just before turning non-performing varied across Credit Rating Agencies (CRAs) with three out of the six CRAs covered in the study showing a relatively high concentration of such exposure. Introduction Credit rating agencies are important stakeholders in the implementation of the modern-day financial sector regulatory framework. Agency/external ratings were prescribed as part of the Basel II regulatory framework for assessing the riskiness of various assets and to estimate the corresponding capital requirements for banks. Given its risk-sensitive approach, the Basel II framework was considered as an advancement over the 1988 Basel Accord (often known as the Basel I framework) that followed a simplistic method for capital computation unrelated to the default risks underlying various types of assets (Roy, 2005). Although the role of CRAs, particularly their inability to factor in the impending risks, came under criticism during the global financial crisis of 2008, agency ratings continued to be an integral part of the Basel III framework that evolved as a regulatory response to the crisis (Sinclair, 2010).1 The Standardised approach for credit risk under both Basel II and Basel III frameworks involves the use of agency ratings. Under these frameworks, the Standardised approach is described as a base-level approach; banks are expected to move to the Internal Ratings-based (IRB) approach over time modelling the capital requirements based on their internal ratings assigned to various assets. On account of a growing critique of the internally modelled approaches, however, the Basel Committee on Banking Supervision (BCBS) has recently revisited the Basel III framework and proposed certain restrictions on the use of the IRB approach and, in fact, strengthened the Standardised approach in terms of its granularity and risk sensitivity (BCBS, 2017).2 Following the proposed reforms, the role of agency ratings in the regulatory framework stands reaffirmed.3 At present, most banks around the world, including Scheduled Commercial Banks (SCBs) in India, use the Standardised approach (ibid.). While there are numerous studies on the IRB approach, there is limited discussion on the Standardised approach (Roy, 2005). Some of the available studies on CRAs analyse the differences in their ratings mainly on account of the differences in their methodologies (Ederington, 1986). The likelihood of rating shopping and self-selection by issuers is also suggested in the literature (Beattie and Searle, 1992 and Cantor and Packer, 1997). In the Indian context, while there is widespread anecdotal evidence on the operations of CRAs, systematic studies on this issue are few. One of the notable studies concerning CRAs, show that the cumulative default rates (CDRs) for the accredited CRAs in India are much higher than those prescribed under the Basel framework. As a result, the possibility of undercapitalisation in banks cannot be denied given the application of the same risk weights as prescribed by the BCBS (Choudhary et al., 2017). There is also some evidence on the inability of CRAs to provide timely guidance on the weakening creditworthiness of borrowers (NISM, 2009 in Choudhary et al., 2017). The present article contributes to the literature by analysing the efficacy of agency ratings in India in assessing the asset quality of large borrowers, particularly from the banking supervisor’s perspective. The supervisor, driven by the long-term goal of preserving the health of the banking system, is interested in an accurate and timely assessment of creditworthiness of borrowers/issuers enabling a reasonably sound appraisal of capital adequacy in banks. By contrast, CRAs may be interested in the short-term goals relating to business expansion, while keeping lower CDRs for their portfolios. Banks too may be driven by the short-term goal of preserving capital for enhanced asset growth.4 There is an evident conflict between the principal, i.e., the supervisor, and the two agents, i.e., CRAs and banks, and this conflict reflects in the ratings assigned by CRAs and the ratings used by banks in their capital computation. The article addresses the following questions that bring out this conflict: 1. Are external credit ratings reflective of the asset quality of large borrowers? a. To what extent can ratings reflect the NPA status of a borrower in a timely manner and whether there are divergences across CRAs in this assessment? b. How quick is the downgrade for a borrower after the borrower has become an NPA? 2. What is the extent of divergence between the ratings assigned by rating agencies and those reported by banks for a given borrower? II. Data Sources and Methodology The key data source for this article is the CRILC set up by the Reserve Bank in 2014 for collection of data on “large borrowers” (having funded and non-funded exposure of Rs. 50 million and above). The external credit ratings in CRILC are borrower-specific ratings. Following the BCBS guidance, in case of two differential ratings on the same borrower, the bank is expected to report the conservative rating of the two. CRILC uses the Permanent Account Number (PAN) as the unique identifier for borrowers. From April 2018 onwards, Corporate Identification Number (CIN) is also being reported in CRILC. The article is based on a sample of NPAs as at end-March 2018 (Table 1). Of the sample of non-performing borrowers, the unique rated borrowers on whom CIN is received and validated have been selected for the study, and matched with the borrowers reported in Prowess - an alternative external source of data on corporate credit ratings (Table 2).5 The sample for the article, thus, works out to 560 borrowers accounting for about 21 per cent of NPA borrowers and as high as 40 per cent of the total amount of NPAs as at end-March 2018. Given that the article traces the history of these NPA borrowers, it is not quarter-specific in nature but encapsulates the behaviour of large borrowers across quarters. Table 1: Population Size of NPAs
(As at end-March 2018) | | Item | Total | Rated | Unrated | | Unique borrowers | 7,147 | 2,625 | 5,172 | | | | (37 %) | (72 %) | | Bank-borrower cases | 10,931 | 4,504 | 6,427 | | | | (41 %) | (59 %) | | Amount (Rs. trillion) | 8.85 | 5.27 | 3.58 | | | | (60 %) | (40 %) | Notes: 1. Figures in brackets indicate percentage share in total.
2. As a borrower reported in CRILC can be exposed to more than one bank, a distinction has been made here between unique borrowers (each borrower counted only once) and bank-borrower cases (counted depending on the borrower’s banking relationships).
3. The sum of the proportions for unique borrowers may not add up to 100 since the same borrower may be reported as rated by one bank and unrated by another bank.
Source: CRILC |
| Table 2: Sample From the Total Rated NPAs Reported in CRILC | | Item | Total rated NPAs | NPAs with unique CIN having ratings from the reported CRA in Prowess | | Unique borrowers | 2,625 | 560 | | | | (21%) | | Bank-borrower cases | 4,504 | 1,274 | | | | (28%) | | Amount (Rs. trillion) | 5.27 | 2.13 | | | | (40%) | Notes: 1. Numbers in brackets indicate per cent of total.
2. Reported CRA implies those cases for which rating information is available in Prowess from the same CRA as reported in CRILC. | NPA status of a borrower is purposively taken as the starting point in the study, as (a) it provides the worst possible asset classification with a 90-day window to the borrower since the date of default unlike the Special Mention Account (SMA) categories;6 and (b) generally, there is little or no upward transition from the NPA category among large borrowers.7 The article’s methodology is illustrated in Chart 1 (with a detailed discussion in Annexure 1). III. Major Findings III.1 Ability of ratings to reflect asset quality The article brings out deficiencies in the ability of ratings to capture the asset quality of large borrowers. About 24 per cent of the sampled NPA exposure from CRILC carried an investment grade rating just a quarter before becoming non-performing (Table 3). As the share was derived from CRILC alone, it can be argued that the deficiencies could be due to either the ways in which ratings are assigned by CRAs or the ways in which ratings are reported by banks or both. By mapping CRILC with Prowess, it was observed that about 14 per cent of the sampled NPA exposure showed a sub-investment grade in Prowess but carried an investment grade in CRILC, indicating concerns about delayed/lagged reporting of ratings by banks in CRILC (a detailed discussion follows in III.3). Notably, about 12 per cent of the NPA exposure in CRILC was in investment grade even as per Prowess a quarter before becoming NPA, indicating the limited efficacy also of the ratings assigned by CRAs (Table 3).8  III.2 Comparison of the performance of various CRAs There was a divergence in the rating performance of various CRAs. Based on a comparison of the accredited CRAs, as reported in Prowess, it was observed that the concerns about ratings being reflective of the asset quality were more acute for some CRAs (Table 4).9 For three CRAs, the share of the sampled NPA exposure that was in the investment grade a quarter before turning non-performing was above 20 per cent. For two CRAs among these, a large portion of the NPA exposure was concentrated in the cross-over categories (BBB/BB) (Annexure 2). By contrast, for the remaining CRAs, a major concentration of the exposure was in lowest possible grades (C/D categories). The divergence across CRAs, thus, appeared even starker when the exposure was further divided into various investment and sub-investment grade rating categories. | Table 3: Distribution of NPA amount as at end-March 2018 | | (per cent) | | | RPro, Reported | Total | | Investment grade | Sub-investment grade | | RCRILC | Investment grade | 10.6 | 13.9 | 24.4 | | Sub-investment grade | 1.5 | 74.1 | 75.6 | | Total | 12.0 | 88.0 | 100.0 | | Source: Calculated from CRILC and Prowess. |
| Table 4: Distribution of NPA amount as at end-March 2018 by reported CRA and RPro, Reported | | (per cent) | | CRAs | RPro, Reported | Total | | Investment grade | Sub-investment grade | | CRA1 | 26 | 74 | 100 | | CRA2 | 9 | 91 | 100 | | CRA3 | 14 | 86 | 100 | | CRA4 | 22 | 78 | 100 | | CRA5 | 5 | 95 | 100 | | CRA6 | 47 | 53 | 100 | | All CRAs | 12 | 88 | 100 | | Source: Calculated from Prowess | III.3 Divergence between ratings given by CRAs and those reported by banks As discussed earlier, there was a divergence between the ratings of CRAs as reported in Prowess and those reported by banks in CRILC. One of the possible reasons for the divergence could be because banks reported the ratings corresponding to only those facilities of a borrower to which they were exposed. However, most of the exposures showing divergence had reached the C/D categories as per Prowess (Annexure 3). Since ratings given by the same CRA for different facilities of a borrower are generally expected to move in tandem, as they are essentially based on the borrower’s repayment capacity, the divergence in ratings could be on account of reporting issues on the part of banks. First, the possibility of random reporting errors by banks seemed limited. This was because as against 14 per cent of exposure classified under investment grade in CRILC when it was in sub-investment grade in Prowess, only about 2 per cent of the exposure was under sub-investment grade in CRILC when it carried an investment grade in Prowess (Table 3). The second possibility was of a delayed reporting by banks. As already noted, there was a convergence between the reporting in Prowess and CRILC with regard to about 74 per cent of the NPA exposure (reported under sub-investment grade in both), there was a divergence with regard to 14 per cent of the exposure, where CRILC showed a higher rating than in Prowess (Table 3). To ascertain the case of delayed reporting, borrowers with sub-investment grade as per Prowess one quarter before the NPA date (accounting for 88 per cent of NPA exposure as in Table 3) were traced backwards to the point when at least one of their facilities was in investment grade.10 The rating gradewas denoted as RPro, Max. It was observed that borrowers accounting for 71 per cent of the NPA exposure had at least one facility in the investment grade at some point in the past (Table 5). Borrowers corresponding to the remaining 17 per cent of the NPA exposure never had any facility in the investment grade. The possibility of delayed reporting was only for the former category of borrowers. In order to explore further, the date when all facilities of such borrowers slipped into the sub-investment category was identified and the average time from this date to the NPA date was worked out (denoted as Avg LagSub.Inv.Gr–NPA). For borrowers who were reported in the sub-investment grade in CRILC similar to that in Prowess (accounting for 58 per cent of the NPA exposure as in Table 5), Avg LagSub.Inv.Gr–NPA was estimated to be 29 months (Table 6). In comparison, for borrowers who were reported by banks under the investment grade in CRILC but were reported under the sub-investment grade in Prowess (accounting for about 13 per cent of the NPA exposure in Table 5), the lag was much lower, at 12 months, indicating that ratings reported by banks did not adequately reflect the recent rating changes. | Table 5: Distribution of NPA amount (as at end-March 2018) with respect to the best available rating | | (per cent) | | | RPro, Max | Total | | Investment grade | Sub-investment grade | | RCRILC | Investment grade | 12.8 | 1.0 | 13.9 | | Sub-investment grade | 58.4 | 15.7 | 74.1 | | Total | 71.3 | 16.7 | 88.0 | | Source: Calculated from CRILC and Prowess. |
| Table 6: Average Gap (in Months) | | | Avg LagSub.Inv.Gr–NPA | | RCRILC | Investment grade | 12 | | Sub-investment grade | 29 | | Total | 25 | | Source: Calculated from CRILC and Prowess. | III.4 Ability of ratings to reflect asset quality in a timely manner In order to gauge how early the ratings provided signals about the deteriorating asset quality, the average lead time in downgrading borrowers before becoming NPAs was analysed. As can be derived from Tables 3 and 5, borrowers corresponding to about 83 per cent of the NPA exposure had an investment rating at some point prior to becoming an NPA (arrived at by adding 71.3 per cent from Table 5 and 12.0 per cent from Table 3). Out of these, for borrowers corresponding to 71 per cent of NPA exposure, the indication of deteriorating asset quality (when all facilities of a borrower slipped into the sub-investment grade) was available, on an average, 25 months prior to the NPA date (Chart 2). The borrowers corresponding to the remaining 12 per cent exposure had an investment rating (for all their facilities) even 11 months prior to the NPA date. For such borrowers, the average time taken for a complete downgrade (with all facilities in the sub-investment grade) after NPA was about five months.11 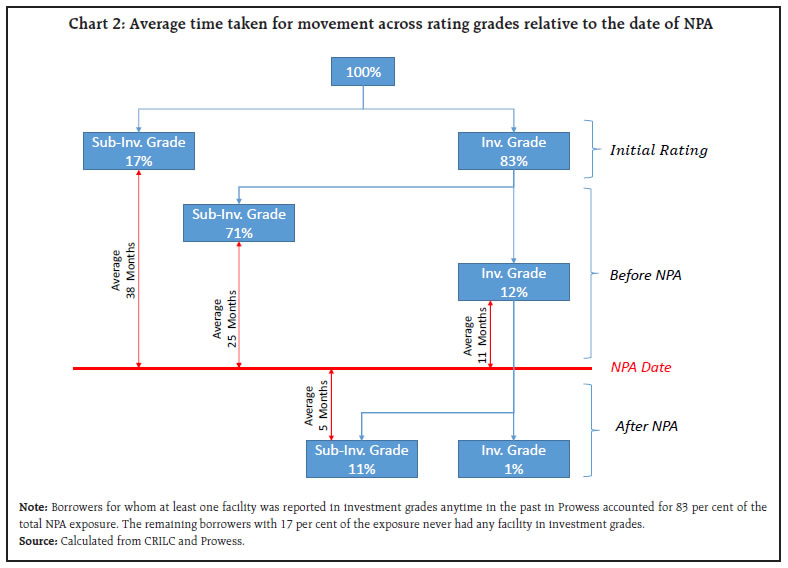 IV. Conclusions The article is based on the ratings distribution of non-performing borrowers prepared by mapping the ratings reported in CRILC with those in Prowess. Although preliminary, the findings suggest: (a) ratings do not always reflect the asset quality of borrowers in a timely manner; (b) there are concerns about the delayed reporting of ratings by banks; (c) the ability of ratings to capture the asset quality varies across rating agencies. While the use of agency ratings under the extant regulatory framework is inevitable, the ways to encourage CRAs to better their rating performance need to be explored.12 References: Balin, B. (2010), “Basel I, Basel II, and Emerging Markets: A Nontechnical Analysis”, Working Paper, Accessed from SSRN 1477712, 2008. BCBS (2017), “High-level Summary of Basel III Reforms”, BIS. Beattie, V. and S. Searle (1992), “Bond Ratings and Inter-Rater Agreement: A Cross-Sectional Analysis”, Journal of International Securities Markets, 6 (2). Cantor, R. and F. Packer (1997), “Differences of Opinion in the Credit Rating Industry”, Journal of Banking and Finance, 21(10). Choudhary A. K., B. Nethaji and A. Basu (2017): “Risk-weighting under Standardised Approach of Computation of Capital for Credit Risk in Basel Framework – An Analysis of Default Experience of Credit Rating Agencies in India”, Reserve Bank Working Paper 06/2017. Ederington, L.H. (1986), “Why Split Ratings Occur?”, Financial Management, 15 (1). Study Report (2009), “Assessment of Long Term Performance of Credit Rating Agencies in India”, National Institute of Securities Markets. Gopalan, R., Y. Gopalan, and K. Koharki, (2016), “Market Information and Rating Agency Catering”, CAFRAL Working Paper. Roy, P. V. (2005), “Credit Ratings and the Standardised Approach to Credit Risk in Basel III”, ECB working paper 517/August 2005. Sinclair, T. J. (2010), “Credit Rating Agencies and the Global Financial Crisis”, economic sociology_the european electronic newsletter, ISSN 1871-3351, Max Planck Institute for the Study of Societies (MPIfG), Cologne, Vol. 12, Iss. 1, pp. 4-9
Annexures: Annexure 1: Details on the methodology Data for the article were analysed in the following manner: 1. As the starting point, NPA borrowers at end-March 2018 for whom CINs were reported in CRILC were culled out. Validating the CINs with the Ministry of Corporate Affairs (MCA) database, a further pruning was done to include only the borrowers with valid CINs and on whom information was available in Prowess. 2. The ratings distribution for the pruned list of NPA borrowers was obtained from CRILC. Ratings just prior to the NPA classification were obtained from CRILC. Here, the date of NPA classification was the first date when the borrower was reported in the NPA category in the reporting bank.13 The rating from CRILC was taken as the rating reported in the quarter preceding the date of NPA. 3. Similarly, the latest lowest rating before the quarter preceding the date of NPA from Prowess for the CRA (as reported in CRILC) was selected. As Prowess provides ratings by facilities, the lowest rating across facilities of a borrower by the reported CRA was selected for consistency with reporting in CRILC. 4. Since, Prowess contains ratings for both short-term and long-term facilities, the ratings were mapped to a common scale as used in CRILC for comparability. | Annexure 2: Distribution of amount of NPAs as at end-March 2018 | | (per cent) | | | RPro, Reported | Total | | AAA | AA | A | BBB | BB | B | C | D | | CRA reported in CRILC | CRA1 | - | - | 13.1 | 12.4 | 17.3 | 1.9 | 44.7 | 10.6 | 100.0 | | CRA2 | - | - | 0.8 | 7.9 | 7.0 | 1.8 | 19.8 | 62.7 | 100.0 | | CRA3 | - | - | 3.8 | 10.4 | 0.9 | 2.4 | 15.2 | 67.4 | 100.0 | | CRA4 | - | - | 5.2 | 16.6 | 3.0 | 0.2 | 12.3 | 62.8 | 100.0 | | CRA5 | - | - | 0.0 | 4.7 | 1.1 | 0.6 | 8.2 | 85.5 | 100.0 | | CRA6 | - | - | 13.5 | 33.8 | 19.0 | 3.8 | 6.7 | 23.1 | 100.0 | | Total | - | - | 2.8 | 9.2 | 6.9 | 1.6 | 20.4 | 59.1 | 100.0 | Source: Calculated from CRILC and Prowess
- Nil/negligible |
| Annexure 3: Distribution of amount of NPAs as at end-March 2018 | | (per cent) | | | RPro, Reported | Total | | AAA | AA | A | BBB | BB | B | C | D | | RCRILC | AAA | - | - | 0.2 | 0.1 | - | - | 0.2 | 1.9 | 2.3 | | AA | - | - | 0.1 | 0.2 | - | - | 0.1 | 0.3 | 0.7 | | A | - | - | 2.3 | 0.4 | 0.4 | - | 0.7 | 2.4 | 6.1 | | BBB | - | - | 0.2 | 7.1 | 0.5 | - | 1.9 | 5.6 | 15.3 | | BB | - | - | 0.1 | 1.2 | 5.7 | 0.4 | 12.8 | 6.4 | 26.6 | | B | - | - | - | 0.2 | 0.1 | 1.1 | 1.9 | 3.0 | 6.3 | | C | - | - | - | - | - | - | 1.4 | 0.7 | 2.1 | | D | - | - | - | - | 0.2 | 0.1 | 1.5 | 38.9 | 40.6 | | Total | - | - | - | 9.2 | 6.9 | 1.6 | 20.4 | 59.1 | 100.0 | Source: Calculated from CRILC and Prowess
- Nil/negligible |
|