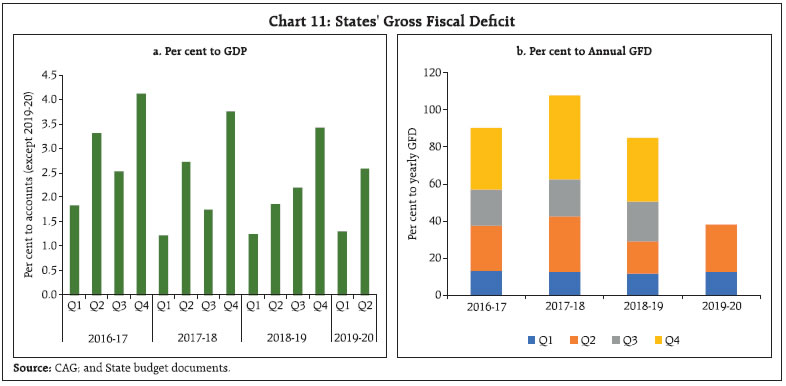
This article is second in the series of mid-year review of the Central and state government finances. Notwithstanding the challenges associated with availability of high-frequency fiscal data at a granular level, headline estimates on receipts and expenditure from the monthly dataset [released by Controller General of Accounts (CGA) and Comptroller and Auditor General of India (CAG) for Centre and states, respectively] are observed to be a closer approximation to actual accounts than revised/budget estimates available concurrently, thus providing the foundation for this review. Recognising the increasing demand from policy makers, multi-lateral institutions and market participants, the frequency of aggregation in this article has been improved from semi-annual to quarterly and a preliminary attempt has also been made to present the consolidated accounts of general government (Centre plus states) in line with the G20 Data Gaps Initiative (DGI 2) requirement. Introduction The importance of high-frequency data on government finances is paramount for policymakers, multi-lateral agencies and market participants. For policymakers, it enables availability of empirical findings from the improved modelling of macroeconomic phenomena at monthly or quarterly frequency. For multi-lateral agencies like International Monetary Fund (IMF), Financial Stability Board (FSB) and World Bank, regular analysis of government fiscal position forms a key component of their country-wise surveillance mandate. Also, monitoring of fiscal position of major economies can serve as an early warning signal of risks to the global economy. Recognising this, high frequency data on government finances is considered a key block under both the phases of the G-20 Data Gaps Initiative (DGI and DGI-2), formed in response to the Global Financial Crisis. For market participants, fiscal data is an important factor in investment decisions, both in national and sub-national government securities and in the private sector as investment decisions are influenced by the country risk perception. While always a good housekeeping practice, high-frequency review of government finances gains additional significance in the current context of economic slowdown that has deepened as the financial year has progressed, magnifying the risk to the budget estimates presented for 2019-20. For governments at all levels, the slowdown in growth has a debilitating effect on their finances as lower revenue raising capacity and downward rigidities in various expenditure heads can force either an increase in future liabilities/ borrowings or a cut down in capital expenditure, thus, deepening the growth slowdown further (RBI, 2019). Mid-year review can help assess the fiscal space available to undertake fiscal stimulus measures to reinvigorate growth, while containing the fiscal cost of it. Data challenges persist in the compilation and analysis of fiscal variables for Centre, states and general government at sub-annual frequency. These challenges stem from varying lags in availability, missing data, lack of consistency between aggregated monthly data and annual estimates obtained separately and lack of a standardised format for reporting data across various states. India has lagged behind in dissemination of Government Finance Statistics and Public Sector Debt Statistics, as noted in the successive progress reports of DGI and DGI-2.1 Notwithstanding this, high-frequency data on finances of Centre and states has gathered momentum in recent years with a large volume of monthly data being made available for Centre by the Comptroller General of Accounts (CGA) and for states by the Comptroller and Auditor General of India (CAG). However, the data is published for Centre and individual state governments. In a recent GOI report2, it was highlighted “It may prove to be very valuable if Centre’s fiscal data and states’ fiscal data are compiled on a common platform and aggregate fiscal data pertaining to all states also become available at a monthly frequency”. “Government Finances 2018-19: A Mid-Year Review”3 was a small step towards compilation and analysis of government finances on a semi-annual frequency. It conducted a mid-year review of finances of Central government and 24 states taken together for which a consistent time series of data were available. This article carries forward this practice, and additionally takes a few steps to bridge the gap in data availability. First, the frequency of aggregation is increased from semi-annual to quarterly and an analysis of the seasonality in revenues and expenditure is undertaken. Second, the consolidated accounts of general government (Centre plus states) are presented at quarterly frequency, after making suitable adjustments for inter-governmental transactions. The rest of the article is divided into five sections. Section II provides a commentary on availability, quality and gaps in high-frequency fiscal data. This section also carries out an analysis of the seasonal pattern of Centre and states’ receipts and expenditure. Section III analyses the receipts and expenditure outcomes in Q1 and Q2:2019-20 individually for Centre and all states taken together. Section IV details the outcomes in terms of key deficit indicators and addresses the financing-mix of the gross fiscal deficit. Section V presents the estimates of consolidated general government accounts at quarterly frequency and section VI concludes. II. High-frequency Reporting of Fiscal Data Monthly data on Central government finances is available from CGA since 1997-98 in a consistent format across time enabling the compilation of a long time-series data. The monthly release is made available with a lag of one month. With regard to states’ fiscal data, its sub-annual analysis relies on compilation of monthly state accounts published by the CAG and publicly available on its website (https://cag.gov.in/state-accounts). CAG sources the data from the respective state finance departments; the figures are unaudited and provisional in nature. Monthly reports are available since 2008-09 for all states except Goa, albeit, with intermittent gaps and varying lags across states. Data availability has improved in the recent period – all states except Goa have reported monthly data consistently since April 2017. Also, with the implementation of a revised template by the CAG since November 2018, the granularity with which data is available has also improved. The key shortcoming in data released by the CGA and the CAG for Centre and states, respectively, is in the level and consistency of disaggregation. Though the data made available are disaggregated, the level of disaggregation is inadequate to enable compilation of combined (Centre and states) government finances on a high-frequency basis. Also, in case of states data, it is observed that the headline numbers on tax revenue does not match the sum of its sub-components; in most cases this is due to data on states’ share in union taxes being not provided (prior to the revised format) separately in the monthly reports. Notwithstanding the limitations in data highlighted above, monthly reports by CAG could provide a useful tool for analysis of fiscal position of states in two ways: first, CAG data could provide a better guidance for actual accounts figures than the revised estimates; and second, they could enable an analysis of the seasonal pattern in government’s revenue and expenditure. Actual accounts vis-à-vis CAG data and revised estimates Provisional estimates data of CAG are available almost concurrently with revised estimates in states’ budgets while accounts figures come with an additional lag of about 8-12 months. A comparison of the deviations shows provisional estimates provided by the CAG to be significantly closer to states’ accounts compared to budget and revised estimates – both in receipts and expenditure (Chart 1). Thus, policy analysis and decision-making as well as analytical reports and econometric models could benefit from using provisional estimates rather than revised estimates in the absence of accounts figures. Seasonal pattern of government receipts and expenditure Receipts and expenditure on both revenue and capital account for the central government exhibit an asymmetrical seasonal pattern, with the former indicating a gradual build-up through the year with the highest share in Q4 while the latter being evenly spread throughout the year. About 60 per cent of the annual gross fiscal deficit of Centre is incident in Q1, mainly reflective of this asymmetry (Chart 2a). As regards states, there is broad symmetry in the seasonal pattern of receipts and expenditure on both revenue and capital account, with Q1 accounting for the lowest share and Q4 the highest share in their respective annual totals. This seasonality is particularly pronounced in capital account with half the annual capital expenditure and two-thirds of annual capital receipts accounted for in Q4. This seasonality is mirrored in Gross Fiscal Deficit of states with almost half the annual GFD accounted for in Q4 (Chart 2b). 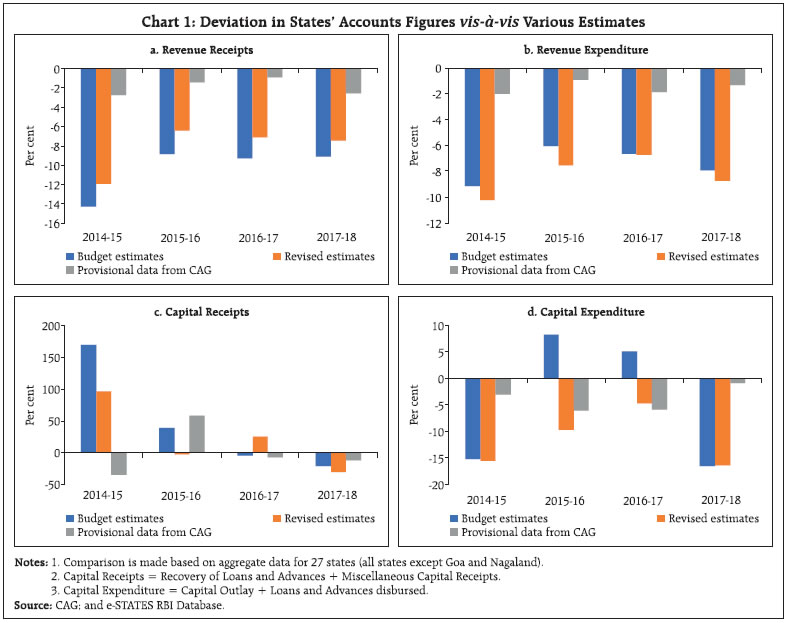
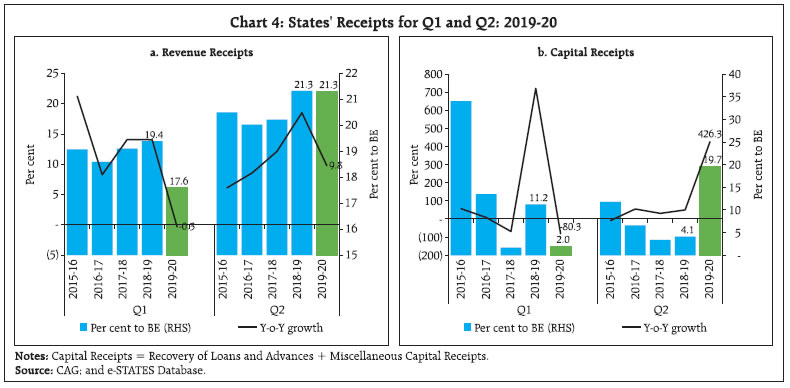
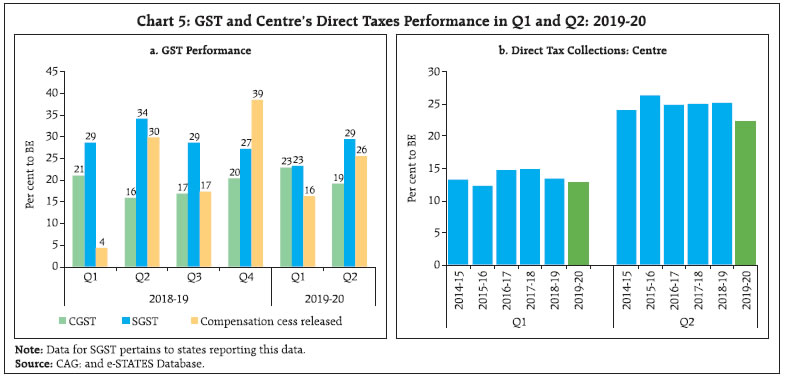
 The varying seasonal pattern in Centre and states’ finances has implications for their fiscal management. For the Centre, the front-loading of revenue expenditure and fiscal deficit in Q1, results in the build-up of fiscal pressure in Q4 making revenue generation a key priority in the later part of the year to manage the fiscal deficit target. For states, the build-up of fiscal deficit is gradual, thus making the task of deficit management easier. However, the concentration of revenues and expenditure in Q4 relies on their ability to scale up their revenue raising and spending capacity for the quarter, failing which the overall size of the budget shrinks – overall expenditure of states was about 7 per cent lower than budgeted between 2014-15 and 2017-18. III. Quarterly Outcomes: Q1 and Q2:2019-20 a. Receipts Revenue receipts for Centre rebounded strongly in Q2:2019-20 after subdued growth in Q1:2019-20. Cumulatively, H1:2019-20 revenue receipts are a marginally higher proportion of budget estimates than in the previous three years. However, capital receipts, despite picking up in Q2:2019-20 are still lagging in H1:2019-20 compared to the previous three years (Chart 3). For states4, revenue receipts registered nil growth in Q1:2019-20 but picked up in Q2:2019-20 to grow at 9.8 per cent on Y-o-Y comparison. Revenue collections of state governments cumulatively in H1:2019-20 is a lower proportion of the budget estimates than the previous two years. Also, capital receipts rebounded strongly in Q2 after registering decline in Q1. Cumulatively, H1:2019-20 capital receipts are a higher proportion of budget estimates than the previous two years (Chart 4). Compositionally, the performance of Goods and Services Tax (GST) collections, accounting for about one-third of tax revenues for Centre and almost half of own tax revenues for states, is crucial. In Q1 and Q2 of 2019-20, SGST collections have moderated in comparison to the corresponding period of the previous year largely driven by the ongoing growth slowdown. Consequently, the compensation cess released to states has increased vis-à-vis the collections during Q1 and Q2 of 2019-20 (Chart 5a). As far as direct taxes are concerned, the performance of centre for the current fiscal has moderated in comparison to the similar periods in the previous few years due to cyclical slowdown coupled with corporate tax rate cut to revive growth. Considering that these central taxes remain a part of divisible pool, states’ budgets are also likely to be hit from the tax devolution side (Chart 5b). 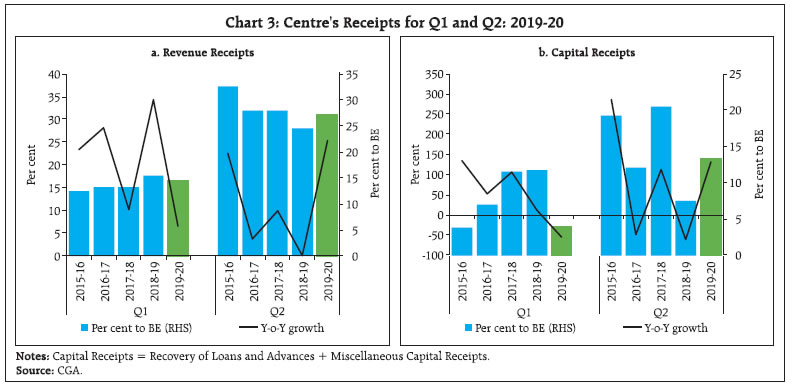
 Contrary to states, Centre also relies significantly on non-tax sources for revenue, particularly since these are not shared with states (being outside the divisible pool). For the year 2019-20, the Centre has substantial collections under the non-tax` revenue pool led by transfer of surplus from the Reserve Bank of India. Interest receipts have also been the highest in 2019-20 in comparison to the previous few years (as per cent of BE) (Chart 6). b. Expenditure Revenue expenditure for the Union government after registering subdued growth in Q1:2019-20 rebounded strongly in Q2:2019-20 (Chart 7a). As general elections were held this year, revenue expenditure was not front-loaded as seen in the previous few years. As a per cent of BE, revenue expenditure in H1:2019-20 was marginally lower than the previous year5. Capital expenditure, on the other hand, registered improvement in H1:2019-20, driven by its high growth in Q2 (Chart 7b). The subsidy pay-out has been lower in case of food subsidy, while major portion of fertiliser and petroleum subsidies have already been expended in the current fiscal of 2019-20 (Chart 8). As in case of Centre, revenue expenditure of states, after registering almost nil growth in Q1:2019-20, rebounded sharply in Q2 (Chart 9a). Revenue expenditure as a proportion to BE in Q2:2019-20 was the highest in comparison to the last five years (y-o-y growth of 23.3 per cent in Q2:2019-20); however, cumulatively in H1: 2019-20, it was lower than the previous three years. Capital expenditure started on a subdued note with a decline registered in Q1:2019-20 though it has picked up in Q2 (Chart 9b). As a per cent to BE, capital expenditure was lower in H1:2019-20 than the previous year.
IV. Fiscal Deficit and its Financing a. Fiscal Deficit Central Government With the central government deviating from the gross fiscal deficit (GFD) target in 2018-19, government has budgeted a fiscal deficit target of 3.3 per cent for 2019-20 with the aim of consolidating government finances and achieving GFD of 3.0 per cent by 2020-21 as per the revised FRBM Act. In Q1 and Q2 of 2019-20, the fiscal deficits at 61.4 and 31.2 per cent of BE, respectively were lower for Q1, and higher for Q2 in comparison to last year (Chart 10). State Governments After UDAY-led pressure in 2015-16 and 2016-17, states consolidated their fiscal position in 2017-18 by bringing down GFD to 2.4 per cent of GDP (from 3.5 in 2016-17). Preliminary data6 indicates that GFD has hovered around 2.4 per cent in 2018-19, with a gradual uptrend from Q1 to Q4 (Chart 11a). The GFD to GDP ratio for states is budgeted at 2.6 per cent for 2019-20. Usual trend indicates that states’ GFD remains higher in second half of each year, reflecting the backloading of spending by states. States have incurred around 38 per cent of their budgeted GFD in H1:2019-20 (Chart 11b), which is higher than in the corresponding period in 2018-19. 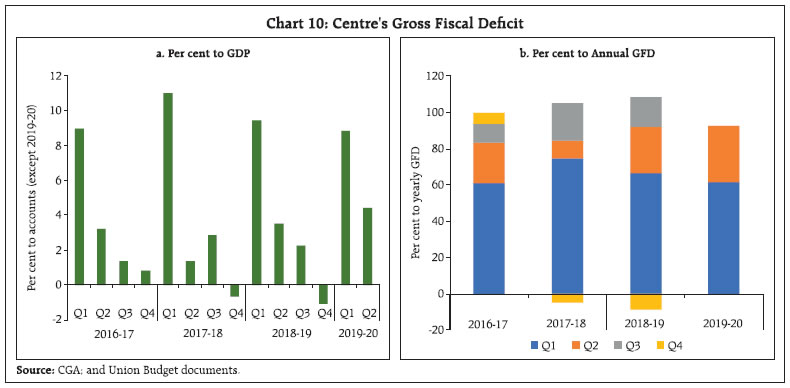
 Slippages at the level of both Centre and states have been marked by a deterioration in the quality of expenditures, with the revenue expenditure to capital expenditure ratio rising for Centre and all states taken together during past few years. In H1:2019-20, the central government has improved its quality of expenditure with a lower ratio of revenue expenditure to capital expenditure compared to the previous year driven by strong improvement in Q2 (Chart 12a). Major beneficiaries of capital expenditure for Centre have been ministries of road transport and highways and railways along with departments of telecommunication and higher education. For states however, the quality of expenditure by the same metric has deteriorated in both Q1 and Q2 of 2019-20 compared to the previous year (Chart 12b). b. Financing of Fiscal Deficit and Market Borrowings The GFD of Centre during Q1 and Q2 of 2019-20 continued to be financed mainly through market borrowings (58.8 per cent and 102.1 per cent, respectively) and its proportion in financing of GFD has increased as compared to the previous year. There was substantial disinvestment of surplus cash in Q1 and Q2 as also recourse to National Small Savings Fund (NSSF), though lower than previous year (Table 1). Compared to States, the Centre’s borrowing as percentage to BE are much higher in both 2018-19 and 2019-20 (so far) (Table 2). Considering that Centre has borrowed more than 75 per cent of its gross budgeted amount and more than 90 per cent of its net budgeted amount by end-November 2019 (average of 77 and 79 per cent, respectively, for gross and net borrowing during 2016-2018), they would have to rely on alternate sources of financing, thus necessitating the need for greater revenue generation. 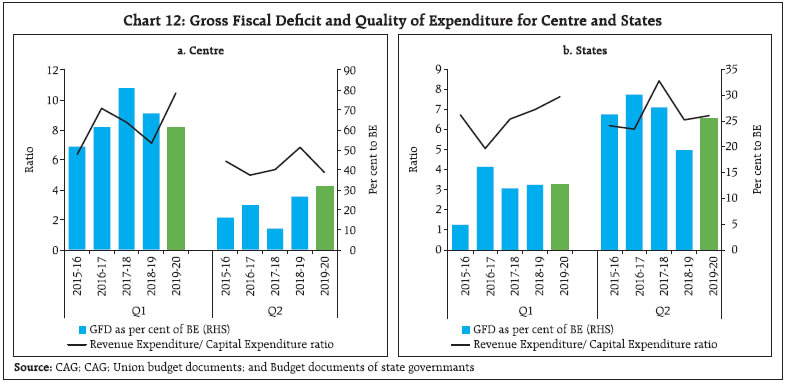 As of September 30, 2019, borrowing of all states constitutes around 36 per cent and 32 per cent of their budgeted gross and net market borrowing, respectively (Table 2) . State-wise data on borrowings indicates that Manipur, Rajasthan and Telangana have crossed 50 per cent, while Punjab, Andhra Pradesh and Kerala are close to reaching half of their budgeted gross market borrowings. Manipur stands out as its gross market and net borrowings have crossed the budget estimates (Chart 13). During April- September 2019, thirteen states resorted to Ways and Means Advances (WMA), while eight states availed the overdraft facility. | Table 1: Financing the Gross Fiscal Deficit of Central Government | | (Amount in ₹ thousand crores) | | Components | Q1:2018-19 | Q2:2018-19 | Q3:2018-19 | Q4:2018-19 | Q1:2019-20 | Q2:2019-20 | | 1 | 2 | 3 | 4 | 5 | 6 | 7 | | Gross Fiscal Deficit | 429.0 | 165.7 | 106.7 | -56.1 | 432.1 | 219.5 | | Market Borrowing | 162.0 | 188.4 | 119.6 | -33.7 | 254.1 | 224.2 | | State Provident Fund | 2.3 | 2.0 | 1.1 | 10.5 | 2.2 | 0.4 | | National Small Savings Fund | 47.0 | 15.1 | 19.4 | -66.3 | 57.2 | -6.4 | | Cash Balances {Decrease(+)/Increase(-)} | 0.9 | 0.1 | 0.0 | -2.3 | 4.9 | 0.1 | | Investment (-) / Disinvestment (+) of Surplus Cash | 162.6 | 0.0 | -17.8 | -104.9 | 122.7 | -33.5 | | External Assistance | 3.9 | -11.2 | 3.2 | 5.9 | 6.9 | -2.4 | | Ways and Means Advances | 55.4 | -32.0 | -23.4 | 0.0 | 26.5 | -26.5 | | Others * | -5.1 | 3.4 | 4.6 | 134.7 | -42.5 | 63.6 | * Includes items such as special deposits, suspense and remittances and other capital receipts.
Source: CGA. |
| Table 2: Market Borrowings of Central and State Governments | | (in ₹ crore) | | Item | 2019-20 | 2018-19 | 2019 -20 H1 | 2018 -19 H1 | | | (April - Nov 22, 2019) | (April - Nov 23, 2018) | (April to Sep 30, 2019) | (April to Sep 30, 2018) | | Central Government | | Gross Market | 538000 | 355000 | 442000 | 276000 | | Borrowings | (75.8) | (58.6) | (62.3) | (45.6) | | Net Market | 436972 | 254800 | 340972 | 188432 | | Borrowings | (92.4) | (55.1) | (72.1) | (40.8) | | State Governments | | Gross Market | 316002 | 229313 | 225445 | 157502 | | Borrowings | (50.7) | (41.0) | (36.2) | (28.1) | | Net Market | 226950 | 193453 | 156447 | 137650 | | Borrowings | (46.7) | (43.9) | (32.2) | (31.2) | Note: Figure in parentheses indicate percentage to budgeted gross and net borrowings for the financial year.
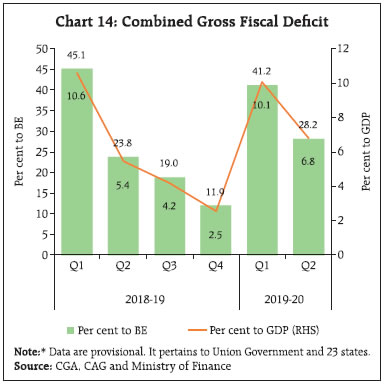
Source: Weekly Statistical Supplement, RBI. | V. General Government Finances7 Data gaps limit the ability of policymakers and market participants to understand economic developments in a timely and accurate manner (FSB, 2019). It was with this objective in view that in 2009 a report8 was jointly published by the IMF and the FSB as a compliance to request of G20 Finance Ministers and Governors identifying the information gaps and also providing proposals to fill those gaps among the G20 countries. Consequently, the G20 Data Gap Initiative was launched and since 2015 has continued in its second phase. As part of this initiative, India is expected to meet the quarterly fiscal reporting standard for the combined government finances, viz., Centre and states by 2020-21. Though the monthly data, as highlighted in the remaining portion of the article, is available for both Centre and states, combined government finances are not available in the public domain. As a first step towards fulfilling one of the G-20 data gaps to which India has committed, an attempt has been made to compile the quarterly combined government finances for India9 (Appendix, Table 3). The analysis shows that as per cent of the budget estimates, the combined GFD performance is lower in Q1 2019-20 but higher in Q2 2019-20 vis-a-vis corresponding period of the previous year, primarily driven by expenditure push given by the centre in Q2 2019-20. As regards the GFD performance as per cent to GDP, it may be noted that due to front loading of expenditure, the GFD-GDP ratio is high during Q1; it glides downward Q2 onwards, thus trying to remain within the committed path of fiscal consolidation (Chart 14). 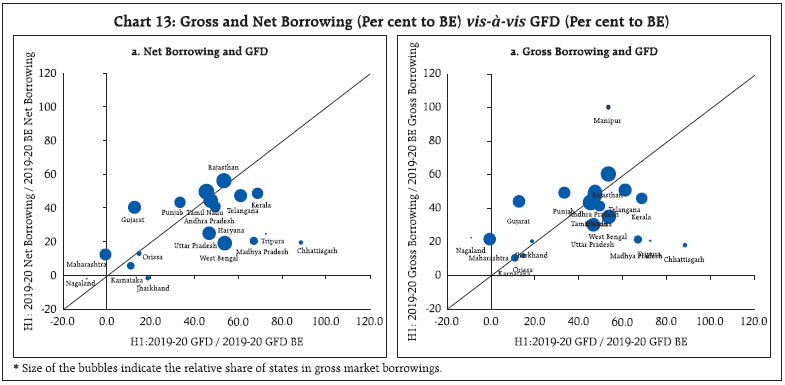
 VI. Going Forward The GFD for the Union Government stood at ₹6.5 lakh crore during April-September 2019-2010 as against the budgeted amount of ₹7.0 lakh crore for the full year. Thus, in H1:2019-20 itself, the Centre’s GFD had reached 92.6 per cent of the BE. Furthermore, by October 2019, the Centre’s fiscal deficit has crossed the full year budget target and stands at 102.4 per cent of BE. The Centre’s fiscal deficit has a seasonal pattern with the first half of the financial year typically accounting for more than 80 per cent. For states, on the other hand, only about 35 per cent of their combined GFD is covered in H1. Given this seasonality, the combined GFD (Centre plus states) that stands at 69.5 per cent of BE in H1:2019-20 is likely to see lower accretions going forward. On the revenue side, tax collections have been lagging behind targets. On the expenditure side, the government has announced various measures, viz., relief to the export and housing sector, cut in corporate tax rates, among others. Notwithstanding relatively high fiscal deficit of the Centre and moderate tax collections in Q1 and Q2 of 2019-20, capital expenditure has not been compromised which augurs well for future growth. Going forward, the counter-cyclical expenditure push is likely to come more from states as their expenditure is at 40 per cent of BE and they have the fiscal space with their GFD-GDP ratio being lower at 1.9 per cent in H1:2019-20. However, lower revenue collections could slowdown the pace of expenditure by states as witnessed during previous few years. Centre is depending on garnering higher revenues through alternate means to compensate for tax shortfall, while states also need to simultaneously explore all avenues, tax and non-tax, to augment revenues as highlighted in the Reserve Bank’s State Finance Report, 2019-20. The unfolding of the overall fiscal situation for Union and state government would crucially hinge on indigenous revenue mobilisation efforts, prudent fiscal policy stance and overall macroeconomic conditions. References Ministry of Statistics and Program Implementation (2018). “Report of the Committee of Fiscal Statistics”. Retrieved from: http://www.mospi.gov.in/sites/default/files/committee_reports/Report%20of%20 the%20Committee%20on%20Fiscal%20Statistics.pdf Reserve Bank of India (2018). “Government Finances 2018-19: A Mid-Year Review”. Retrieved from: https://www.rbi.org.in/Scripts/BS_ViewBulletin.aspx?Id=17938 Financial Stability Board, International Monetary Fund (2009). “The Financial Crisis and Information Gaps”. Retrieved from: https://www.imf.org/external/np/g20/pdf/102909.pdf International Monetary Fund, Financial Stability Board (2019). “G20 Data Gaps Initiative: The Fourth Progress Report—Countdown to 2021”. Retrieved from: https://www.fsb.org/2019/10/g20-data-gapsinitiative-dgi-2-the-fourth-progress-report-countdownto-2021/ Reserve Bank of India (2019). “State Finances A Study of Budgets of 2019-20”. Retrieved from: https://www.rbi.org.in/Scripts/AnnualPublications.aspx?head=State%20Finances%20:%20A%20Study%20 of%20Budgets Websites The office of the Comptroller and Auditor General of India. https://cag.gov.in/ The Office of Controller General of Accounts. http://www.cga.nic.in/
Appendix | Table 1: Budgetary Position of the Central Government during April-September 2019 | | Item | (₹ thousand crore) | (Per cent) | | Actuals | Budget Estimates | Percent to BE | Y-o-Y Growth Rate | | 2019-20 | 2018-19 | 2019-20 | 2018-19 | 2019-20 | 2018-19 | 2019-20 | 2018-19 | | (1) | (2) | (3) | (4) | (5) | (6) | (7) | (8) | (9) | | 1. Revenue Receipts | 816.5 | 691.8 | 1962.8 | 1725.7 | 41.6 | 40.1 | 18.0 | 11.0 | | 1.1. Tax Revenue (Net) | 607.4 | 582.8 | 1649.6 | 1480.6 | 36.8 | 39.4 | 4.2 | 7.5 | | 1.2. Non-Tax Revenue | 209.0 | 109.0 | 313.2 | 245.1 | 66.7 | 44.5 | 91.8 | 34.8 | | 1.3. Interest Receipts | 6.5 | 5.8 | 13.7 | 15.2 | 47.3 | 38.5 | 10.9 | 30.9 | | 2. Capital Receipts | 20.6 | 17.7 | 119.8 | 92.2 | 17.2 | 19.2 | 16.2 | -34.4 | | 2.1. Recovery of Loans | 8.2 | 7.8 | 14.8 | 12.2 | 55.6 | 63.8 | 5.8 | 6.9 | | 2.2. Other Receipts | 12.4 | 9.9 | 105.0 | 80.0 | 11.8 | 12.4 | 24.3 | -49.7 | | 3. Total Receipts (1+2) | 837.1 | 709.5 | 2082.6 | 1817.9 | 40.2 | 39.0 | 18.0 | 9.1 | | 4. Revenue expenditure | 1301.1 | 1141.6 | 2447.8 | 2141.8 | 53.2 | 53.3 | 14.0 | 13.8 | | of which | | | | | | | | | | (i) Interest Payments | 270.7 | 255.4 | 660.5 | 575.8 | 41.0 | 44.4 | 6.0 | 13.1 | | 5. Capital expenditure | 187.5 | 162.6 | 338.6 | 300.4 | 55.4 | 54.1 | 15.3 | 11.1 | | of which | | | | | | | | | | (i) Loans and Advances | 14.8 | 10.5 | 27.8 | 21.7 | 53.4 | 48.4 | 40.8 | -47.1 | | 6. Total expenditure (4+5) | 1488.6 | 1304.2 | 2786.3 | 2442.2 | 53.4 | 53.4 | 14.1 | 13.5 | | 7. Revenue Deficit (4-1) | 484.6 | 449.8 | 485.0 | 416.0 | 99.9 | 108.1 | 7.7 | 18.5 | | 8. Fiscal Deficit (6-3) | 651.6 | 594.7 | 703.8 | 624.3 | 92.6 | 95.3 | 9.6 | 19.2 | | 9. Gross primary Deficit {8-4 (i)} | 380.9 | 339.3 | 43.3 | 48.5 | 879.8 | 699.9 | 12.2 | 24.2 | | Source: Office of Controller General of Accounts, Ministry of Finance, Government of India. |
| Table 2: Quarterly Position of Central Government Finances | | Item | (₹ thousand crore) | (Per cent) | | Q1 | Q2 | Per cent to Budget Estimates | Y-o-Y Growth rate | | Q1 | Q2 | 2019-20 | | 2019-20 | 2018-19 | 2019-20 | 2018-19 | 2019-20 | 2018-19 | 2019-20 | 2018-19 | Q1 | Q2 | | (1) | (2) | (3) | (4) | (5) | (6) | (7) | (8) | (9) | (10) | (11) | | 1. Revenue Receipts | 284.9 | 267.8 | 531.6 | 424.0 | 14.5 | 15.5 | 27.1 | 24.6 | 6.4 | 25.4 | | 1.1. Tax Revenue (Net) | 251.4 | 237.2 | 356.0 | 345.6 | 15.2 | 16.0 | 21.6 | 23.3 | 6.0 | 3.0 | | 1.2. Non-Tax Revenue | 33.5 | 30.6 | 175.6 | 78.4 | 10.7 | 12.5 | 56.1 | 32.0 | 9.4 | 124 | | 1.3. Interest Receipts | 3.3 | 2.5 | 3.2 | 3.4 | 23.8 | 16.3 | 23.5 | 22.2 | 31.8 | -4.4 | | 2. Capital Receipts | 4.8 | 10.8 | 15.8 | 6.9 | 4.0 | 11.8 | 13.2 | 7.5 | -56.1 | 129.9 | | 2.1. Recovery of Loans | 2.4 | 2.1 | 5.8 | 5.7 | 16.2 | 17.1 | 39.3 | 46.7 | 15.6 | 2.3 | | 2.2. Other Receipts | 2.4 | 8.8 | 10.0 | 1.2 | 2.2 | 11.0 | 9.5 | 1.5 | -73.1 | 744.1 | | 3. Total Receipts (1+2) | 289.7 | 278.6 | 547.4 | 430.9 | 13.9 | 15.3 | 26.3 | 23.7 | 4.0 | 27.0 | | 4. Revenue expenditure | 658.7 | 620.7 | 642.4 | 520.9 | 26.9 | 29.0 | 26.2 | 24.3 | 6.1 | 23.3 | | of which | | | | | | | | | | | | (i) Interest Payments | 141.8 | 144.9 | 128.9 | 110.5 | 21.5 | 25.2 | 19.5 | 19.2 | -2.2 | 16.7 | | 5. Capital expenditure | 63.0 | 87.0 | 124.5 | 75.6 | 18.6 | 29.0 | 36.8 | 25.2 | -27.6 | 64.6 | | of which | | | | | | | | | | | | (i) Loans and Advances | 6.0 | 10.0 | 8.8 | 0.6 | 21.7 | 45.7 | 31.7 | 2.7 | -39.4 | 1422.7 | | 6. Total expenditure (4+5) | 721.7 | 707.6 | 766.9 | 596.6 | 25.9 | 29 | 27.5 | 24.4 | 2.0 | 28.6 | | 7. Revenue Deficit (4-1) | 373.8 | 352.9 | 110.8 | 96.9 | 77.1 | 84.8 | 22.8 | 23.3 | 5.9 | 14.3 | | 8. Fiscal Deficit (6-3) | 432.1 | 429.0 | 219.5 | 165.7 | 61.4 | 68.7 | 31.2 | 26.5 | 0.7 | 32.5 | | 9. Gross primary Deficit {8-4 (i)} | 290.3 | 284.1 | 90.6 | 55.2 | 670.6 | 586 | 209.2 | 113.8 | 2.2 | 64.1 | | Source: Office of Controller General of Accounts, Ministry of Finance, Government of India. |
| Table 3: Budgetary Position of the State Governments during April-September 2019 | | Item | (₹ thousand crore) | (Per cent) | | Provisional actuals data | Per cent to BE | Y-o-Y Growth Rate | | 2017-18 | 2018-19 | 2019-20 | 2018-19 | 2019-20 | 2018-19 | 2019-20 | | (1) | (2) | (3) | (4) | (5) | (6) | (7) | (8) | | 1. Revenue Receipts | 865.9 | 1007.7 | 1058.1 | 40.7 | 38.9 | 16.4 | 5.0 | | 1.1. Tax Revenue | 677.6 | 770.1 | 789.5 | 42.5 | 39.7 | 13.7 | 2.5 | | 1.2. Non-Tax Revenue | 56.0 | 70.3 | 69.3 | 34.7 | 31.7 | 25.6 | -1.5 | | 1.3. Grants-in-aid and Contributions | 132.3 | 167.3 | 199.3 | 36.2 | 39.0 | 26.5 | 19.2 | | 2. Capital Receipts | 2.1 | 8.0 | 12.4 | 15.3 | 21.7 | 272.2 | 56.0 | | 2.1. Recovery of Loans and Advances | 2.1 | 7.2 | 12.4 | 14.2 | 22.3 | 244.8 | 72.2 | | 2.2. Other Receipts | 0.1 | 0.8 | 0.1 | 65.4 | 3.1 | 1272.6 | -92.3 | | 3. Revenue expenditure | 908.7 | 1009.7 | 1105.4 | 40.5 | 40.0 | 11.1 | 9.5 | | of which | | | | | | | | | (i) Interest Payments | 99.2 | 107.9 | 123.3 | 39.0 | 40.1 | 8.8 | 14.4 | | 4. Capital expenditure | 122.1 | 150.3 | 156.2 | 30.8 | 30.3 | 23.1 | 3.9 | | 4.1. Capital Outlay | 111.3 | 134.6 | 137.5 | 29.8 | 28.7 | 20.8 | 2.2 | | 4.2. Loans and advances disbursed | 10.7 | 15.8 | 18.7 | 43.9 | 50.9 | 46.9 | 18.4 | | 5. Fiscal Deficit [(3+4) - (1+2)] | 162.7 | 144.4 | 191.0 | 31.9 | 38.0 | -11.2 | 26.0 | | 6. Revenue Deficit (3-1) | 42.8 | 2.0 | 47.3 | 11.9 | 107.7 | -95.4 | 2281.1 | | Source: Comptroller and Auditor General of India. |
| Table 4: Quarterly Position of State Government Finances | | Item | (₹ thousand crore) | (Per cent) | | Provisional actuals data | Per cent to BE | Y-o-Y Growth Rate | | Q1 | Q2 | Q1 | Q2 | 2019-20 | | 2019-20 | 2018-19 | 2019-20 | 2018-19 | 2019-20 | 2018-19 | 2019-20 | 2018-19 | Q1 | Q2 | | 1. Revenue Receipts | 478.5 | 479.9 | 579.6 | 527.9 | 17.6 | 19.4 | 21.3 | 21.3 | -0.3 | 9.8 | | 1.1. Tax Revenue | 371.3 | 366.2 | 418.2 | 403.9 | 18.7 | 20.2 | 21.0 | 22.3 | 1.4 | 3.5 | | 1.2. Non-Tax Revenue | 32.2 | 34.8 | 37.1 | 35.5 | 14.7 | 17.2 | 17.0 | 17.5 | -7.6 | 4.6 | | 1.3. Grants-in-aid and Contributions | 70.6 | 78.8 | 128.8 | 88.4 | 13.8 | 17.1 | 25.2 | 19.2 | -10.5 | 45.6 | | 2. Capital Receipts | 1.1 | 5.8 | 11.3 | 2.1 | 2.0 | 11.2 | 19.7 | 4.1 | -80.3 | 426.3 | | 2.1. Recovery of Loans and Advances | 1.1 | 5.7 | 11.2 | 1.4 | 2.0 | 11.3 | 20.3 | 2.8 | -80.5 | 683.8 | | 2.2. Other Receipts | 0.0 | 0.1 | 0.0 | 0.7 | 1.6 | 6.1 | 1.5 | 59.3 | -57.0 | -96.0 | | 3. Revenue expenditure | 480.2 | 474.7 | 625.2 | 535.0 | 17.4 | 19.1 | 22.6 | 21.5 | 1.2 | 16.9 | | of which | | | | | | | | | | | | (i) Interest Payments | 50.2 | 41.8 | 73.2 | 66.1 | 16.3 | 15.1 | 23.8 | 23.9 | 20.1 | 10.7 | | 4. Capital expenditure | 62.9 | 67.8 | 93.3 | 82.6 | 12.2 | 13.9 | 18.1 | 16.9 | -7.2 | 13.0 | | 4.1. Capital Outlay | 57.6 | 62.4 | 80.0 | 72.1 | 12.0 | 13.8 | 16.7 | 16.0 | -7.8 | 10.9 | | 4.2. Loans and advances disbursed | 5.3 | 5.3 | 13.4 | 10.5 | 14.5 | 14.9 | 36.4 | 29.1 | -0.2 | 27.9 | | 5. Fiscal Deficit [(3+4)-(1+2)] | 63.4 | 56.8 | 127.6 | 87.5 | 12.6 | 12.6 | 23.6 | 19.3 | 11.6 | 35.3 | | 6. Revenue Deficit (3-1) | 1.7 | -5.1 | 45.6 | 7.1 | 3.8 | -30.7 | 103.8 | 42.6 | -133.0 | 541.1 | | Source: Comptroller and Auditor General of India. |
| Table 5: Combined Government Finances (as per cent to GDP) | | Item | 2018-19 | 2019-20 | | | Q1 | Q2 | Q3 | Q4 | Q1 | Q2 | | Tax Revenue | 13.4 | 15.9 | 16.2 | 17.8 | 12.7 | 15.6 | | Non-Tax Revenue | 3.2 | 4.3 | 3.0 | 5.8 | 2.8 | 6.9 | | Capital Receipts | 0.4 | 0.2 | 0.8 | 1.6 | 0.1 | 0.5 | | Total Receipts | 17.0 | 20.4 | 19.9 | 25.2 | 15.6 | 23.0 | | Total expenditure | 27.4 | 25.8 | 24.2 | 27.8 | 25.7 | 29.8 | | Revenue expenditure | 24.2 | 22.6 | 21.2 | 22.6 | 23.3 | 25.5 | | Capital expenditure | 3.2 | 3.3 | 3.0 | 5.2 | 2.5 | 4.3 | | Gross Fiscal Deficit | 10.6 | 5.4 | 4.2 | 2.5 | 10.1 | 6.8 | | Revenue Deficit | 7.6 | 2.3 | 2.1 | -1.0 | 7.8 | 3.1 | Note: Data is as per Provisional Accounts of the Union and the State Government finances.
Data pertains to Union Government and 23 states. |
| Table 6: Combined Government Finances (as per cent to GDP) | | | 2018-19 | 2019-20 | | | April-September | April-September | | Tax Revenue | 14.7 | 14.2 | | Non-Tax Revenue | 3.8 | 4.8 | | Capital Receipts | 0.3 | 0.3 | | Total Receipts | 18.7 | 19.4 | | Total expenditure | 26.6 | 27.8 | | Revenue expenditure | 23.4 | 24.4 | | Capital expenditure | 3.3 | 3.4 | | Gross Fiscal Deficit | 8.0 | 8.4 | | Revenue Deficit | 4.9 | 5.4 | Note: Data is as per Provisional Accounts of the Union and the State Government finances.
Data pertains to Union Government and 23 states. |
|