Set against the backdrop of the shift in fiscal framework since 2018-19 and recognising the growing importance of analysing sub-annual public finances for efficient fiscal and macro-economic outcomes, this article presents a synoptic view of the half-yearly fiscal position of consolidated state government finances for the first time along with that of the central government. While centre’s fiscal position has deteriorated in H1 2018-19 vis-à-vis last year, states have shown a reasonably fair performance so far. Nevertheless, capital expenditure has not been compromised which augurs well for economic growth. Going forward, growth impulse through high expenditure is likely to come from states, while for the centre the fiscal performance will hinge upon revenue mobilisation. Introduction Against the backdrop of the implementation of a major structural reform embodied in the Goods and Services tax (GST) in 2017-18, the Union Budget, 2018-19 recalibrated the path of fiscal consolidation in pursuance of the Fiscal Responsibility and Budget Management (FRBM) Act, 2018-19 to achieve the target of 3.0 per cent of the GDP for the gross fiscal deficit (GFD) by 2020-21. Analogously, states also committed to improve their finances in 2018-19 to contain their combined GFD to 2.6 per cent of GDP which, if realised, would undershoot the 3 per cent rule for the first time in the last four years. In this milieu, monitoring the performance of the centre and the states at the mid-point of this crucial year of the resetting of fiscal policy at national and sub-national level is the key motivation driving this article. In terms of best practices, this is a valid exercise: “monitoring government accounts on a sub-annual basis is vital for efficient fiscal management of a country” (IMF, 2007).1 In fact, the International Open Budget Index2 ranks India lower than its peers because of, inter alia, there being no mid-year budget reviews. In doing so, this article is also driven by the scope of gleaning valuable information from the intra-year developments for more efficient macro-monitoring and surveillance. The country experience also upholds the criticality of sub-annual data / analysis of public finances (Pérez, 2007, Onorante et al., Pedregal D. and Pérez J., 2008).3 In fact, published monthly reviews of public finances is also a popular country practice.4 In the Indian context, a caveat is in order. It is necessary to recognise the constraints of information availability on a sub-annual basis. Data on central finances are available at monthly frequency in the public domain.5 As regards the states, the consolidated state finances have been evaluated only at an annual frequency by the Reserve Bank of India (RBI) in its reports entitled, “State Finances: A Study of Budgets”, the latest release being in July 2018. The office of Comptroller and Auditor General (CAG) has been releasing the monthly data for a large number of states, albeit, with varying lags. The gradual improvement in reporting by states has improved the feasibility of analysing consolidated states position for a reasonable number of states at sub-annual basis. In order to fill the inherent gap and redress the imbalance in surveillance, this article undertakes a mid-year analysis of the finances of the centre and of consolidated position of 24 states, viz., Assam, Bihar, Chhattisgarh, Gujarat, Haryana, Himachal Pradesh, Jammu and Kashmir, Jharkhand, Karnataka, Kerala, Madhya Pradesh, Maharashtra, Meghalaya, Nagaland, Odisha, Punjab, Rajasthan, Sikkim, Telangana, Tamil Nadu, Tripura, Uttar Pradesh, Uttarakhand and West Bengal.6 This article serves the objective of enhancing fiscal transparency with a view to enabling a wider public understanding of the challenges that various levels of government confront in squaring fiscal arithmetic with the overarching goals of public policy. The rest of the article is divided into four sections. Section II discusses the institutional framework in which this mid-year review is undertaken. Section III details the outcomes of the union and state governments during April-September 2018 by drilling down to underlying drivers in terms of revenue and expenditure that determine the fiscal outcome in terms of key deficit indicators. Section IV addresses the financing of the gross fiscal deficit. Section V concludes by highlighting some of the issues and challenges that lie ahead. II. Institutional Framework The year 2018-19 can be regarded as a watershed for federal finances since it marks a recommitment to fiscal consolidation at all levels of government. The union government budgeted for a GFD of 3.3 per cent of GDP for 2018-19 as an intermediate step towards converging to a GFD-GDP ratio of 3.0 per cent by 2020-21. Another landmark is the establishment of dual targets – in terms of debt and the fiscal deficit – as necessary, and sufficient conditions for fiscal prudence, as recommended by the FRBM Review Committee (Chairman: Shri N. K. Singh).7 The government has also committed to bring in some element of countercyclicality in its fiscal policy by suitably adopting explicit escape and buoyancy clauses.8 As regards the states by 2011 all of them had introduced their own FRBM legislations; while the revised FRBM Amendment (Rules), 2018 does not explicitly target states fiscal deficits, a debt to GDP target of 20 per cent is implicitly built into the framework. Accordingly, the central government and general government debt is slated to be brought down to 40 per cent and 60 per cent of GDP, respectively, by 2024-25. Monitoring of the progress achieved in fiscal consolidation within the year under review is a tradition set under the FRBM Act, 2003, which can rightfully be regarded as the progenitor of rule-based fiscal policies in India, both for the centre and states. In fact, under Rule 7 of the FRBM Rules, 2004, Government is required to take appropriate corrective measures in case the outcome of the first half shows (i) a fiscal deficit higher than 70 per cent of the budget estimates (BE) for that year;9 and (ii) non-debt receipts lower than 40 per cent of BE. While the revised FRBM Rules, 2018 does not specifically mention about mid-year benchmarks, this article draws on the spirit of the good practices of the FRBM rule, in general, as its motivation. III. Outcomes In several ways, the budgets for 2018-19 – both centre and states – envisaged a silent but fundamental break from the past. First and perhaps foremost, fiscal consolidation was based on revenue augmentation rather than expenditure rationalisation. The GST was viewed as a game changer, bringing in higher revenues for all levels of government by widening the tax base and incentivising buoyancy in tax collections through several rounds of tax rate reductions by the GST Council. Moreover, higher non-tax revenues were also envisaged as the economy recovered from the debilitating effects of demonetisation and GST implementation and the impairment in corporate and bank balance sheets was healed. Simultaneously, governments committed to enhancing the quality of expenditure by preserving budgeted capital outlays and lowering outlays on the revenue account. In the ensuing section, an attempt is made to stack up outcomes so far against the expectations. a. Receipts In the event, tax revenues of the centre moderated during H1 of 2018-19. Although gross tax revenue (both direct and indirect taxes) was higher in absolute terms, they fell short of BE, reflecting higher budgeted tax buoyancy. The budgeted direct and indirect tax buoyancy for 2018-19 is 1.2 and 1.6, respectively, higher than the post-crisis average (2010-11 to 2017- 18) of 1.1 and 1.5, respectively (Chart 1). In terms of actual outcomes, direct tax receipts grew robustly relative to recent history, albeit, amounting to only 39 per cent to BE – 40 per cent a year ago. This reasonable collection were mainly due to increase in tax base.10 On the other hand, corporation tax collections outperformed the BE and posted higher growth rates than in the preceding year. 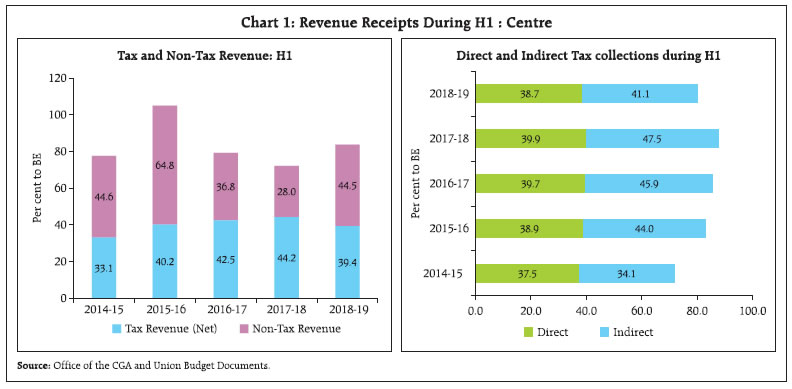 According to the Office of the Controller General of Accounts, the total revenue under GST in the first half of 2018-19 amounted to ₹2898.8 billion (₹3314.6 billion during April-October 2018), around 38.8 per cent to BE (44.4 per cent to BE in April-October 2018) (Chart 2). The total number of Goods and Services Tax Returns (GSTR) 3B returns filed for the month of September, 2018 was 67.5 lakh, a year-on-year increase of 17.7 per cent (69.6 lakh for the month of October, 2018, a year-on-year increase of 38.9 per cent).11 The customs duties collections in H1 2018-19 stood at 57.3 per cent to BE higher than 35.5 per cent to BE last year, albeit, lower in absolute amount as compared to the previous year. A similar trend has been seen in the union excise duties, which though higher as per cent to BE – 38.7 per cent vis-à-vis 31.9 per cent last year – was lower in absolute amount. Subsuming of the major component of these taxes under GST may be attributed to the lower collection (in absolute amount). Non-tax revenue, on the other hand, picked up during H1 of 2018-19 to 44.5 per cent to BE, higher than the corresponding period of the previous two years. This may be attributed to higher interest receipts (highest in five years, as proportion to BE, along with higher dividend and profits in H1 of 2018-19 in relation to a year ago (Chart 3).
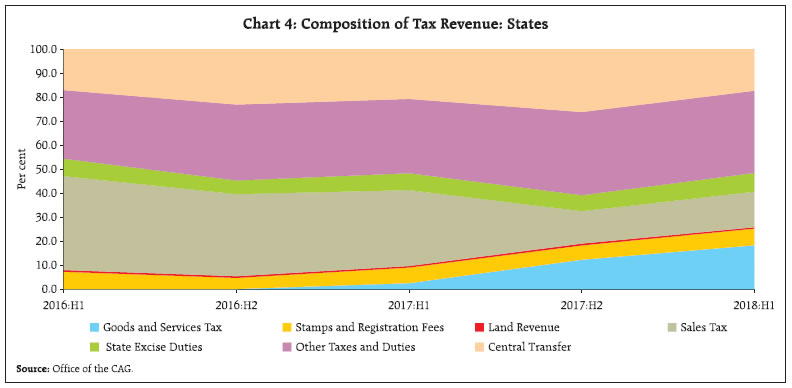
Turning to states, growth in revenue in 2018-19:H1 moderated to 39 per cent to BE, albeit, marginally higher than a year ago (Table 1). This improvement essentially reflected the pick-up in non-tax revenue, as in the case of the centre, and grants.12 On the other hand, growth in tax revenue decelerated on the back of continuing uncertainty around the GST. The composition of tax revenue indicates shrinkage in indirect taxes, particularly sales taxes, which are being replaced by GST (Chart 4). The share of direct taxes – land revenue and stamp and registration fees – remained broadly stable. | Table 1: Revenue Receipts of States | | Per cent | | | Per cent to BE | Growth | | 2016-17 H1 | 2016-17 H2 | 2017-18 H1 | 2017-18 H2 | 2018-19 H1 | 2017-18 H1 | 2017-18 H2 | 2018-19 H1 | | Revenue receipts | 37.4 | 52.6 | 38.4 | 50.7 | 39.0 | 13.6 | 6.7 | 13.5 | | Tax revenue | 40.4 | 54.9 | 41.2 | 52.5 | 40.8 | 14.4 | 7.1 | 11.2 | | Non-tax revenue | 27.7 | 56.3 | 31.4 | 56.2 | 33.7 | 14.1 | 0.1 | 24.0 | | Grants | 31.1 | 43.0 | 30.9 | 42.1 | 34.5 | 9.8 | 8.4 | 20.2 | Note: Analysis is based on information for 24 states.
Source: Office of the CAG. |
 The unusual hardening of crude oil prices in the first half of year to a peak in early October 2018 and the depreciation of the rupee boosted tax revenue collection by states from petroleum products. On the other hand, in tandem with the announcement by the central government of cut in excise duties tax on petrol and diesel prices and reduction of prices by oil marketing companies, 18 states reduced VAT/sales tax on petroleum products in varying magnitude, for the relief of the common man.13 States are also likely to benefit from revised Integrated Goods and Services tax (IGST) apportionment.14 It is likely that the loss of revenue on account of VAT/sales tax rates will be more than compensated by the increase in revenue due to higher prices of petroleum products. Non-debt capital receipts were an important source of revenue for the centre during 2017-18. During H1 2018-19, however, they have not picked up due to lower disinvestment proceeds so far (Chart 5).
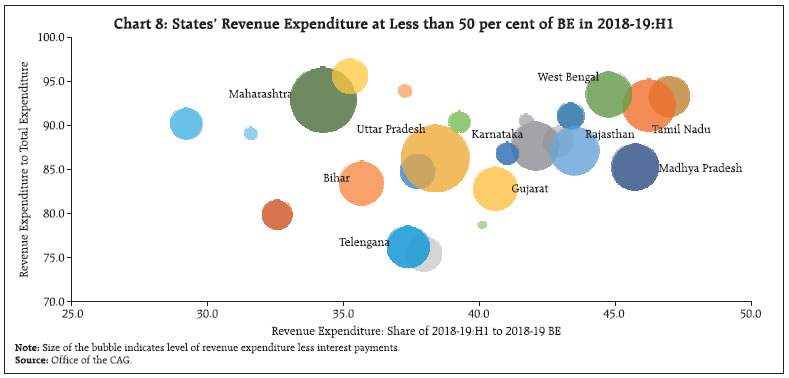
b. Revenue Expenditure Revenue expenditure for the union government after growing aggressively in 2017-18, has grown at a modest pace this fiscal (Chart 6a). During H1 revenue expenditure (as per cent to BE) was marginally lower than last year, primarily due to lower subsidy payout (as per cent to BE) among major subsidies except petroleum (Chart 6b). Taking into account the performance upto October 2018, subsidy payout has been lower due to lower food subsidy payout as per cent to BE, while fertiliser and petroleum subsidies have been higher. Revenue expenditure of states in 2018-19:H1 was at 39.9 per cent to BE (Chart 7). Among committed expenditures, interest payments were lower than H1 of previous year. Farm loan waivers had contributed about five basis points to the overshooting of revenue expenditure in 2017-18. During this fiscal so far, there has been no announcement of farm loan waivers by states outside their budgets.15 The recent agitation by the farmer community, however, might induce some states and central government to go for such schemes, resulting in increase in revenue expenditure in the rest of 2018-19. Nevertheless, it is important to note that when compared with budget estimates, none of the states have spent over 50 per cent in H1, including the states going for election in the ensuing months, the average being around 41 per cent (Chart 8). 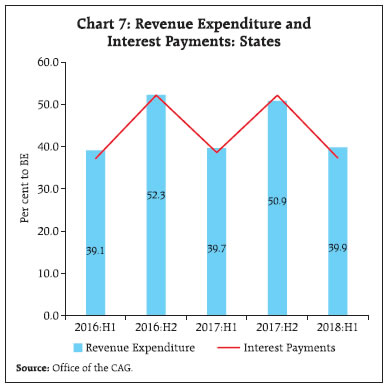
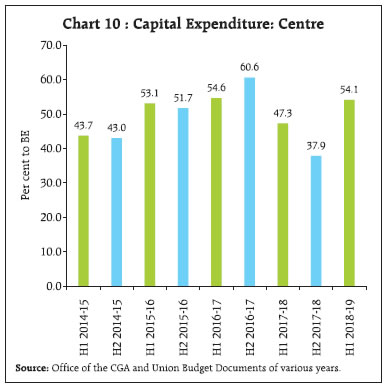
 The recent devastating flood in Kerala is likely to force the government to incur additional expenditure relative to BE, resulting in deterioration in its fiscal situation. Kerala government made a proposal16 before central government for imposition of cess on State Goods and Services Tax (SGST) for rehabilitation and flood affected works. A committee has been constituted to examine the issue regarding ‘Modalities for Revenue Mobilisation in case of Natural Calamities and Disasters’. In addition to this, some states like Chhattisgarh, MP, Telangana, Mizoram and Rajasthan are facing election in this fiscal; more states are going for election in the next fiscal year, which may also influence the resource allocation going forward. c. Capital Expenditure Slippages at the level of both centre and states have been marked by a deterioration in the quality of expenditures, with the revenue expenditure to capital expenditure ratio rising for centre and all states taken together during past few years (Chart 9). During 2018-19 H1, the revenue expenditure to capital expenditure ratio was 7.0 and 6.9 for centre and states, respectively as against budgeted ratio of 7.1 and 4.8, respectively. This implies that the quality of expenditure has not been compromised for centre so far notwithstanding worsening fiscal outcome in H1 (Chart 10). This augurs well for the long-term economic growth. Major beneficiaries of capital expenditure for centre have been ministries of civil aviation, railways along with road transport and highways. 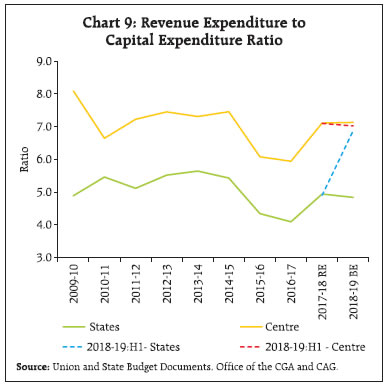
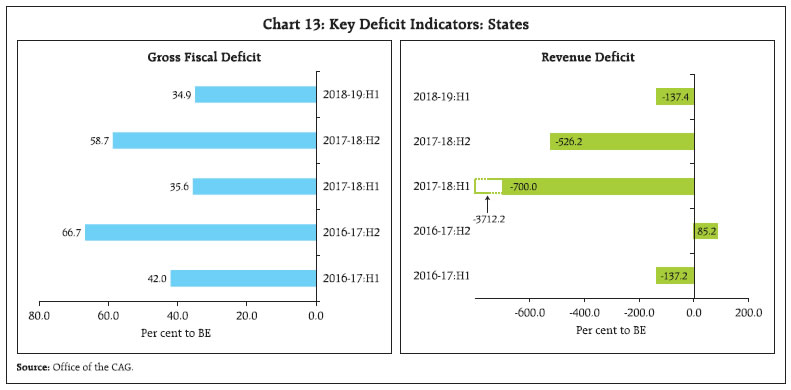
 Furthermore, though the ratio of states for H1 has deteriorated, capital expenditure of states in 2018-19:H1 relative to BE was higher than the corresponding period of the last year. Moreover, analysis shows that the states frontload revenue expenditure in the first half of the year while undertake capital expenditure in the second half of the year (Chart 11). d. Key Deficit Indicators As stated at the outset, with the central government deviating from the GFD target in 2017-18, government has budgeted a fiscal deficit target of 3.3 per cent for 2018-19 with the aim of consolidating government finances and achieving GFD of 3.0 per cent by 2020-21 as per the revised FRBM Act. In H1 of 2018-19, however, the fiscal deficit at 95.3 per cent of BE has been highest in comparison to past few years. The revenue deficit has crossed the budgeted target in H1 2018-19, though the government has discontinued targeting revenue deficit 2018-19 onwards (Chart 12). Furthermore, GFD has already crossed the BE target by October 2018 (Appendix, Table 1). As stated earlier, under Rule 7 of the FRBM Rules, 2004, Government is required to take appropriate corrective measures in case the outcome of the first half shows deterioration. Against the backdrop of high consolidated gross fiscal deficits – higher than the FRBM threshold – for the third consecutive year, states budgeted to consolidate their fiscal deficit at 2.6 per cent of GDP in 2018-19. In the first half of 2018-19, consolidated gross fiscal deficit at 1.8 per cent of GDP was at 34.9 per cent to BE, which was marginally lower than the corresponding period of the last year and preceding H2 (Chart 13). Generally, unlike central government, GFD for states in H2 remains higher than H1. It may be noted that 2018-19:H1 witnessed a surplus in revenue account supported by higher increase in revenue receipts relative to revenue expenditure (Appendix, Table 2). 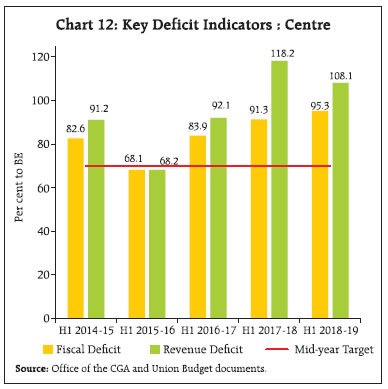
 The lower GFD in 2018-19:H1 relative to BE was largely due to surplus fiscal balance attained by two large states – Maharashtra and Uttar Pradesh, while they generally remain in deficit mode on an annual basis (Chart 14). Out of 24 states, only Bihar has crossed its BE and West Bengal is very close to BE; while 9 states are in surplus. IV. Financing of Fiscal Deficit Gross fiscal deficit (GFD) during April-September 2018 continued to be financed mainly through market borrowings (58.9 per cent), although its proportion in financing GFD has seen a decline. There was substantial disinvestment of surplus cash to the tune of 27.3 per cent of GFD as also recourse to Ways and Means Advances (WMAs) of ₹234.1 billion (3.9 per cent of GFD) at the end of H1 2018-19 not witnessed in previous two years (Table 2). Amount available under NSSF is also utilised for funding fiscal deficits of central and state governments through issuance of special central and state government securities. However, subsequent to 14th Finance Commission (FC) recommendation, more funds are available to Central government for funding its GFD and liabilities, as states have reduced recourse to borrowings from NSSF for financing their GFD. The limit of WMA was reduced from ₹700 billion in Q2 to ₹350 billion during October-February 2018-2019 and ₹250 billion for March 2019 in consultation with government of India. | Table 2: Financing the Gross Fiscal Deficit of Central Government | | (per cent of GFD) | | Components | Apr-Sep 2016-17 | Apr-Sep 2017-18 | Apr-Sep 2018-19 | | 1 | 2 | 3 | 4 | | Gross Fiscal Deficit (Amount in ₹ billion) | 4479.9 | 4989.4 | 5947.3 | | Market Borrowing | 65.5 | 76.3 | 58.9 | | State Provident Fund | 0.7 | 0.8 | 0.7 | | National Small Savings Fund | 13.6 | 10.9 | 10.4 | | Cash Balances {Decrease(+)/Increase(-)} | -0.8 | 1.0 | 0.2 | | Investment (-) / Disinvestment (+) of Surplus Cash | 32.3 | 13.9 | 27.3 | | External Assistance | 1.2 | 1.1 | -1.2 | | Ways and Means Advances | 0.0 | 0.0 | 3.9 | | Others * | -12.5 | -3.9 | -0.3 | * Includes items such as special deposits, suspense and remittances and other capital receipts.
Source: Office of the CGA. | The centre completed 34.8 per cent of its budgeted gross market borrowing during 2018-19 (April-September), lower than that in corresponding period of previous year. Gross and net market borrowings during this fiscal (till December 7, 2018) were lower than the corresponding period of last year (both in absolute amount as well as per cent to BE) (Table 3). Out of 24 states, 20 states17 have resorted to market borrowing so far. This constitutes around 30 per cent and 34 per cent of their budgeted gross and net market borrowing. State-wise data on borrowing indicates that states are so far within 60 per cent of their budget estimates. Some states like Punjab, Rajasthan, Sikkim and Uttarakhand have crossed 50 per cent of their budget estimates (Chart 15). During April-September 2018, thirteen states resorted to WMA, while four states availed the overdraft facility.18 Reflecting the market borrowing trend, the issuance of State Development Loans (SDLs) was moderate during H1:2018-19. State government market borrowings, however, are expected to go up in H2 due to redemption pressure arising out of past issuances. The weighted average spread of SDLs’ cut-off over the corresponding tenor G-sec yield moderated to 53 basis points (bps) in H1:2018-19 from 63 bps in H1:2017-18 (Chart 16). The average inter-state spread on securities of 10-year maturity during H1:2018- 19 was at four bps, lower than nine bps in H1:2017- 18, with the maximum inter-state spread at 23 bps on April 10, 2018. | Table 3: Market Borrowings of Central Government | | Item | 2018-19 (April- Dec 07 2018) | 2017-18 (April- Dec 08, 2017) | 2018-19 H1 (April- Sep 2018) | 2017-18 H1 (April- Sep 2017) | | 1 | 2 | 3 | 4 | 5 | | Gross Market Borrowings | 5314.0 | 5919.9 | 2760.0 | 3570.0 | | | (67.0) | (74.7) | (34.8) | (45.1) | | Net Market Borrowings | 3302.1 | 3584.3 | 1884.3 | 2343.0 | | | (82.7) | (87.4) | (47.2) | (57.2) | Note: Figure in parentheses indicate percentage to budgeted gross and net borrowings for FY. Market borrowings include market loans, switching of securities and 364 day T-bills
Source: RBI and Weekly Statistical Supplement, RBI. |
V. Going Forward This mid-year analysis provides a preliminary assessment of fiscal outcomes ahead of the interim budget by the centre on February 01, 2019. With its GFD during April-October 2018-19 at ₹6.5 trillion (103.9 per cent of the BE) as against the budgeted amount of ₹6.2 trillion, appropriate balancing to meet the targets set in the beginning of this year should be the key focus for the rest of the year. On the revenue side, an area of concern has been that GST collections are lagging behind targets. Going forward, however, lower prices (on account of GST rate cuts) and a higher compliance should reflect in higher GST revenues. On the expenditure side, the hike in minimum support prices (MSP), along with the increase in budget provisions for procurement by ₹150.5 billion and ₹100 billion by centre and four states (Uttar Pradesh, Haryana, Rajasthan and Telangana), respectively, will likely impose upside pressures, although the stress on union excise duties and petroleum subsidies might dissipate with the recent softening of crude oil prices and strengthening of the rupee. Notwithstanding these concerns, capital expenditure has not been compromised which augurs well for future growth. Going forward, the growth impulse through higher expenditure is likely to come from states as their combined revenue expenditure is still less than 50 per cent of BE in H1, and scope exists for higher expenditure in H2. Also, considering that states generally undertake capital expenditure in the second half of fiscal (as shown in Chart 11), an increase in the capital expenditure might also be witnessed in H2 of 2018-19. Moreover, even if states experience a shortfall in their own tax revenue (including SGST), it could be cushioned going forward on account of higher IGST apportionment and GST compensation cess. Moreover, states have some space, with their GFD-GDP ratio being 1.8 per cent in H1 2018-19 vis-à-vis the budgeted target of 2.6 per cent. The unfolding of the overall fiscal situation would hinge on revenue mobilisation efforts and overall macroeconomic conditions.
Appendix | Table 1: Union Government Accounts At A Glance | | (₹ Billion) | | Item | Financial Year | April- October | 2018-19
(Budget Estimates) | 2018-19
(Actuals) | 2017-18
(Actuals) | Percentage to Budget Estimates | | 2018-19 | 2017-18 | | | 1 | 2 | 3 | 4 | 5 | | 1. Revenue Receipts | 17,257.4 | 7,888.3 | 7,287.7 | 45.7 | 48.1 | | 2. Tax Revenue (Net) | 14,806.5 | 6,611.1 | 6,336.2 | 44.7 | 51.6 | | 3. Non-Tax Revenue | 2,450.9 | 1,277.2 | 951.5 | 52.1 | 33.0 | | 4. Capital Receipts | 7,164.8 | 6,677.6 | 5,638.8 | 93.2 | 89.4 | | 5. Recovery of Loans | 122.0 | 90.8 | 83.9 | 74.4 | 70.3 | | 6. Other Receipts | 800.0 | 101.0 | 301.7 | 12.6 | 41.6 | | 7. Borrowings and Other Liabilities | 6,242.8 | 6,485.8 | 5,253.2 | 103.9 | 96.1 | | 8. Total Receipts (1+4) | 24,422.1 | 14,565.9 | 12,926.5 | 59.6 | 60.2 | | 9. Revenue Expenditure | 21,417.7 | 12,794.9 | 11,298.5 | 59.7 | 61.5 | | of which : | | | | | | | (i) Interest Payments | 5,758.0 | 2,920.9 | 2,579.1 | 50.7 | 49.3 | | 10. Capital Expenditure | 3,004.4 | 1,771.0 | 1,628.0 | 58.9 | 52.5 | | 11. Total Expenditure (9+10) | 24,422.1 | 14,565.9 | 12,926.5 | 59.6 | 60.2 | | 12. Revenue Deficit (9-1) | 4,160.3 | 4,906.7 | 4,010.9 | 117.9 | 124.9 | | 13. Fiscal Deficit {11-(1+5+6)} | 6,242.8 | 6,485.8 | 5,253.2 | 103.9 | 96.1 | | 14. Gross Primary Deficit {13-9(i)} | 484.8 | 3,564.9 | 2,674.1 | 735.3 | 1,140.2 | | Source: Controller General of Accounts, Ministry of Finance, Government of India and Union Budget 2018-19. |
| Table 2: Budgetary Position of States during April-September, 2018 | | | (₹ billion) | (Per cent) | | Actuals | Budget Estimates | Per cent to BE | Growth Rate | | Apr.-Sept, 2018 | Apr.-Sept, 2017 | 2018-19 BE | 2017-18 BE | Apr.-Sept, 2018 | Apr.-Sept, 2017 | Apr.-Sept, 2018 | Apr.-Sept, 2017 | | 1 | 2 | 3 | 4 | 5 | 6 | 7 | 8 | 9 | | I. REVENUE RECEIPTS | 10160.6 | 8949.0 | 26064.9 | 23332.9 | 39.0 | 38.4 | 13.5 | 13.6 | | a) Tax Revenue | 7682.2 | 6905.7 | 18837.7 | 16750.6 | 40.8 | 41.2 | 11.2 | 14.4 | | b) Non-Tax Revenue | 725.8 | 585.5 | 2153.2 | 1862.8 | 33.7 | 31.4 | 24.0 | 14.1 | | c) Grant in aid and Contributions | 1752.6 | 1458.2 | 5074.1 | 4719.5 | 34.5 | 30.9 | 20.2 | 9.8 | | II. CAPITAL RECEIPTS | 79.7 | 21.2 | 591.2 | 490.9 | 13.5 | 4.3 | 276.4 | -35.8 | | a) Recovery of Loans and Advances | 71.9 | 20.6 | 579.3 | 489.1 | 12.4 | 4.2 | 248.9 | -32.9 | | b) Other Receipts | 7.8 | 0.6 | 11.9 | 1.8 | 65.4 | 30.9 | 1272.6 | -75.0 | | III. Revenue Expenditure | 10341.5 | 9248.4 | 25933.2 | 23324.9 | 39.9 | 39.7 | 11.8 | 13.2 | | Of which: interest payments | 1048.7 | 995.6 | 2809.4 | 2578.1 | 37.3 | 38.6 | 5.3 | 17.2 | | IV. Capital Expenditure | 1493.3 | 1236.6 | 5290.6 | 4757.6 | 28.2 | 26.0 | 20.8 | -19.1 | | (a) Capital Outlay | 1346.0 | 1151.0 | 4928.1 | 4446.2 | 27.3 | 25.9 | 16.9 | -13.3 | | (b) Loans and Advances disbursed | 147.3 | 85.7 | 362.5 | 311.4 | 40.6 | 27.5 | 71.9 | -57.1 | | V. Revenue Deficit | 180.9 | 299.4 | -131.7 | -8.1 | -137.4 | -3712.2 | -39.6 | 3.3 | | VI. Fiscal Deficit | 1594.6 | 1514.8 | 4567.7 | 4258.6 | 34.9 | 35.6 | 5.3 | -15.1 | Note: (1) Data pertain to 24 states.
(2) Data are unaudited and provisional.
(3) Interest payment is for 23 states (Punjab is excluded).
Source: Comptroller and Auditor General of India (CAG). |
|