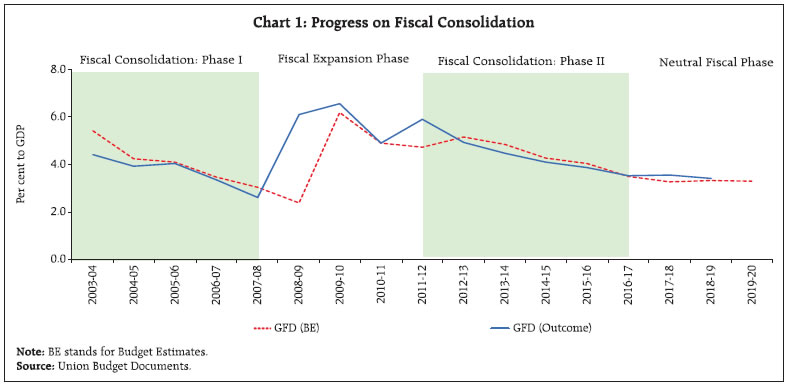
The Union Budget for 2019-20 aimed at striking an optimal balance between fiscal discipline and economic growth in a challenging environment amidst notable deceleration in GDP growth since the second half of 2018-19. Given the expenditure priorities for boosting physical and social infrastructure and stimulating investment activity in the economy, the Budget aims at mobilising higher resources through non-tax revenues and disinvestment, with direct taxes expected to remain more buoyant, as in 2018-19. Fiscal transparency was enhanced significantly with the release of information on extra budgetary resources. Greater buoyancy in GST collections would be critical to achieve fiscal consolidation while meeting expenditure priorities for growth. Introduction This article analyses the key features of the Union Budget 2019-20 presented on July 05, 2019. Set against an adverse global environment characterised by weak growth momentum and lacklustre trade activity coupled with deceleration in domestic GDP growth in the second half of 2018-19, the Union Budget 2019-20 rightly prioritises growth and sets the goal of raising India’s GDP to US$3 trillion by end- March 2020 and further to US$5 trillion by end-March 2025. Accordingly, the Budget has laid emphasis on boosting investments, mainly in infrastructure, while simultaneously also focussing on the rural economy, micro, small and medium enterprises (MSMEs) along with start-ups (Annex 1). It aims at balancing fiscal prudence with expenditure commitments. Going forward, higher revenue buoyancy in Goods and Services Tax (GST) collections would be critical to more meaningful fiscal consolidation. Against this background, the rest of the article is divided into seven sections. Section II discusses the gross fiscal deficit trajectory against the Fiscal Responsibility and Budget Management (FRBM) glide path, while section III examines the receipt side of central government finances. Section IV deals with government spending and Section V highlights financing pattern of gross fiscal deficit. Section VI reflects upon outstanding liabilities of the government and Section VII presents an analysis of resource transfers from the centre to states. Section VIII sets out concluding observations. II. Budgeted Fiscal Deficit shows Commitment to Fiscal Consolidation The revised Fiscal Responsibility and Budget Management (FRBM) architecture is structured around two types of fiscal rules based on sequenced calibration viz., the fiscal anchor and the operational rule. The fiscal anchor ascertains fiscal sustainability. In general, the debt-to-GDP ratio acts as the fiscal anchor. The operational rule is calibrated from the final objective with a foreseeable link with the fiscal anchor (Eyraud and Wu, 2015; IMF, 2018). The government has demonstrated commitment to fiscal rectitude as per the glide path set under the transformed FRBM - aiming at a gross fiscal deficit to gross domestic product (GFD-GDP) ratio of 3.0 per cent by 2020-21 (as the operational target) and debt- GDP ceilings of 60 per cent and 40 per cent for the general government and the central government, respectively, by 2024-25 (as the fiscal anchor). Towards achieving these targets, the Union Budget 2019-20 places the fiscal deficit for 2019-20 at 3.3 per cent of GDP as against 3.4 per cent achieved in 2018-19 (Provisional Accounts). It, therefore, marks a modest consolidation over 2018-19 (Table 1). Compared with the progress on fiscal consolidation achieved during 2012-13 to 2016-17, however, gross fiscal deficit (GFD) as percentage to GDP has remained almost at similar levels since 2017-18 (Chart 1). Actual outcomes, however, have clearly tracked budgeted deficit numbers since 2012-13. | Table 1: Key Indicators (as per cent to GDP) | | | 2017-18 | 2018-19 | 2019-20 | 2020-21 | 2021-22 | | Actuals | BE | RE | PA | BE (Interim) | BE (Final) | MTFP Target | | Jul 5, 2019 | Feb 1, 2018 | Jul 5, 2019 | May 31, 2019 | Feb 1, 2019 | Jul 5, 2019 | Jul 5, 2019 | Jul 5, 2019 | | 1 | 2 | 3 | 4 | 5 | 6 | 7 | 8 | 9 | | 1. Fiscal Deficit | 3.5 | 3.3 | 3.3 | 3.4 | 3.3 | 3.3 | 3.0 | 3.0 | | 2. Revenue Deficit | 2.6 | 2.2 | 2.2 | 2.3 | 2.2 | 2.3 | 1.9 | 1.7 | | 3. Primary Deficit | 0.4 | 0.3 | 0.2 | 0.3 | 0.2 | 0.2 | 0.0 | 0.0 | | 4. Gross Tax Revenue | 11.2 | 11.9 | 11.8 | 10.9 | 12.1 | 11.7 | 11.6 | 11.6 | | 5. Non-Tax Revenue | 1.1 | 1.3 | 1.3 | 1.3 | 1.3 | 1.5 | 1.4 | 1.4 | | 5. Revenue Expenditure | 11.0 | 11.3 | 11.3 | 10.6 | 11.6 | 11.6 | - | - | | 6. Capital Expenditure | 1.5 | 1.6 | 1.7 | 1.6 | 1.6 | 1.6 | - | - | BE: Budget Estimates; RE: Revised Estimates; PA: Provisional Accounts; MTFP: Medium Term Fiscal Policy.
Note: Going by the principle of using latest GDP data for any year, nominal GDP used for 2018-19 is as per Provisional Estimate for 2018-19 viz., ₹190 lakh crore, released by CSO on May 31, 2019. For 2019-20, nominal GDP used is ₹211 lakh crore, released in the Union Budget 2019-20 on July 5, 2019. In view of this, the fiscal indicators as per cent to GDP given in this Table may at times marginally vary from those reported in the Union Budget documents.
Source: Union Budget Documents. |
 A major driver of budgeted fiscal consolidation in 2019-20 is higher non-tax revenues, which are budgeted to increase from 1.3 per cent in 2018-19 (PA) to 1.5 per cent of GDP in 2019-20 (BE) and are further slated to rise post higher surplus transfer by the Reserve Bank of India1. The decomposition of GFD shows that the revenue deficit is budgeted to rise in 2019-20 and would pre-empt 69 per cent of the borrowed resources as against 59 per cent in 2016-17 (Chart 2). III. Receipts Given the need to boost infrastructure and other investments, the Union Budget 2019-20 aims at mobilising higher resources through non-tax revenues and disinvestment, with direct taxes continuing to be a major contributor, as in 2018-19. This is expected to be aided by higher collections from customs duties and union excise duties. Additionally, proceeds from cesses and surcharges, which are not part of the divisible pool of shared taxes, have been budgeted to increase from 3.0 per cent of gross tax revenues of the centre realised in 2000-01 to 15 per cent in 2019-20 (Chart 3). Tax Revenues and Tax Buoyancy Tax buoyancy, which reflects the effects of both automatic stabilisers and discretionary policy changes, is a key determinant of fiscal space as well as fiscal consolidation. In 2018-19, the tax buoyancy was budgeted at 1.64. The revised estimates, however, indicated that it was lower at 1.53, while the Provisional Accounts (PA) indicated a much lower realised buoyancy of 0.75, which can be almost entirely explained by shortfall in GST collections2. The budgeted tax buoyancy at 1.67 for 2019-20 is not only higher than the long-term average (1.02) but also more than double the size of realised buoyancy in 2018-19 (PA) (Chart 4). On the direct taxes front, buoyancy of personal income tax has been budgeted higher at 1.86 in 2019- 20 than the realised buoyancy of 1.17 in 2018-19 (PA). For 2019-20, corporation tax buoyancy is budgeted at 1.40, which is lower than that realised in 2018-19 (PA), albeit higher than the long-term average. Among indirect taxes, buoyancy of customs duties and excises duties are budgeted at 2.9 and 2.7, respectively, much above their long-term averages. With the downward revision in GST collections relative to the Interim Budget, budgeted buoyancy of GST now looks more realistic. Direct Taxes Budgeted at 6.3 per cent of GDP during 2019-20, direct tax collections are expected to be higher than the realised figure for 2018-19 (PA) at 6.0 per cent of GDP, despite the proposed extension of the lower corporate tax rate benefit to more firms3. A cross country analysis shows that the effective corporate tax in India was relatively lower than that in other countries earlier but has increased during this decade (Chart 5). Direct tax collections have been faring well, particularly during the current decade, and as a result their share in GDP has increased from 3.2 per cent in 2000-01 to 6.0 per cent in 2018-19 (PA). They are budgeted to grow at 17.4 per cent in 2019-20 as against 13.5 per cent in 2018-19 (PA) (Table 2).
Higher budgeted direct taxes primarily reflect higher budgeted income tax collections, particularly resulting from measures taken towards simplification of filing of returns, interchangeability of Permanent Account Number (PAN) and AADHAAR, pre-filled income tax returns and faceless e-assessment, besides the impact of proposed increase in surcharges, notwithstanding recent reversal of one of the surcharge proposals. The Union Budget also provides a slew of tax relief measures for sectors like affordable housing, start-ups, Non-Banking Financial Companies (NBFCs) and International Financial Services Centres (IFSCs). | Table 2: Tax Revenue of Central Government | | | ₹ Thousand Crore | Growth Rate (per cent) | | 2017-18 | 2018-19 (RE) | 2018-19 (PA) | 2019-20 (BE) | 2018-19 (RE) | 2018-19 (PA) | 2019-20 (BE) | | Jul 5, 2019 | Jul 5, 2019 | May 31, 2019 | Jul 5, 2019 | Col. 3 over Col 2 | Col. 4 over Col. 2 | Col. 5 over Col. 3 | Col. 5 over Col. 4 | | 1 | 2 | 3 | 4 | 5 | 6 | 7 | 8 | 9 | | 1. Direct tax | 1,002 | 1,200 | 1,137 | 1,335 | 19.8 | 13.5 | 11.3 | 17.4 | | of which: | | | | | | | | | | i. Income tax | 408 | 518 | 462 | 556 | 26.9 | 13.1 | 7.4 | 20.5 | | ii. Corporation tax | 571 | 671 | 664 | 766 | 17.5 | 16.2 | 14.2 | 15.4 | | 2. Indirect tax | 917 | 1,048 | 943 | 1,126 | 14.3 | 2.9 | 7.4 | 19.4 | | of which: | | | | | | | | | | i. GST | 443 | 644 | 582 | 663 | 45.5 | 31.4 | 3.0 | 14.1 | | CGST | 203 | 504 | 458 | 526 | 147.9 | 125.1 | 4.4 | 15.0 | | IGST | 177 | 50 | 29 | 28 | -71.7 | -83.6 | -44.0 | -3.3 | | Compensation cess | 63 | 90 | 95 | 109 | 43.7 | 51.9 | 21.5 | 15.0 | | ii. Customs | 129 | 130 | 118 | 156 | 0.8 | -8.6 | 19.9 | 32.2 | | iii. Excise | 259 | 260 | 231 | 300 | 0.1 | -11.0 | 15.6 | 29.9 | | 3. Gross Tax Revenue (1+2) | 1,919 | 2,248 | 2,080 | 2,461 | 17.2 | 8.4 | 9.5 | 18.3 | Note: Some growth rate calculations may not be immediately apparent from figures in concerned tables because calculation are based on exact figure taken from the union Budget documents.
Source: Union Budget Documents. | Indirect Taxes For the year 2019-20, indirect tax collections are budgeted to grow by 19.4 per cent as against 2.9 per cent in 2018-19 (PA). Higher collections under union excise and customs duties are budgeted on account of measures like increase in special additional excise duty and road and infrastructure cess, each by one rupee a litre on petrol and diesel, coupled with an increase in customs duty on gold and other precious metals from 10 per cent to 12.5 per cent. Although lower than budgeted, Goods and Services Tax (GST) collections increased in 2018-19 over 2017-18 despite teething problems and rationalisation of GST rates across sectors and items during the year, resulting in lower effective GST rate. Against this backdrop, the GST collections have been budgeted at ₹663 thousand crore, lower than ₹761 thousand crore announced in the Interim Budget on February 01, 2019. Comparing GST collections in 2017-18 and 2018-19 against similar bucket of taxes in 2016-17 shows that the share of GST collections as per cent of total revenue and non-debt capital receipts has improved marginally, while the share of direct taxes have exhibited maximum improvement (Chart 6a). Nonetheless, month-wise GST collections in recent months reflect the impact of deceleration in nominal GDP growth (Chart 6b). The GST architecture, however, requires significant administrative reforms, and ways to deal with IT related glitches viz., putting in place an invoice matching system along with mitigation of system design deficiencies and proposed simplification of GST processes, among others, so as to reap the complete benefit of this game-changing tax reform (CAG, 2019). 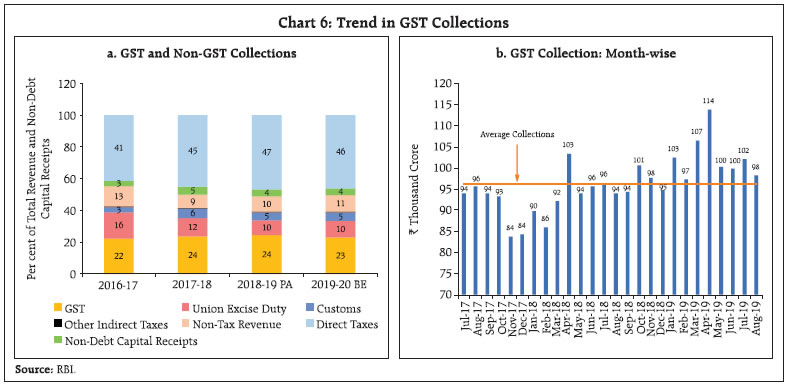 Non-Tax Revenues In a break from the past, non-tax revenues have helped in meeting revenue requirements, especially during the previous two years. Following this trend, receipts from non-tax revenues are budgeted to increase in 2019-20 by 27.2 per cent as against 27.7 per cent growth in the previous year. Surplus transfers from the RBI/banks/Financial Institutions (FIs) are budgeted to increase by ₹32 thousand crore in 2019-20 (Table 3). This is slated to increase further post higher surplus transfer from RBI4. | Table 3: Dividends and Profits | | | ₹ Thousand Crore | Growth Rate (per cent) | | 2017-18 | 2018-19 (RE) | 2019-20 (BE) | 2017-18 | 2018-19 (RE) | 2019-20 (BE) | | 1 | 2 | 3 | 4 | 5 | 6 | 7 | | Dividend and Profits | 91 | 119 | 164 | -25.7 | 30.5 | 37.1 | | From PSEs | 46 | 45 | 57 | -10.3 | -3.0 | 27.4 | | From RBI/ Banks/FIs | 45 | 74 | 106 | -37.0 | 65.3 | 43.0 | PSEs: Public Sector Enterprises; FIs: Financial Institutions.
Source: Union Budget Documents. | Non-debt Capital Receipts Non-debt capital receipts have also been a significant source of revenue in recent years. The target for disinvestment, which was pegged at ₹80 thousand crore in 2018-19 (BE), has been exceeded by ₹5,045 crore in 2018-19 (PA) (Chart 7). Continuing with the disinvestment drive, the Union Budget aims at mobilising substantial amount of resources from disinvestment with a special emphasis on strategic sales. Consequently, the target for disinvestment is set at ₹105 thousand crore for 2019-20 (BE). IV. Expenditure Pattern and Priorities In the decade gone by, centre’s expenditure as a per cent to GDP was declining even as the general government expenditure continued to increase due to pressure on states’ spending, particularly since 2015-16, mostly led by Ujwal DISCOM Assurance Yojana (UDAY). For 2019-20, if the budgeted expenditure is realised, centre’s total expenditure as per cent to GDP at 13.2 per cent will register an increase for the first time in last ten years. Revenue expenditure is budgeted to grow at a higher rate than capital expenditure, reflective of higher allocations for the agricultural sector in line with government’s pro-rural focus and many central sector/centrally sponsored schemes (Table 4). A cross country analysis of general government expenditure relative to per capita income suggests that high-income countries tend to have larger government expenditure as a share of their GDP, and it is more focussed on social protection (Ortiz-Ospina and Roser, 2019)5. Compared with its emerging market peers, India has a relatively higher spending in comparison to its per capita income, though lower than other BRICS nations (Chart 8). Some emerging market economies also have an expenditure linked fiscal rule in place with the ceilings on expenditure-to-GDP ratio being in the range of 30 to 40 per cent of GDP (IMF, 2018)6. | Table 4: Expenditure of Central Government | | Item | ₹ Thousand Crore | Growth Rate (per cent) | | 2017-18 | 2018-19 (RE) | 2018-19 (PA) | 2019-20 (BE) | 2018-19 (RE) | 2018-19 (PA) | 2019-20 (BE) | | Jul 5, 2019 | Jul 5, 2019 | May 31, 2019 | Jul 05, 2019 | Col. 3 over Col. 2 | Col. 4 over Col. 2 | Col. 5 over Col. 3 | Col. 5 over Col. 4 | | 1 | 2 | 3 | 4 | 5 | 6 | 7 | 8 | 9 | | 1. Total Expenditure | 2,142 | 2,457 | 2,311 | 2,786 | 14.7 | 7.9 | 13.4 | 20.5 | | 2. Revenue Expenditure (of which) | 1,879 | 2,141 | 2,009 | 2,448 | 13.9 | 6.9 | 14.3 | 21.9 | | (i) Interest Payments | 529 | 588 | 583 | 661 | 11.1 | 10.2 | 12.4 | 13.4 | | (ii) Major Subsidies | 191 | 266 | 197 | 302 | 39.2 | 3.1 | 13.3 | 53.1 | | Food | 100 | 171 | 102 | 184 | 70.8 | 1.6 | 7.5 | 80.8 | | Fertilizer | 67 | 70 | 71 | 80 | 5.4 | 6.2 | 14.1 | 13.3 | | Petroleum | 25 | 25 | 25 | 38 | 1.5 | 0.4 | 50.9 | 52.6 | | (iii) MGNREGA | 55 | 61 | - | 60 | 10.7 | - | -1.8 | - | | (iv) PM-KISAN | - | 20 | - | 75 | - | - | 275.0 | - | | (v) Defence (Revenue) | 186 | 191 | 196 | 202 | 2.8 | 5.3 | 5.5 | 3.0 | | 3. Capital Expenditure | 263 | 317 | 303 | 339 | 20.3 | 15.1 | 6.9 | 11.8 | | Source: Union Budget Documents. |
 Total expenditure of the centre has been budgeted to grow by 20.5 per cent (to ₹27.9 lakh crore) in 2019-20 as against 7.9 per cent growth recorded in 2018-19 (PA). Revenue expenditure is budgeted to grow at a higher rate than capital expenditure, mainly due to higher allocations for the agriculture sector by 26.8 per cent over the previous year. This has been done with a dual objective of alleviating rural distress on the one hand, and, providing a boost to rural consumption demand on the other. Related measures include Pradhan Mantri Kisan Samman Nidhi (PM-KISAN) under which income support at the rate of ₹6,000 per year to farmer families has been extended to all farmers. Higher allocations have also been made for Pradhan Mantri Gram Sadak Yojana (PMGSY), Ayushman Bharat and National Education Mission (NEM) with a view to promote physical and social infrastructure in the country (Table 5). It is noteworthy that for the union government, spending pattern is inclined more towards revenue expenditure, which exhibits downward rigidity. In thirteen out of last fifteen years, the share of revenue expenditure has been over 85 per cent of the total expenditure. In 2019-20, the share of revenue expenditure is budgeted at 87.8 per cent of the total. This leaves limited legroom to enhance capital spending which is estimated to have higher multiplier effects than revenue expenditure in boosting growth, by crowding-in private investment (RBI, 2019). Due to higher capital expenditure growth and pruning of revenue expenditure in 2018-19 (PA), there was some improvement in revenue to capital expenditure ratio (Chart 9). | Table 5: Expenditure on Major Government Schemes | | Item | ₹ Thousand Crore | Per cent to Total Expenditure | Growth Rate (per cent) | | 2017-18 | 2018-19 (RE) | 2019-20 (BE) | 2018-19 (RE) | 2019-20 (BE) | 2018-19 (RE) | 2019-20 (BE) | | 1 | 2 | 3 | 4 | 5 | 6 | 7 | 8 | | A. Central Sector Schemes | | | | | | | | | 1. PM-KISAN | – | 20 | 75 | 0.81 | 2.69 | – | 275.0 | | 2. Pradhan Mantri Shram Yogi Maandhan | – | 0 | 0.5 | 0.00 | 0.02 | – | – | | 3. Deen Dayal Upadhyaya Gram Jyoti Yojana | 5 | 3.8 | 4.1 | 0.15 | 0.15 | -24.8 | 7.0 | | 4. Ujjwala Yojana | 2.3 | 3.2 | 2.7 | 0.13 | 0.10 | 42.1 | -14.9 | | 5. Road Works | 36.8 | 40.9 | 45.9 | 1.66 | 1.65 | 11.0 | 12.2 | | 6. Sagarmala | 0.5 | 0.4 | 0.6 | 0.02 | 0.02 | -20.5 | 44.3 | | 7. National River Conservation Programme | 0.7 | 1.6 | 1.2 | 0.07 | 0.04 | 124.0 | -24.7 | | B. Centrally Sponsored Schemes | | | | | | | | | 1. MGNREGA | 55.2 | 61.1 | 60.0 | 2.49 | 2.15 | 10.7 | -1.8 | | 2. Ayushman Bharat | – | 2.4 | 6.4 | 0.10 | 0.23 | – | 166.7 | | 3. PM Krishi Sinchayi Yojana | 6.6 | 8.3 | 9.7 | 0.34 | 0.35 | 24.8 | 17.3 | | 4. PM Gram Sadak Yojana | 16.9 | 15.5 | 19.0 | 0.63 | 0.68 | -8.1 | 22.6 | | 5. PM Awas Yojana | 31.2 | 26.4 | 25.9 | 1.07 | 0.93 | -15.3 | -2.1 | | 6. Swachh Bharat Mission | 19.4 | 17.0 | 12.6 | 0.69 | 0.45 | -12.6 | -25.5 | | 7. National Health Mission | 32.0 | 31.2 | 33.7 | 1.27 | 1.21 | -2.5 | 7.9 | | 8. National Education Mission | 29.5 | 32.3 | 38.5 | 1.32 | 1.38 | 9.8 | 19.2 | – : Not applicable.
Source: Union Budget Documents. | Subsidies and Interest Payments Subsidies and interest payments constitute over 40 per cent of government’s revenue expenditure. In 2017-18 and 2018-19 (PA), although the actual expenditure incurred on major subsidies was lower than the budget estimates, the same has been budgeted higher in 2019-20 in line with previous years (Table 4). The government aims to cut down its expenditure on subsides in the medium term by leveraging the direct benefit transfer (DBT) system to plug leakages through better targeting. An analysis of expenditure incurred on food subsidy reveals that prior to 2016-17, actual expenditure on food subsidy was consistently higher than the budgeted amount. However, since 2016-17 the pattern has reversed (Chart 10). This lower expenditure on food subsidy vis-à-vis the budgeted amount in the last three years reflects the Food Corporation of India (FCI) resorting to borrowings from the National Small Savings Fund (NSSF) (Chart 11). Capital Expenditure On top of an increase of 15.1 per cent during 2018-19 (PA), capital expenditure is budgeted to increase further by 11.8 per cent in 2019-20. However, as a per cent to GDP, it remains pegged at 1.6 per cent of GDP. Capital expenditure for defence is budgeted to increase by 10 per cent to ₹103 thousand crore in 2019-20(BE). For major infrastructure, capital expenditure is estimated to grow moderately by 8.8 per cent in 2019-20 (BE) - as against a significant increase of about 23.9 per cent in 2018-19 (RE) - led by railways, which is also encouraged to tap market borrowings and pursue asset monetisation. Other sectors, which witnessed an increase are roads and bridges, communication and irrigation (Table 6). 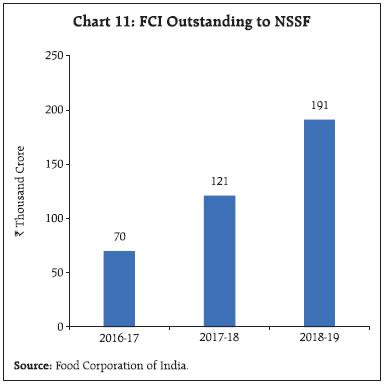
| Table 6: Capital Expenditure | | | ₹ Thousand Crore | Growth Rate (per cent) | | 2016-17 | 2017-18 | 2018-19 (RE) | 2019-20 (BE) | 2017-18 | 2018-19 (RE) | 2019-20 (BE) | | 1 | 2 | 3 | 4 | 5 | 6 | 7 | 8 | | 1. Total Capital Expenditure | 285 | 263 | 317 | 339 | -7.5 | 20.3 | 6.9 | | 2. Defence | 86 | 90 | 94 | 103 | 4.7 | 3.9 | 10.0 | | 3. Capital Expenditure (excluding defence) | 198 | 173 | 223 | 235 | -12.9 | 28.9 | 5.6 | | (i) Major Infrastructure | 102 | 108 | 134 | 146 | 5.8 | 23.9 | 8.8 | | Irrigation | 0.1 | 0.3 | 0.3 | 0.3 | 236.7 | 3.9 | 9.4 | | Energy | 7 | 5 | 9 | 7 | -32.5 | 94.3 | -25.4 | | Indian Railways | 45 | 43 | 53 | 66 | -4.0 | 22.2 | 24.1 | | Roads & Bridges | 44 | 54 | 64 | 68 | 22.3 | 20.0 | 6.0 | | Civil Aviation | 3 | 2 | 4 | 0.03 | -32.2 | 117.8 | -99.4 | | Ports and Light Houses | 0.3 | 0.2 | 0.2 | 0.3 | -45.8 | 4.1 | 42.6 | | Communications | 3 | 5 | 4 | 5 | 29.6 | -19.8 | 37.3 | | (ii) Industry & Minerals | 6 | 5 | 5 | 6 | -16.7 | -4.9 | 28.1 | | (iii) Science, Technology and Environment | 5 | 5 | 7 | 9 | 2.6 | 34.2 | 20.5 | | (iv) Others | 84 | 54 | 76 | 74 | -36.2 | 41.7 | -2.9 | | Source: Union Budget Documents. | Extra Budgetary Resources (EBRs) In addition to the capital spending made from the Union Budget (Gross Budgetary Support), Central Public Sector Undertakings (CPSUs) and commercial departmental undertakings incur a significant amount of capital expenditure from their own sources, known as internal and extra budgetary resources (IEBR). While earlier the amount of capital spending through IEBR used to be lesser than the gross budgetary support, since 2014-15, this trend has reversed, with capital spending by CPSUs exceeding the amounts budgeted for capital expenditure (Chart 12). A holistic perspective of aggregate capital expenditure by the public sector, thus, must include capital spending by CPSUs, particularly through EBR (Box 1). V. GFD Financing- Major Sources Gross market borrowing, which is the major source of financing, is budgeted at ₹710 thousand crore for 2019-20, which is 24.3 per cent higher than the preceding year’s level. Net market borrowings at ₹473 thousand crore, however, is estimated to increase by 11.9 per cent during the same period. Net borrowings through dated securities will cover 67.2 per cent of GFD in 2019-20 (BE) compared with 66.6 per cent of GFD in 2018-19 (RE) (Table 7). Box 1: Extra Budgetary Resources (EBR) raised through Government of
India-Fully Serviced Bonds (GoI-FSB) In last three years, some CPSUs have raised resources from the market by issuing Government of India-Fully Serviced Bonds (GoI-FSB) for which the repayment of both principal and interest is to be done from the Budget (Chart 1.1). As announced in the Interim Budget 2019-20, a mechanism for budgeting for EBRs has been operationalised from Union Budget 2019-20 presented on July 5, 2019. As at end-March 2019, total outstanding liabilities on account of EBRs were 0.5 per cent of GDP and by end-March 2020 they have been budgeted at 0.7 per cent of GDP. The government aims to reduce accretions to the EBR stock to zero in five years’ time. Some of the government schemes for which proceeds from EBRs have been utilised so far are Pradhan Mantri Krishi Sinchayee Yojana (PMKSY), Deen Dayal Upadhayay Gram Jyoti Yojana (DDUGJY), Swachh Bharat Mission (SBM), Pradhan Mantri Awas Yojana (PMAY), among others. The sectoral share of utilisation of funds raised through EBRs during 2016-19 shows that maximum amount has been raised for power sector projects (32 per cent), followed by rural development projects (30 per cent), housing (23 per cent), water resources (12 per cent), renewable energy (2 per cent) and shipping (1 per cent) (Chart 1.2). Institution-wise break up of borrowings made through EBR route reveals that the top three borrowers are National Bank for Agriculture and Rural Development (NABARD), which has borrowed for both rural development and irrigation projects, followed by Housing and Urban Development Corporation (HUDCO) for housing projects and Rural Electrification Corporation (REC) for electrification projects. The release of information on EBRs in the public domain through the Union Budget 2019-20, has significantly enhanced fiscal transparency in India. 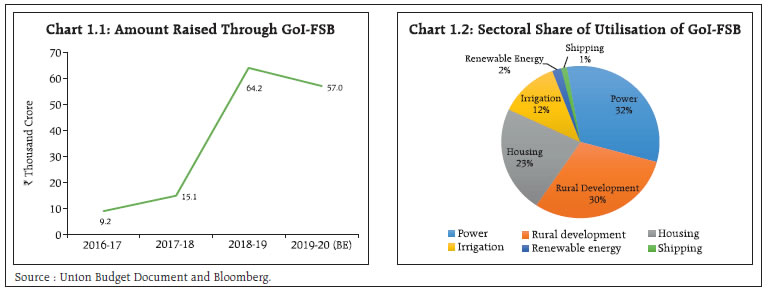 |
| Table 7: GFD Financing | | (Amount in ₹ Thousand Crore) | | Item | 2017-18 (Actual) | 2018-19 (RE) | 2019-20 (BE) | | 1 | 2 | 3 | 4 | | Gross Fiscal Deficit | 591 | 634 | 704 | | | (100.0) | (100.0) | (100.0) | | Financed by | | | | | Net Market Borrowings | 451 | 423 | 473 | | | (76.3) | (66.6) | (67.2) | | Net treasury bills | 45 | 25 | 25 | | | (7.6) | (3.9) | (3.6) | | NSSF | 103 | 125 | 130 | | | (17.4) | (19.7) | (18.5) | | External Assistance | 8 | -5 | -3 | | | (1.3) | -(0.8) | -(0.4) | | State Provident Fund | 16 | 17 | 18 | | | (2.7) | (2.7) | (2.6) | | Reserve Fund | 18 | -15 | -0.9 | | | (3.1) | -(2.3) | -(0.1) | | Deposits and Advances | 25 | 16 | 14 | | | (4.3) | (2.5) | (1.9) | | Draw Down of Cash Balances | 4 | 41 | 51 | | | (0.7) | (6.5) | (7.3) | | Others | -79 | 7 | -3 | | | -(13.3) | (1.1) | -(0.5) | Notes: 1. Net market borrowings include borrowings through dated securities only.
2. Net treasury bills include borrowings through 91-day, 182-day, 364-day and all other treasury bills.
3. Others include buyback of securities, switching off of securities, saving bonds, relief bonds etc.
4. Figures in parenthesis are per cent to GFD.
Source: Union Budget Documents. | The Union Budget, has also provided for switches (gross) and buyback of securities for ₹50 thousand crore, each. Gross issuance of cash management bills (CMBs) of ₹1 lakh crore for cash management operations has also been provided for. However, there are no net issuances of CMB and no allocation under the Market Stabilisation Scheme (MSS) for 2019-20 (BE). VI. Outstanding Liabilities An important component of the fiscal rule - the general government outstanding liabilities as per cent to GDP- shows that at 68.47 per cent, India’s debt to GDP ratio was higher than many emerging market peers in 2017-18 (Chart 13). India’s public debt, however, is largely denominated in rupees and is also of a relatively longer maturity. The rate of growth of nominal GDP has also exceeded annual growth in liabilities of the central government, contributing to the declining trend of centre’s outstanding liabilities as per cent to GDP (Chart 14). 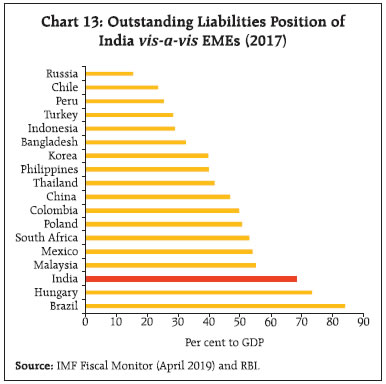 Total liabilities-GDP ratio of the central government is budgeted to decline to 48.6 per cent in 2019-20 from 49.4 per cent in 2018-19 (RE) and further to 44.4 per cent in 2021-22 (Table 8). It may be noted that unlike fiscal deficit numbers, the debt projections are higher than that given in the Interim Budget for 2019-20 and the targets set by Medium Term Fiscal Policy Statement (MTFP) in 2018-19 budget. The Union Budget has taken a major step towards enhancing fiscal transparency by explicitly showing the extra budgetary liabilities in the MTFP, which are projected to rise from 0.7 per cent in 2019-20 (BE) to 0.9 per cent of GDP by 2021-22. Interest payments as a proportion of revenue receipts (which is an indicator of debt servicing capacity), which witnessed an increase in 2018-19 (PA) has been budgeted to improve marginally in 2019-20 (Chart 15). 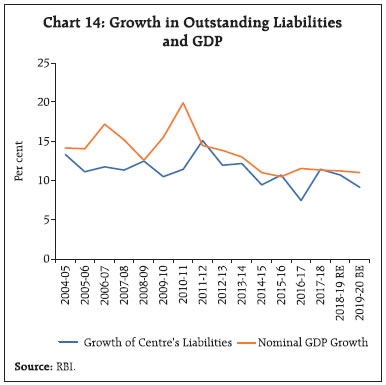
| Table 8: Outstanding Liabilities | | (Per cent to GDP) | | | Central Government Debt | of which EBR* | | 2017-18 | 49.7 | 0.1 | | 2018-19 (RE) | 49.4 | 0.5 | | 2019-20 (BE) | 48.6 | 0.7 | | 2020-21 P | 46.2 | 0.8 | | 2021-22 P | 44.4 | 0.9 | *:The target is to reduce the accretions to the EBR stock to zero in five years’ time.
Note: P stands for projected; EBR stands for Extra-Budgetary Resources.
Source: Union Budget Doucments; RBI. |
VII. Resource Transfers from the Centre to States in 2019-20 Gross transfers to states from the centre as per cent to GDP is expected to decelerate by about 30 basis points in 2019-20 vis-à-vis 2018-19 (RE), largely attributed to slower growth projected for the divisible pool of taxes (Chart 16a and b).8 Specific purpose transfers by central ministries under various centrally sponsored schemes and central sector schemes, which account for one-fourth of the gross transfer, is slated to decelerate to 6.4 per cent in 2019-20 against the growth of 13 per cent recorded in the previous year (Annex 2). Slower growth in gross transfers in 2019-20 could be due to 2019-20 being the last year of the effective time horizon of the XIV Finance Commission (XIV FC). Year-on year growth in gross transfers over the last four Finance Commissions (except the XIII FC) shows that by the end of fifth year some deceleration sets in (Chart 17). VIII. Concluding Observations The Union Budget for 2019-20 has focussed on building physical infrastructure, improving social services, digitising the economy, promoting MSMEs and start-ups, encouraging research and development and making India healthy, green and clean. The financial sector reforms announced in Union Budget along with recapitalisation of public sector banks (PSBs) will facilitate overall credit growth in the economy. The investment and infrastructure push given in the budget is a welcome move to boost growth and employment. A slew of measures announced recently in August 2019 with a special focus on financial sector reforms, auto and infrastructure along with measures related to taxation should also facilitate in strengthening the growth momentum of the economy (Annex 3). The government has demonstrated commitment to fiscal consolidation in 2019-20 as per the FRBM glide path, notwithstanding a challenging domestic and global environment impacting the outlook for growth. References Comptroller and Auditor General (2019). “Report of the Comptroller and Auditor General of India on Indirect Taxes – Goods and Services Tax for the year ended March 2018”, Report No. 11 of 2019, July Esteban, Ortiz-Ospina and Max Roser (2019). “Government Spending”. Published online at OurWorldInData.org. Retrieved from: ‘https://ourworldindata.org/government-spending’ Eyraud, L., and T. Wu. (2015), “Playing by the Rules: Reforming Fiscal Governance in Europe”, IMF Working Paper 15/67, International Monetary Fund, Washington, DC International Monetary Fund (IMF) (2018), “How to Calibrate Fiscal Rules A primer”, Fiscal Affairs Department (FAD) How-To Notes, March International Monetary Fund (IMF) (2019), Fiscal Monitor, April Report of the Twelfth Finance Commission Reserve Bank of India (2019). “Estimable Fiscal Multipliers for India”, Box III.1, Chapter III – Demand and Output, Monetary Policy Report, April Union Budget Documents, various issues
Annex 1 Union Budget 2019-20: Major Measures Measures related to Reserve Bank of India 1. Strengthened regulatory powers of the Reserve Bank over Non-Banking Financial Companies. 2. The regulation of the housing finance sector has been moved from National Housing Bank to the Reserve bank. 3. Abolition of Merchant Discount Rate (MDR); RBI and banks to absorb charges on digital transaction from the savings that will accrue to them because of handling less cash as people move to these digital modes of payment. 4. To merge the NRI-Portfolio investment scheme route with the Foreign Portfolio investment route with a view to providing Non Resident Indians (NRIs) with seamless access to Indian equities. 5. To get retail investors to invest in treasury bills and securities issued by the government, inter-operability of RBI depositories and Securities and Exchange Board of India (SEBI) depositories would be necessary. The government will take up necessary measures in this regard in consultation with RBI and SEBI to bring about seamless transfer of treasury bills and government securities between RBI and Depository ledgers. 6. Provision of ₹70,000 crore for capital infusion through issuance of recapitalisation bonds in public sector banks (PSBs) in 2019-20. 7. With the view to further deepen corporate triparty repo market in Corporate Debt securities, the government will work with regulators RBI/ SEBI to enable stock exchanges to allow AA rated bonds as collaterals. 8. Several measures are proposed to enhance the sources of capital for infrastructure financing. Among other measures, a Credit Guarantee Enhancement Corporation (CGEC) for which regulations have been notified by the Reserve Bank, will be set up in 2019-20. Rural Economy 1. The newly created Jal Shakti Mantralaya will work with the states to ensure piped water supply to all rural households by 2024. 2. For increasing farmers’ income, the Budget has recognised the need for forming new Farmer Producer Organisations (FPO), expansion of benefits of e-NAM (e-National Agriculture Market – online agricultural trading platform) to larger number of farmers and introduction of Zero Budget Farming. 3. Launch a focused scheme – the Pradhan Mantri Matsya Sampada Yojana (PMMSY) – to establish a robust fisheries management framework. Industry 1. The recommendations of the High Level Empowered Committee (HLEC) on retirement of old & inefficient plants and addressing low utilisation of Gas plant capacity due to paucity of Natural Gas, will be taken up for implementation. 2. Public-Private Partnership for developing railway infrastructure like development and completion of tracks, rolling stock manufacturing and delivery of passenger freight services. 3. Interest subvention scheme for GST registered MSMEs: ₹350 crore allocated for 2019-20. 4. To address delay in government payments to supplier and contractor MSMEs a payment platform for bill filing for MSMEs to be created. External Sector 1. Measures liberalising FDI: increase in Foreign Direct Investment (FDI) limit to 100 per cent in insurance intermediaries; further opening of FDI in aviation, media, animation and insurance in consultation with all stakeholders; and, easing of local sourcing norms for FDI for single-brand retail sector. 2. Introducing “Study in India” Scheme. 3. Reduction in Net Owned Fund requirement for opening of branches by foreign reinsurers. 4. The government would start raising a part of its gross borrowing programme in external markets in external currencies. Financial Markets 1. To raise the minimum public shareholding to 35 per cent from current threshold of 25 per cent. 2. To ease the liquidity crunch in NBFC space by proposing to provide short-term partial credit guarantee for the purchase of high-rated pooled assets of NBFCs for a total amount of ₹1 lakh crore. 3. To allow Foreign Portfolio Investors (FPIs) and NRIs to subscribe to listed debt papers of real estate investment trusts (REITs) and infrastructure investment trusts (InvITs). 4. To restrict imposition of Securities Transaction Tax (STT) to the difference between settlement and strike price in case of exercise of options. 5. Creating an electronic fund-raising platform for listing social enterprises and voluntary organizations – a social stock exchange - under the regulatory ambit of SEBI. Taxation measures 1. For individuals: a. Tax rebate for income up to ₹5 lakhs with additional income tax deduction of ₹1.5 lakh on interest paid on loan taken for purchase of electric vehicle and on loan taken for purchase house (valued up to ₹45 lakhs). b. Enhance surcharge on individuals having taxable income from ₹2 crore to ₹5 crore and ₹5 crore and above so that effective tax rates for these two categories will increase by around 3 per cent and 7 per cent, respectively. c. Tax deduction at source at the rate of 2 per cent on cash withdrawal by a person in excess of ₹1 crore in a year from his bank account. d. Allow those who do not have PAN to file income tax returns by simply quoting their Aadhaar number. 2. For corporates: Provide lower tax rate of 25 per cent to companies having annual turnover up to ₹400 crore, which will cover 99.3 per cent of the companies.
Annex II
Resource Transfers from the Centre to States in 2019-20 | | | 2017-18 | 2018-19 (RE) | 2019-20 (BE) | 2017-18 | 2018-19 (RE) | 2019-20 (BE) | 2017-18 | 2018-19 (RE) | 2019-20 (BE) | | | ₹ Thousand Crore | Share in Gross Transfers | Growth Rate | | I. Devolution of States’ share in Taxes | 673 | 761 | 809 | 62.0 | 61.1 | 60.9 | 10.7 | 13.1 | 6.3 | | II. Some Important Items of Transfer | 37 | 56 | 55 | 3.4 | 4.5 | 4.1 | -22.5 | 49.2 | -1.8 | | a. Externally Aided Projects - Loan | 18 | 24 | 20 | 1.6 | 1.9 | 1.5 | -1.5 | 36.0 | -17.1 | | b. Special Assistance | 7 | 14 | 15 | 0.6 | 1.1 | 1.1 | -36.2 | 94.2 | 11.1 | | III. Finance Commission Grants | 92 | 106 | 120 | 8.5 | 8.5 | 9.1 | -3.5 | 15.1 | 13.5 | | a. Grant for Rural Local Bodies | 34 | 43 | 53 | 3.2 | 3.4 | 4.0 | 9.8 | 24.3 | 22.8 | | b. Grants for Urban Local Bodies | 13 | 19 | 23 | 1.2 | 1.5 | 1.8 | -13.1 | 49.9 | 23.7 | | c. Post Devolution Revenue Deficit Grants | 36 | 35 | 34 | 3.3 | 2.8 | 2.6 | -13.3 | -3.5 | -1.1 | | IV. Total Transfer to States [Other than (I)+(II)+(III)] | 279 | 315 | 335 | 25.7 | 25.3 | 25.2 | 21.8 | 13.0 | 6.4 | | a. Under Centrally Sponsored Schemes (Revenue) | 262 | 277 | 292 | 24.1 | 22.3 | 22.0 | 16.0 | 5.9 | 5.3 | | b. Under Central Sector Schemes | 16 | 37 | 42 | 1.5 | 2.9 | 3.2 | 562.4 | 129.5 | 14.8 | | V. Total Transfer to Delhi and Puducherry | 4 | 8 | 10 | 0.4 | 0.7 | 0.8 | -25.0 | 116.9 | 20.7 | | VI. Gross Transfers to States/UTs | 1085 | 1247 | 1329 | 100.0 | 100.0 | 100.0 | 10.1 | 14.9 | 6.6 | | VII. Less Recovery of Loans and Advances | 13 | 9 | 10 | - | - | - | 4.3 | -28.8 | 4.2 | | VIII. Net Transfers (VI-VII) | 1072 | 1237 | 1320 | - | - | - | 10.2 | 15.4 | 6.7 | | IX. Gross Transfers / GDP (per cent) | 6.3 | 6.6 | 6.3 | - | - | - | - | - | - | | X. Net Transfers / GDP (per cent) | 6.3 | 6.5 | 6.3 | - | - | - | - | - | - | | Source: Union Budget Documents. |
Annex III Post Budget Measures Announced to Boost the Economy Taxation Measures -
Enhanced surcharge levied on long/short term capital gains arising from transfer of equity shares in 2019-20 Budget has been rolled back. -
Pre-filled IT returns and faceless scrutiny to be kick-started from Vijay Dashmi, 2019. All notices, summons, orders etc. by the income tax authorities shall be issued through a centralised computer system and all such notices will be disposed off within the first three months from the date of reply. -
All pending GST refunds due to MSMEs to be paid within 30 days. Further, in future, all GST refunds shall be paid within 60 days from the date of application. -
Angel tax provisions will no longer be applicable on start-ups registered with the Department for Promotion of Industry and Internal Trade (DPIIT). A dedicated cell under a Central Board of Direct Taxes (CBDT) Member will also be set up to address taxation problems of start-ups. Measures to Boost Infrastructure -
An inter-ministerial task force has been formed to finalise and actively monitor major infrastructure projects worth ₹100 lakh crore over 5 years. -
In cases where Arbitration Tribunals have passed orders in favour of contractors/concessionaires, government agencies have been mandated to pay-out 75 per cent of the total pay-out before challenging the decision in courts of law. Financial Sector Reforms -
Government is working with the Reserve Bank to introduce measures to bring offshore rupee market to domestic stock exchanges and permit trading of USD-INR derivatives in Gujarat International Finance Tec-City (GIFT) IFSC. -
Government will work with the Reserve Bank to make it more conducive for investors and bond issuers, as well to facilitate increased trading for price discovery. -
In consultation with RBI and SEBI, government will soon take further action on development of credit default swap markets. -
Depository Receipt Scheme, 2014 will be operationalised soon by SEBI which will give Indian companies increased access to foreign funds through American Depository Receipt (ADR)/Global Depository Receipt (GDR). -
Upfront capital infusion of ₹70,000 crore in public sector banks in the current financial year. This will release liquidity to the tune of ₹5 lakh crore in the banking system for lending. -
To protect honest decision making and prevent harassment for genuine commercial decisions by bankers, Central Vigilance Commission (CVC) has issued directions that Internal Advisory Committee (IAC) will classify cases as vigilance and non-vigilance. -
Requirement of creation of Debenture Redemption Reserve (DRR) of outstanding debentures in respect of listed companies, NBFCs and HFCs has been done away with. -
Additional liquidity support of ₹20,000 crore to Housing Finance Companies (HFC) by National Housing Bank (NHB). -
In order to leverage last mile customer connect of NBFCs, public sector banks (PSBs) will fast track collaboration for loans to self-help groups and small traders in co-origination mode with NBFCs. -
Reduced equated monthly instalment (EMI) on housing loans, vehicle and other retail loans by directly linking interest rates to repo rate. -
Simplified Know Your Customer (KYC) procedure to improve market access for foreign investors including FPIs -
One day to incorporate a company; faster and easier approvals for mergers and acquisitions; withdrawals of over 14,000 prosecutions under Companies Act; Corporate Social Responsibility (CSR) violations will be treated as a civil liability and not as a criminal offence. Measures to Boost Auto Sector -
Ban on government departments to purchase new vehicles to replace old ones has been lifted. -
Additional 15 per cent depreciation on vehicles acquired from now till March 2020. -
Government is also considering a scrappage policy for old vehicles, which will boost demand for new vehicles. -
BS IV vehicles purchased till March 31, 2020 will remain operational for the entire period of registration.
|