Digital payments have several advantages over currency such as convenience, safety and transparency. Panel data regression results of eight advanced economies (AEs) and eight emerging market economies (EMEs) suggest that increase in per capita income, higher education levels, wider availability of digital infrastructure, greater internet penetration, financial deepening and price stability help in the growth of digital payments in an economy. Introduction The digital revolution has touched and transformed many areas of human life. Progress in digital payments has been a prominent feature of this revolution. Apart from the evident advantages such as convenience, safety and liquidity, other benefits of digital modes of transactions include promotion of transparency and security by increasing accountability and tracking, and thereby reducing the scope for misuse and theft. Digital payments also promote financial inclusion by advancing access to a range of financial services, often at a lower cost. Although digital payments1 have been growing gradually in recent years, both in value and volume terms across countries, data also suggests that during the same time, currency in circulation to GDP ratio has also increased in consonance with the overall economic growth. Several anomalies, however, are visible in the trend: first, the spread and intensity of use of digital payments does not seem to have any specific relationship with how developed a country is – several AEs have low digital payments to GDP ratio while some EMEs have ratios comparable to AEs; second, an increase in digital payments to GDP ratio over a period of time does not seem to automatically imply a fall in the currency to GDP ratio of the country. From a policy perspective, thus, if increasing usage of digital payments is considered a desirable objective, then a careful analysis of the factors contributing to its spread is necessary and this is the objective of this article. Using a panel dataset of 8 AEs and 8 EMEs for the period 2003-2016, we examine the relationship between digital payments and various socio-economic indicators such as per capita income, credit to GDP ratio, inflation, internet penetration, share of rural population in total population and level of education. Controlling for country-specific behavioral idiosyncrasies, our findings suggest that supportive infrastructure and macroeconomic and price stability help in wider adoption of digital payments. The rest of the article is organised as follows: Cross country experience in digital payments is covered in Section II. Some stylised facts on expansion of digital payments in India in recent years are covered in section III. A brief literature survey on empirical evidence so far is presented in Section IV. Section V presents the methodology used for empirical analysis along with key findings. Conclusions are set out in Section VI. II. Trends in Digital Payments: A Cross-Country Analysis The volume of non-cash transactions globally grew at a compound annual growth rate (CAGR) of 9.8 per cent during the period 2012-2016, which was driven by emerging Asia and CEMEA (Central Europe, Middle East and Africa) (World Payments Report, 2018). Even though AEs accounted for the majority of share in non-cash transactions in terms of volume, the EMEs are catching up fast (Chart 1). Notwithstanding the fact that the EMEs as a group are taking long leaps in digital payments, data and evidence from individual countries suggest some anomalies. First, a cursory look at the data suggests that the spread and intensity of use of digital payments does not always increase in tandem with a country’s GDP level. While some AEs, like Germany, have low digital payments to GDP ratio2, the ratio is quite similar in a couple of EMEs and AEs (e.g. the ratio in an EME like Brazil is quite close to the one in Belgium). In contrast, a high GDP level also does not automatically imply low currency usage. For example, Japan has one of the highest currency to GDP ratio— higher even as compared to most EMEs—and one of the lowest cashless payments to GDP ratio in the world. Second, increase in digital payments to GDP ratio over a period of time does not seem to have resulted in corresponding lowering of currency usage. For example, the digital payments to GDP ratio increased significantly during the decade ending 2016 in Brazil, Mexico, Saudi Arabia and India but the currency to GDP ratio in these countries either remained stable or even increased (Chart 2). Against the backdrop of these anomalies, it is clear that a combination of several economic and behavioral factors need to be analysed to unravel the drivers of growth in digital payments, which is the aim of this article. 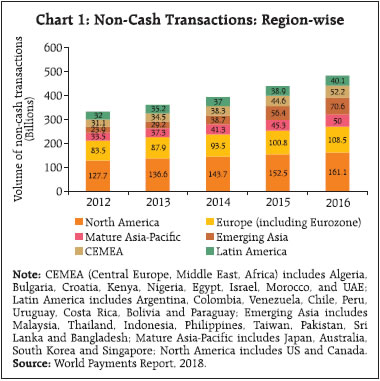 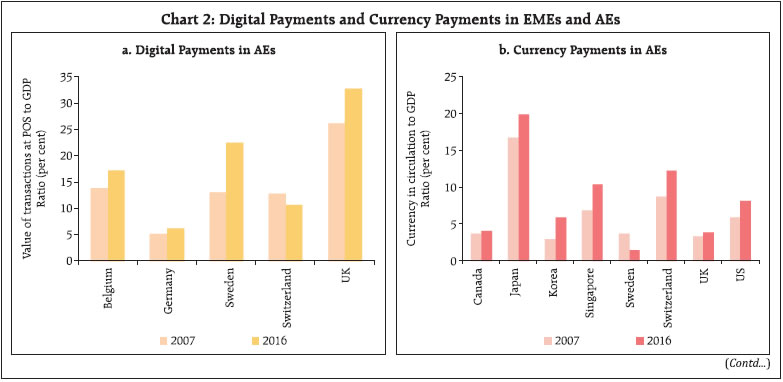 III. Digital Payments in India vis-à-vis World: Stylised Facts Although the digital payments to GDP ratio in India has been traditionally low, in the last few years it has taken long strides in terms of introduction and promotion of various instruments of cashless payments which have resulted in a significant increase in digital payments transactions3, especially after demonetisation (Chart 3a). The per person digital payments, both in terms of value and volume, also increased concomitantly (Chart 3b). 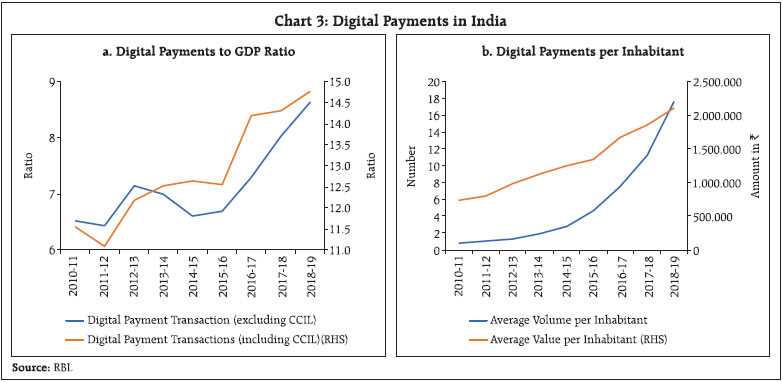 The share of retail electronic payments4 in total payments is consistently rising in terms of both volume and value since 2011-12 due to the emergence of some new modes of retail payments such as Prepaid Payment Instruments (PPI) and Unified Payments Interface (UPI). At the same time,the share of card payments5 in terms of volume has been declining, although it continues to be the most important component. In terms of value, payments through Real Time Gross Settlement (RTGS) and Clearing Corporation of India Ltd. (CCIL) dominate. The share of paper clearing continues to decline and constituted around 3 per cent of total payment system transactions, both in terms of volume and value during 2018-19 (Chart 4). The introduction of UPI in 2016-17 altered the landscape of retail electronic payments – the UPI’s share in it increased to 43 per cent within a span of three years (Chart 5). 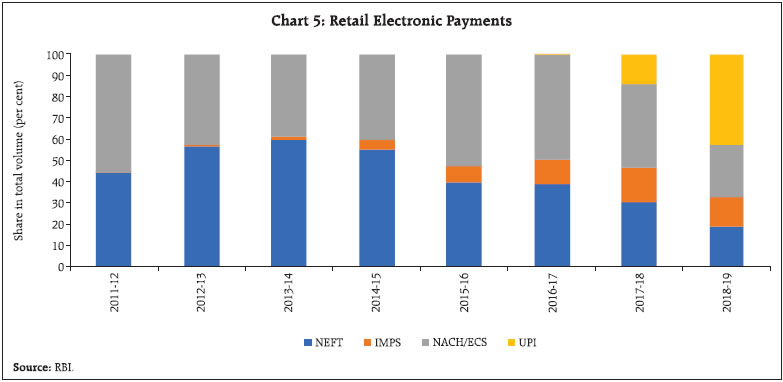 The usage of debit cards at point of sale (POS) terminals as a proportion of its total usage6 has witnessed a sharp pick-up in the recent years. In terms of volume, their share rose to 31 per cent in 2018-19 from 6 per cent in 2011-12 whereas in value terms the share increased to 16 per from 3 per cent during the same period. The growth in usage of debit cards at POS terminals has generally been higher than that of credit cards. The tremendous growth in use of debit cards may be attributable to the push provided through the RuPay cards under the Pradhan Mantri Jan Dhan Yojana (PMJDY), increase in the number of POS terminals and various incentives provided by the Government and merchants for digital payments. The number of POS terminals and usage of debit and credit cards increased significantly during 2016-17 on account of demonetisation. Though growth in usage of debit and credit cards at POS terminals declined in the post-demonetisation period, it nevertheless remained at elevated levels (Chart 6). The wider adoption of digital payments depends on both the supply side factors (such as robust payments system infrastructure, reduced cost of e-payments, introduction of new and innovative schemes to attract consumers, push to greater financial literacy and bank accounts) and demand side factors (such as strong consumer demand for e-payments because of convenience, safety and add-on benefits). The World Payments Report, 2018 documents that the UK, Singapore, Australia and Sweden have been leaders in terms of both regulatory supply-side push and demand-side pull (Chart 7). In India, the government and the Reserve Bank have taken various measures which have helped in increasing the usage and penetration of digital payments. Initiatives such as UPI, PPI, significant expansion in access to RuPay debit card through Jan-Dhan Accounts and Aadhar based direct benefit transfers (DBTs) have helped significantly in popularising and inculcating the habit of digital payments. The Reserve Bank has also been proactive in initiating a number of measures to promote greater usage of electronic payments and achieve a cash-lite society. The Reserve Bank’s ‘Payment and Settlement Systems in India: Vision 2019-2021’ endeavours to ensure increased efficiency, uninterrupted availability of safe, secure, accessible and affordable payment system as also to serve segments of the population which are hitherto untouched by the payment system.  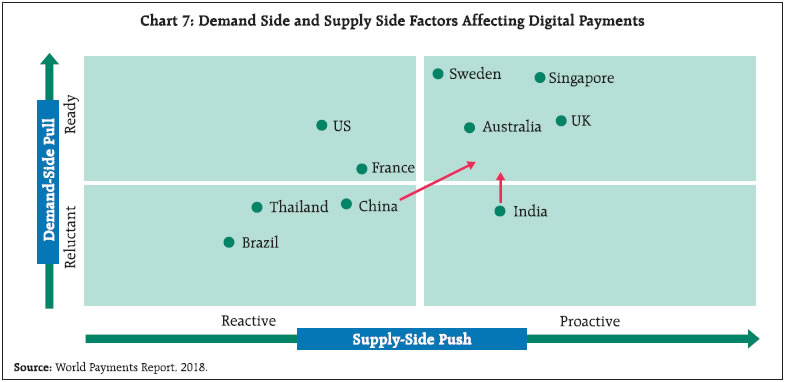 Although some progress in adoption of digital payments has been evident in India due to these initiatives, the usage of digital medium for payments remains much lower than major advanced and emerging economies (Chart 8a and 8b). In terms of various indicators of payment system infrastructure and usage such as number of cards per inhabitant, number of cashless payments per inhabitant and value of cashless payments per inhabitant, India lags behind the AEs and other EMEs. At the same time, the value of currency in circulation as a percentage of narrow money as well as percentage of GDP remained high as compared to other economies (Table 1). IV. Literature Review Empirical research on the subject has identified a few common factors that drive up or down the intensity of digital payment usage. These studies suggest that cash is used more frequently for lower-value transactions. usage of cash tends to decrease with higher levels of education and income. Availability of digital infrastructure can reduce cash usage, and cash tends to be used relatively more by older generations (Davies et al., 2016). | Table 1: Cross-country Comparison of Select Payment System Indicators (2017) | | Countries | Ratio of currency in circulation to narrow money (%) | Ratio of currency in circulation to GDP (%) | Number of cards (debit+credit) per inhabitant | Average number of cashless payments per inhabitant | Average value of cashless payments per inhabitant (USD) | Number of POS terminals per inhabitant | | Argentina | 63.3 | 6.8 | 2.4 | 46.7 | 35,278 | 0.01 | | Australia | 22.8 | 4.5 | 2.8 | 497.2 | 539,748 | 0.04 | | Brazil | 65.2 | 3.8 | 2.3 | 150.2 | 72,549 | 0.02 | | Canada | 9.4 | 4.3 | 2.9 | 366.7 | 129,441 | 0.04 | | China | 14.2 | 9.5 | 4.9 | 96.3 | 386,045 | 0.02 | | France | NA | NA | 1 | 339.4 | 477,920 | 0.03 | | Germany | NA | NA | 1.4 | 254.3 | 760,628 | 0.01 | | India* | 57.6 | 11.2 | 0.7 | 18.3 | 3,910 | 0.003 | | Indonesia | 50 | 5.1 | 0.7 | 34.3 | 6,993 | 0.005 | | Italy | NA | NA | 1.3 | 99.7 | 168,733 | 0.04 | | Japan | 14.9 | 20.4 | 3.5 | NA | 234,401 | NA | | Korea | 12.7 | 6.2 | 5.1 | 499.9 | 426,066 | NA | | Mexico | 36.1 | 6.7 | 1.4 | 36.7 | 132,776 | 0.01 | | Russia | 48.9 | 10.4 | 1.9 | 175.7 | 86,527 | 0.02 | | Saudi Arabia | 17.3 | 7.9 | 1 | 29 | 563,294 | 0.01 | | South Africa | 9.2 | 3.4 | NA | 80.5 | 40,524 | 0.01 | | Turkey | 29.7 | 4.3 | 2.1 | 65.9 | 51,419 | 0.03 | | United Kingdom | NA | NA | 2.5 | 410.9 | 1,791,862 | 0.04 | | United States | 44.3 | 8.2 | 4.2 | 473.4 | 601,977 | NA | Note: *: For India data pertains to the financial year 2018-19 and is sourced from RBI. Data on cashless payments excludes RTGS and CCIL transcations.
NA – Data not available
Source: Bank for International Settlements. | The demand for cash is generally found to be inversely related to GDP per capita, i.e., cash usage declines as countries become richer (Bech et al., 2018). As a corollary, higher income households tend to exhibit greater usage of credit cards, ATMs, direct deposit, internet banking, and other electronic transfers. Also, better educated individuals are, in general, found to be more open and receptive to the idea of digital payments (Stavins, 2001). Further, educated persons often get jobs where the salaries are paid directly by bank transfers, which makes card payments more convenient (Goczek and Witkowski, 2016; Bergman et al., 2007). Moreover, there seems to be a positive relationship between average age of the population and the transaction demand for cash as younger people are more likely to use electronic means of payments, even for smaller value transactions, whereas older persons tend to use cash for payments (Stavins, 2001; Esselink and Hernández, 2017; Bech et al., 2018; Bergman et al., 2007). The state of technological development of a country’s payment system also helps in explaining the state of cash substitution process. An analysis for ten European countries suggested that substitution of card payments for cash and cheques depends on the diffusion of card payment infrastructure, particularly electronic fund transfer and POS terminals (Snellman et al., 2001). V. Database, Methodology and Findings Using a panel dataset of 8 AEs and 8 EMEs7 from Bank for International Settlements (BIS), International Monetary Fund (IMF) and World Bank’s World Development Indicators database for theperiod 2003-20168, the relationship between digital payments and various socio-economic indicators was analysed. Value/volume of transactions at POS per inhabitant was used as a proxy for digital payments. A preliminary analysis through charts suggests that as per capita income increases, value/volume of digital payments also increases, which is in line with the earlier findings (Humphrey 2004). Eyeballing of data also suggests a positive relationship between credit to GDP ratio and digital payments. On the other hand, higher share of rural population seems to be associated with lesser digital payments while enrolment ratio—a proxy for level of education—is positively associated with digital payments (Chart 9 and 10). 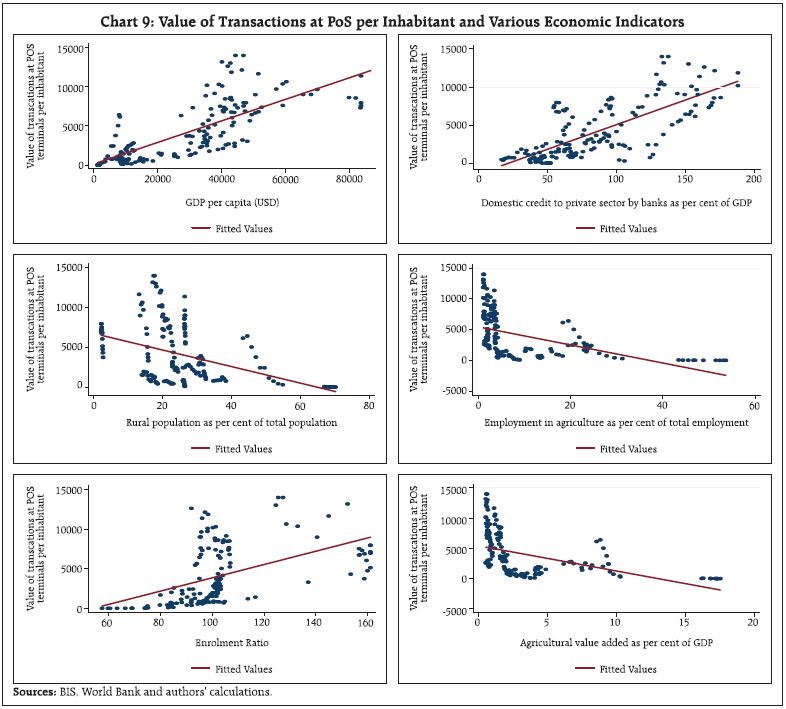 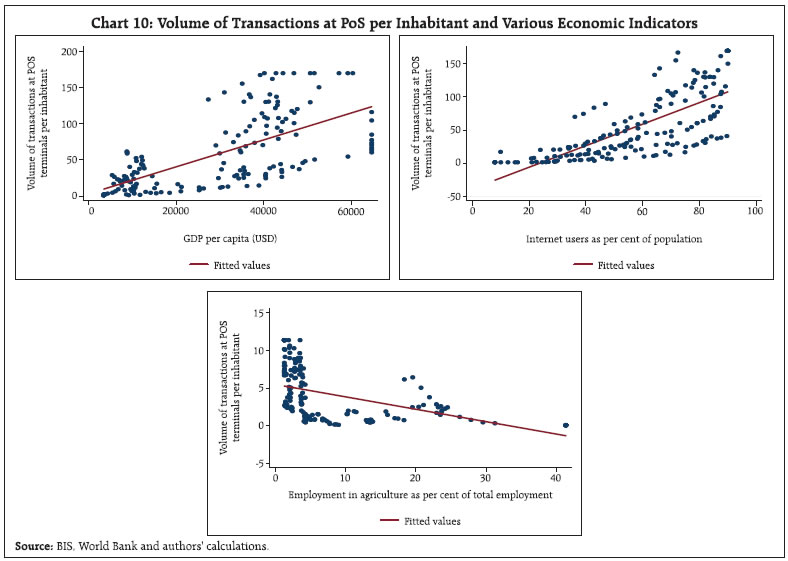 Cross-country data on number of POS terminals, volume/value of transactions at POS terminals, number of ATMs (which is taken as a proxy for infrastructure supporting digital payments), GDP per capita and CPI inflation are sourced from the BIS statistics on payment and market infrastructures. The data relating to domestic credit to private sector (as per cent of GDP), agricultural value added (as per cent of GDP), internet users (individuals using internet as proportion of total population), enrolment ratio (secondary school enrolment as per cent of gross enrolment), employment in agriculture (as per cent of total employment), and rural population (as per cent of total population) are taken from World Development Indicators of the World Bank. Cross-country determinants of digital paymentswere analysed in a fixed-effect panel regression framework9. The value/volume of transactions at POS terminals was used as a proxy for digital payments. Following existing literature, GDP per capita, domestic credit to private sector as per cent of GDP, internet users as per cent of population, enrolment ratio, share of rural population in total population, share of agricultural value added in GDP, share of persons engaged in agriculture, per capita number of ATMs and CPI inflation were used as explanatory variables. Data was appropriately winsorized at 5 per cent level on both the sides. The results are presented in Appendix Tables 1 and 2. The results suggest that increase in per capita income and education level (proxied by school enrolments) are determinants of increase in value/ volume of transactions at POS terminals. The positive relationship with income and education levels is in line with findings in the literature which show that the increase in the level of income and education results in lower usage of cash and increases the probability of using electronic modes of payments (Davies et al., 2016; Bech et al., 2018; Stavins, 2001). We found no significant impact of proportion of rural population on value and volume of transactions at POS terminals. However, employment in agriculture was found to be negatively related to volume of transactions at POS terminals. In order to evaluate the relationship between availability of infrastructure and digital payments, we also explored the relationship between internet users as per cent of total population and value of POS transactions, and found a significantly positive relationship between the two. Similarly, number of POS terminals per capita, another proxy for digital infrastructure, was also found to be positively associated with value of digital transactions. Domestic credit to private sector as percentage of GDP, which is an indicator of financial development was also found to lead to higher value/volume of transactions at POS terminals. The number of ATMs was found to be positively associated with the value/volume of digital transactions as with higher number of ATMs people tend to carry less cash. Also, most of the ATM cards also have debit/credit features which leads to higher usage at POS terminals. Lower CPI inflation was also found to be leading to greater volume of digital transactions at POS which could be due to the favourable impact of price stability in reducing uncertainty. VI. Conclusion In sum, our findings suggest that higher per capita income, higher levels of education, increase in domestic credit to private sector as percentage of GDP, greater internet penetrations, and lower inflation help in promoting digital payments. On the other hand, a high share of agricultural employment in total employment and high share of agricultural value added in GDP were found to be associated with lower digital payments. In India specific context, because of the role of DBTs in promoting adoption of digital mode of payments, and also because of the emphasis of the Reserve Bank on financial inclusion, the panel data results relating to share of agricultural employment in total employment may not hold. From a policy perspective, our findings suggest that in order to give a robust push to digital payments, it is important to provide a conducive macroeconomic environment and a safe and easy access to digital infrastructure. References Bech, M. L., Faruqui, U., Ougaard, F., & Picillo, C. (2018). Payments are a-changin’but cash still rules. BIS Quarterly Review, March. Bergman, M., Guibourg, G., & Segendorf, B. L. (2007). The Costs of Paying - Private and Social Costs of Cash and Card Payments. Riksbank Research paper series, (212). Capgemini, B. N. P. Paribas (2018). World Payments Report, 2018, available at https://worldpaymentsreport.com/wp-content/uploads/sites/5/2018/10/World-Payments-Report-2018.pdf. Dembiermont, C. (2017): Recent Developments in Payment Systems, accessed at https://www.bis.org/ifc/events/ifc_isi_2017/13_dembiermont_paper.pdf. Davies, C., Doyle, M. A., Fisher, C., & Nightingale, S. (2016). The Future of Cash. RBA Bulletin, December, 43-52. Esselink, H., & Hernández, L. (2017). The Use of Cash by Households in the Euro Area. ECB Occasional Paper, (201). Goczek, L., & Witkowski, B. (2016). Determinants of Card Payments. Applied Economics, 48(16), 1530-1543. Hancock, D., & Humphrey, D. B. (1997). Payment Transactions, Instruments, and Systems: A survey. Journal of Banking & Finance, 21(11-12), 1573-1624. Humphrey, D. B. (2004). Replacement of Cash by Cards in US Consumer payments. Journal of Economics and Business, 56(3), 211-225. Schmidt, T., & Bundesbank, D. (2016). Cash Payments More Popular in Germany than in other Countries. Deutsche Bundesbank Research Brief. Schneider, F. (2017). Restricting or Abolishing Cash: An Effective Instrument for Fighting the Shadow Economy, Crime and Terrorism? Shah, A., Kaushik, V., Roongta, P., Jain, C., & Awadhiya, A. (2016). Digital Payments 2020: The Making of a $500 billion Ecosystem in India. The Boston Consulting Group. Snellman, J. S., Vesala, J. M., & Humphrey, D. B. (2001). Substitution of Noncash Payment Instruments for Cash in Europe. Journal of Financial Services Research, 19(2-3), 131-145. Stavins, J. (2001). Effect of Consumer Characteristics on the Use of Payment Instruments. New England Economic Review· February.
| Appendix Table 1: Dependent Variable – Log of Value of Transactions at POS Terminals per inhabitant | | | (1) | (2) | (3) | (4) | (5) | | Log GDP per capita | 0.782*** | | | | | | | (0.172) | | | | | | Enrolment ratio | 0.0049* | | 0.0039 | 0.0024 | | | | (0.0018) | | (0.0020) | (0.0043) | | | Domestic credit to private sector as per cent of GDP | 0.0082* | 0.0085* | 0.0099* | | | | | (0.0029) | (0.0039) | (0.0034) | | | | Log of number of POS terminals | 0.698*** | 0.834*** | 0.726*** | 0.618*** | | | | (0.110) | (0.0811) | (0.144) | (0.128) | | | Agricultural value added as per cent of GDP | | -0.156 | | | | | | | (0.126) | | | | | Internet users as proportion to total population | | | 0.007 | 0.0093* | 0.0115* | | | | | (0.0038) | (0.0038) | (0.0043) | | Employment in agriculture as per cent of total employment | | | | -0.0518* | | | | | | | (0.0202) | | | Share of rural population in total population | | | | | -0.0547 | | | | | | | (0.0611) | | Log of ATM per inhabitant | | | | | 0.834** | | | | | | | (0.241) | | Constant | 1.881 | 11.27*** | 9.299*** | 10.16*** | 14.58*** | | | (1.881) | (0.649) | (0.903) | (0.927) | | | Country Fixed effects | Yes | Yes | Yes | Yes | Yes | | N | 155 | 166 | 155 | 155 | 170 | | R2_overall | 0.913 | 0.872 | 0.887 | 0.847 | 0.623 | Robust standard errors in parentheses
* p < 0.05, ** p < 0.01, *** p < 0.001 |
| Appendix Table 2: Dependent Variable – Log of number of transaction at POS terminals per inhabitant | | | (1) | (2) | (3) | | Log of GDP per capita | 0.508 | | | | | (0.293) | | | | Enrolment ratio | 0.0228* | 0.0116* | 0.0116 | | | (0.0103) | (0.0044) | (0.0055) | | Domestic credit to private sector as per cent of GDP | 0.0117* | 0.0078* | | | | (0.0049) | (0.0032) | | | Employment in agriculture as per cent of total employment | -0.103*** | -0.0773* | | | | (0.0248) | (0.0297) | | | Internet users as percentage of total population | | 0.0229** | 0.0219** | | | | (0.0067) | (0.0062) | | CPI inflation | | -0.0323** | | | | | (0.0084) | | | Share of rural population in total population | | | 0.0460 | | | | | (0.0953) | | Log of ATM per inhabitant | | | 0.837* | | | | | (0.294) | | Constant | -3.997* | 1.063 | 5.962** | | | (1.804) | (0.833) | (1.816) | | Country Fixed Effects | Yes | Yes | Yes | | N | 160 | 160 | 160 | | R2_overall | 0.735 | 0.766 | 0.448 | Robust standard errors in parentheses
* p < 0.05, ** p < 0.01, *** p < 0.001 |
|