Shifts in the sectoral pattern and volume of financial transactions in the Indian economy were evident during the period 2011-12 to 2017-18. Reflecting the process of financial development, the size of the RBI’s financial balance sheet shrank over the period. The balance sheet of other depository corporations (ODCs) sector has been in a contraction mode since 2013-14, reflecting the shift in the preferences away from deposits towards other competing financial instruments. During the period, net borrowings of non-financial corporations, both public and private, declined, reflecting the recourse to internal saving to finance investment. The household sector which remains the major supplier of funds, has been undergoing a major behavioural shift. Currency and deposits - historically the most preferred financial instruments, declined in significance giving way to equity, mutual funds, insurance and provident funds during the period. Introduction The Reserve Bank of India compiles the flow of funds (FoF) accounts of the Indian economy broadly in accordance with the System of National Accounts (SNA, 2008). The institutional sectors that are covered in this article comprise: (i) financial corporations (FCs); (ii) non-financial corporations (NFCs), public and private; (iii) general government (GG) comprising both central and state governments; (iv) the household and non-profit institutions serving households (HHs)1; and (v) the rest of the world (RoW) (Exhibit 1). These accounts also cover financial instruments for sectoral transfers, from sources to uses of funds on from-whom-to-whom (FWTW) basis, which include currency, deposits, debt securities, loans and borrowings, equity, investment funds (such as mutual funds), insurance, pension and provident funds, monetary gold and other accounts (including trade debt). For the first time in this article, flow of funds have been augmented with sector-wise outstanding positions in addition to the standard flow aspect of financial accounts, i.e., acquisition of financial assets and liabilities2. The end year of the period of study, i.e., 2017-18 is determined by the fact that data for that year pertaining to private non-financial corporate sector became available only in May 2019 owing to transition of reporting standards for companies from the Indian Generally Accepted Accounting Principles (I-GAAP) to Indian Accounting Standard (Ind-AS)3. 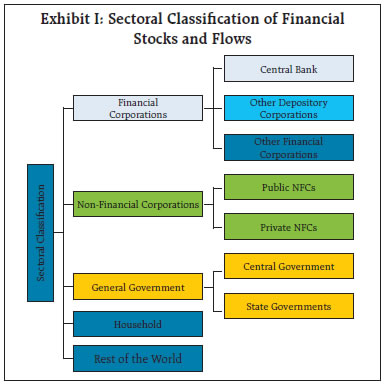 India has endorsed the second phase of the G20 Data Gaps Initiative (DGI-2) launched in 2015, which relates to improved coverage, timeliness, and periodicity of sectoral accounts4. Accordingly, the Committee on Financial Sector Statistics (CFSS)5 recommended (i) release of higher frequency data - quarterly as well as annual with a reduced lag of 9 months from the current lag of more than 15 months; (ii) coverage of new variables; and (iii) coverage of new aspects such as, flows versus stocks and transactions versus valuation. This article marks an important step towards achieving the DGI-2 target on sectoral accounts by 2021. For the first time, insurance and provident funds are presented distinctly as a subsector within the other financial corporations (OFCs) sectors. Bifurcation of financial flows into transactions and valuation changes has been attempted for mutual funds, insurance, pension and provident funds, households and the Reserve Bank of India. Money market and non-money market mutual funds are also presented separately. As regards the rest of the world sector, both balance of payments (BoP) data and the international investment position (IIP) have been presented. Efforts have also been made to reconcile financial stock and flows data published by the Reserve Bank of India and the sequence of accounts (SoA) of the Indian economy published by the National Statistical Office (NSO)6. The rest of the article is organised into seven sections. Section II sets out a brief account of the sectoral financial resource gaps. Section III presents sector-wise financial trends. A brief discussion on instrument-wise financial flows is contained in Section IV. Select indicators of financial development are analysed in Section V. Applications of financial accounts and a network analysis of financial flows is presented in Section VI. Section VII concludes the article with some policy perspectives. II. Sectoral Financial Resource Gap Households, financial corporations and private non-financial corporations (PvNFCs) had positive net worth7, while general government and public non-financial corporations (PuNFCs) had negative net worth in the economy during the period 2011-12 to 2017-18. HHs’ net worth, on an average, remained close to the net national income (NNI) (Table 1). The overall financial resource balance in the economy - measured by the net acquisition of financial assets less net increase in liabilities remained in surplus for the third consecutive year in 2017-18 with a reduction in net borrowings of NFCs, both public and private8 reflecting the recourse to internal saving to finance investment. On the other hand, the resource gap of the GG sector after showing improvement in 2015-16 and 2016-17, reverted to its average level in 2017-18. Net lending by HHs which had strongly recovered in 2015-16 from a slump in the previous years, was impacted by demonetisation in 2016-17 and decelerated further in 2017-18 (Table 2). Table 1: Sectoral Financial Net Worth
(Per cent of NNI at current market prices) | | | 2011-12 | 2012-13 | 2013-14 | 2014-15 | 2015-16 | 2016-17 | 2017-18 | | | Assets | | 1. Financial Corporations | 224 | 227 | 229 | 231 | 232 | 231 | 234 | | 2. Non-Financial Corporations | 133 | 125 | 125 | 125 | 119 | 113 | 108 | | a. Public Non-Financial Corporations | 18 | 17 | 16 | 15 | 12 | 12 | 12 | | b. Private Non-Financial Corporations | 115 | 108 | 109 | 109 | 107 | 101 | 96 | | 3. General Government | 31 | 30 | 30 | 28 | 30 | 29 | 28 | | 4. Household Sector | 137 | 133 | 131 | 133 | 133 | 132 | 134 | | 5. Rest of the World | 46 | 48 | 50 | 51 | 50 | 46 | 45 | | | Liabilities | | 1. Financial Corporations | 191 | 193 | 194 | 196 | 197 | 196 | 198 | | 2. Non-Financial Corporations | 112 | 107 | 108 | 109 | 105 | 99 | 95 | | a. Public Non-Financial Corporations | 20 | 20 | 21 | 22 | 21 | 22 | 23 | | b. Private Non-Financial Corporations | 92 | 86 | 86 | 87 | 85 | 77 | 71 | | 3. General Government | 78 | 78 | 77 | 77 | 79 | 78 | 78 | | 4. Household Sector | 32 | 32 | 32 | 32 | 32 | 32 | 34 | | 5. Rest of the World | 23 | 22 | 24 | 24 | 25 | 22 | 23 | | | Financial Net Worth | | 1. Financial Corporations | 33 | 35 | 35 | 35 | 35 | 35 | 37 | | 2. Non-Financial Corporations | 21 | 19 | 17 | 16 | 13 | 14 | 14 | | a. Public Non-Financial Corporations | -2 | -3 | -5 | -7 | -9 | -10 | -11 | | b. Private Non-Financial Corporations | 23 | 22 | 22 | 22 | 22 | 24 | 24 | | 3. General Government | -47 | -47 | -47 | -48 | -49 | -49 | -50 | | 4. Household Sector | 105 | 101 | 99 | 100 | 100 | 100 | 100 | | 5. Rest of the World | 23 | 26 | 26 | 26 | 25 | 23 | 23 | III. Sector-wise Financial Trends II.1 Financial Corporations Financial corporations play a dominant role in facilitating flow of resources from surplus units of the financial system to the deficit units. Central banks are constituent of FCs but are different in the sense that in discharge of their responsibility of formulating monetary policy and maintaining financial stability of the economy, they exercise control over key aspects of the financial system. On the other hand, other depository corporations (ODCs) which include depository institutions other than the central bank, and other financial corporations (OFCs)9 engaged in financial intermediation. The ODCs, which mobilise deposits from other units, play a predominant role in a bank-based economy like India (Chart 1). They include scheduled commercial banks, co-operative banks and credit societies, deposit taking non-banking financial companies and deposit taking housing finance companies. Table 2: Sectoral Financial Resource Balance
(Per cent of NNI at current market prices) | | | 2012-13 | 2013-14 | 2014-15 | 2015-16 | 2016-17 | 2017-18 | | 1. Financial Corporations | 3.0 | 2.6 | 2.5 | 1.8 | 2.3 | 1.6 | | 2. Non-Financial Corporations | -8.0 | -6.1 | -5.7 | -5.4 | -3.3 | -2.9 | | a. Public Non-Financial Corporations | -2.8 | -2.6 | -2.8 | -3.1 | -2.4 | -2.1 | | b. Private Non-Financial Corporations | -5.3 | -3.5 | -2.9 | -2.3 | -0.9 | -0.8 | | 3. General Government | -5.7 | -5.8 | -5.6 | -5.4 | -5.1 | -5.5 | | 4. Household Sector | 8.7 | 8.5 | 8.3 | 9.5 | 8.5 | 7.8 | | 5. Total (1+2+3+4) | -2.1 | -0.8 | -0.5 | 0.5 | 2.3 | 1.0 |
III.1.1 Central Bank The size of the Reserve Bank of India’s financial balance sheet shrank over the period 2011-12 to 2017-18 reflecting the process of financial development10 (Chart 2). A sharp reduction in the size of its balance sheet was observed during 2016-17 due to demonetisation, which caused reduction in liabilities in the form of currency. The central bank as the issuer of currency in the economy has currency as its main liability. As much as around 95 per cent of the currency issued by the Reserve Bank of India is held by households. The second most important central bank liability is deposits, which are mostly held by the ODC sector. In 2016-17, however, the composition of currency and deposits on the liabilities side changed. Flow in terms of currency turned negative as specified bank notes (SBNs) were returned to the Reserve Bank of India, including through the banking system, liabilities in the form of deposits increased as ODCs deposited their surplus liquidity with the Reserve Bank of India. This led to a shift in the composition of liabilities of Reserve Bank of India from non-interest bearing currency liabilities to interest bearing deposits. As the process of remonetisation gathered pace in 2017-18, currency moved back to the position of being its most important liability. On the assets side, debt securities issued by the RoW form the predominant component, followed by loans to the ODCs sector. This composition changed briefly during 2016-17, as ODCs and OFCs used post-demonetisation the surplus liquidity to repay the loans outstanding with the Reserve Bank of India. 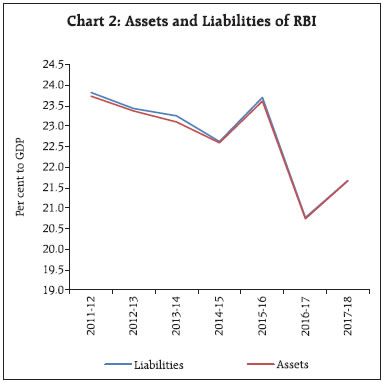 III.1.2 Other Depository Corporations The balance sheet of other depository corporations (ODCs) sector has been in a contraction mode since 2013-14, reflecting the shift in the preferences away from deposits towards other competing financial instruments like mutual funds and small savings (Chart 3). Income is found to be the most important factor in deposit mobilisation by the banking system (RBI, 2019). This is corroborated by the steady decline in household financial saving in the form of deposits11. Expanding financial literacy could also have encouraged people to move away from traditional instruments like deposits (RBI, 2016). The secular contraction in the balance sheet of ODCs sector was not reversed even during demonetisation, inflow of SBNs into the banking system was counter balanced by: i) redemption of deposits held in Foreign Currency Non-Resident (Bank) (FCNR(B)) account; and ii) repayment of loans owed to the Reserve Bank of India (RBI, 2017). 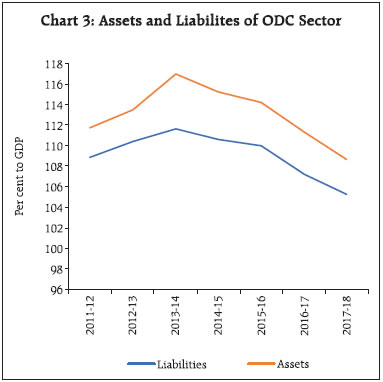 The most important instrument used by the ODCs to acquire liabilities are deposits, mostly from the households followed by loans, mostly acquired from the OFCs. On the assets side, loans advanced to non-financial corporations and households is the most important instrument, followed by investment in debt securities, primarily government securities. Demonetisation affected the composition of balance sheet of the ODCs. It led to an increase in the outstanding liabilities of ODCs in the form of deposits and a decline in assets in the form of loans (Chart 4 and 5). The huge cash flow into the ODCs sector was used to acquire government debt securities, intra-sectoral deposits and deposits with the central bank during 2016-17. With the process of remonetisation in 2017-18, the flows moved in the opposite direction - deposits turned negative, while loans increased. Overall financial net worth of this sector has remained positive, however, it has been steadily declining since 2013-14, mainly on account of increase in non-performing assets (NPA) in the banking sector. Within the ODCs sector, scheduled commercial banks (SCBs) and deposit taking non-banking financial companies (NBFCs-D) exhibit complementarity in their financial intermediation roles. The size of the consolidated balance sheet of SCBs in India has been growing at a slowing pace over the period of study as they grappled with stressed assets. However, the consolidated balance sheet of NBFCs was buoyed by strong credit expansion enabled by low NPA levels relative to banks and stronger capital buffers (RBI, 2018).12 III.1.3 Other Financial Corporations The size of other financial corporations (OFCs) sector has remained much smaller than that of the ODCs sector in India although. it has been expanding since 2013-14 with the growing preference among households for products like insurance, mutual funds, pensions and provident funds over traditional instruments like bank deposits (Chart 6). Liabilities of OFCs are primarily held in the form of insurance, pension and provident funds, followed by mutual fund units and debt securities (Chart 7). Post demonetisation, OFCs have increased investments in government and corporate debt securities as well as in equity and mutual funds. The assets of OFCs are predominantly government debt securities followed by loans issued to NFCs and equity holdings within the sector. As regards sectoral composition of their financial liabilities, intra-sectoral borrowings of OFCs constitute the topmost share followed by the flow from ODCs. The resource flow from ODCs contracted sharply on account of asset quality review (AQR) of Indian banks during 2015-16 and 2016-17, which revived somewhat in 2017-18 as NPA levels of banks started to decline (Chart 7). The financial net worth of OFCs has been steadily expanding since 2014-15, due to acquisition of assets in the form of debt securities (Chart 8). The bifurcation of gross flows into transactions and valuation changes reveals that about one-third of the change in assets of the OFCs sector during the period of study was due to appreciation of assets. III.2 Non-Financial Corporations Non-financial corporations account for large share of gross fixed capital formation (GFCF), and borrow from the surplus sectors in the economy like households and financial corporations to meet their needs for investment in productive assets. In terms of ownership, this sector is bifurcated into publicly owned non-financial corporations (PuNFCs)13 (entities in which more than 50 per cent of share is held by the Government) and the private non-financial corporations (PvNFCs), which are larger in terms of both number and the size of the balance sheet. In case of PvNFCs, equities are the largest source of external finance followed by loans and borrowings. PvNFCs are the largest equity holders among themselves. In contrast, loans and borrowings is a more preferred form of external finance for the public NFCs,. The net-worth position of PvNFCs is positive due to the large share of shareholder’s funds in their balance sheet. It has been rising on account of declining investment and rising corporate earnings. The networth of the PuNFCs, on the other-hand, has been negative and worsening over time on account of large number of loss-making central public sector enterprises (CPSEs) and aggressive disinvestment by the Government. The inter-linkage between the NFCs and the FCs is noteworthy, since funds from all sectors are intermediated through financial corporations. Inflows from the RoW in the form of direct and indirect (equities and debt securities) investment in India is also substantial. The financial resource gap of the PvNFCs declined steadily from 2012-13 to 2017-18 from a deficit of 5.3 per cent of NNI to 1.5 per cent. Lower investment demand, increased savings and lower inflation has benefited PvNFCs as evident from the saving-investment behaviour of the PvNFCs reflected in the national accounts (Chart 9). The share of claims by the PvNFCs in total liabilities almost doubled in 2016-17 (Chart 10). Foreign direct investment (FDI) from the RoW sector has also played a noteworthy role in recent years. The role of the OFCs has also increased substantially while flows from ODCs have shrunk gradually. In case of the PuNFCs, the resource gap has remained stable over the years from 2012-13 to 2017-18 (Chart 11). From a relatively unprofitable year in 2015-16, there was some improvement in their balances in 2016-17 and 2017-18. III.3 General Government In India, both the central government and the state governments run deficits, and thereby are net borrowers in the economy. Due to paucity of data, compilation is not done for the local bodies which form the third tier in the governance hierarchy. On the assets side, equity has the largest share which is reflective of participation of the central government, in corporations, both financial and non-financial (Chart 12). This is followed by deposits held with ODCs - more pronounced in the case of state governments which have accumulated large cash balances, reflecting poor cash management. The financial resource gap of the GG sector remained stable during the period 2012-13 to 2016-17, widening somewhat during 2017-18. This gap was primarily financed by the OFCs and ODCs. The resource flow from households, primarily via debt securities, picked up from the year 2014-15. Debt securities make up almost three-fourths of total financial liabilities. These debt securities act as a safe haven for investors and are statutorily mandated for SCBs under the liquidity coverage ratio (LCR) in addition to the minimum statutory liquidity ratio (SLR) requirement. III.4 Households and NPISHs Households play multi-dimensional roles as consumer, investor and entrepreneur. More than half of GDP is generated in the form of household consumption and around one-tenth in terms of household investment. Households also act as entrepreneurs by investing in buildings, machinery, and equipment related to their business as self-employed workers or sole proprietors. At an aggregate level, households are typically net savers and net lenders, and enjoy positive net-worth. The share of financial surplus of the household sector as percentage of NNI remained at around 8 per cent on average between 2011-12 to 2017-18. Household financial assets and their surplus showed an uptick during 2015-16 on account higher currency and deposits supported by high income growth as GDP growth touched 8 per cent for the first time during the current decade. The financial surplus of households have shrunk in the subsequent years. In 2017-18, both household assets and liabilities expanded but the growth in the latter outpaced the former resulting in further moderation in surplus (Chart 13). 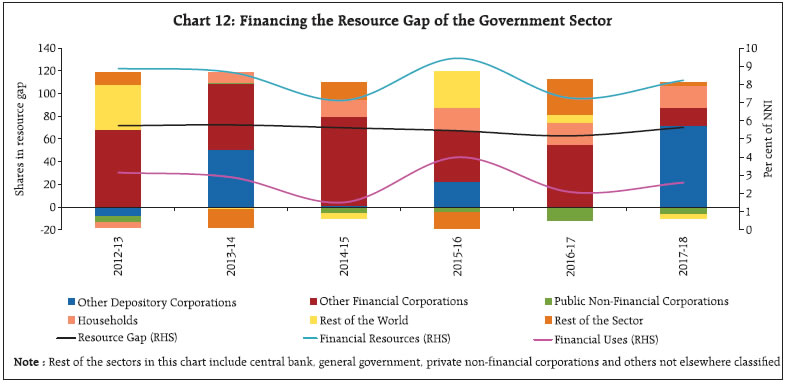 Currency and deposits constitute more than half of the total assets held by households; however, their share in total assets has been declining overtime and are replaced by equities and debt securities. The share of insurance and pension funds has gradually increased, indicative of growing risk appetite and portfolio diversification. The major liability in household’s balance sheet is loans and borrowings, primarily from ODCs and OFCs. The from-whom-to-whom metrics suggest that households are connected the most with financial corporations (both ODCs and OFCs) which act as intermediaries to channel their surpluses to deficit sectors. III.5 Rest of the World The financial stock and flows of the rest of the world sector emanate from the flow of financial resources between the domestic economy and non-residential institutional units (Reserve Bank of India, 2015). The primary source of funds for the RoW sector is through issuance of debt securities which is subscribed by the central bank and ODCs, deposits by ODCs and investment in equities by NFCs (Chart 14). In India, investment from RoW comes in the form of equities and debt securities. The share of loans and borrowings expanded significantly on account of growing demand for external commercial borrowings mostly from the non-financial corporations. High deposits on the assets side is reflective of deposits of non-resident Indians in ODCs. Inflow in debt instruments remained largely volatile while equity inflow after taking a dip in 2014-15 recovered in the following year and remained steady thereafter. Foreign portfolio investment (FPI) inflows in the debt segment were broadly resilient to rate hikes of the Fed in 2017-18. FPI into equity halved amidst concerns about earnings growth, over-valuation and spillovers from monetary policy of systemic central banks. 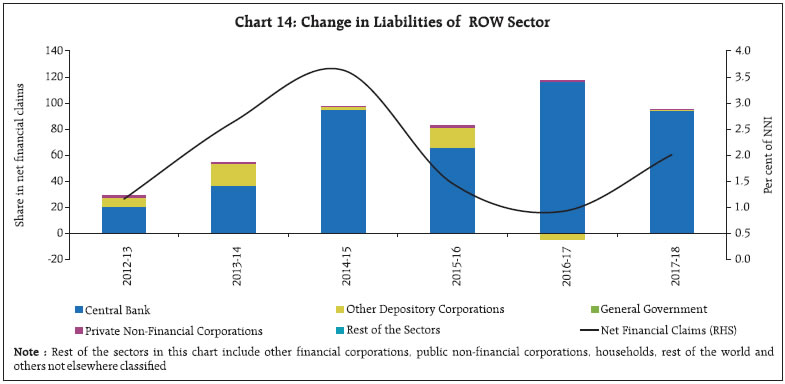 Despite a decline in the net financial assets by the RoW in 2016-17, it was comfortably able to meet India’s external financing requirements. The decline was primarily due to reduction in debt securities held by ODCs and loans repaid by NFCs. In 2017-18, there was higher acquisition of financial assets due to higher investment in equities by non-financial corporations (Chart 15). V. Financial Flows by Instruments A shift in the composition of instruments to acquire financial liabilities is evident during the period 2012-13 to 2017-18, barring 2016-17. Having historically been the most preferred financial instruments, currency and deposits declined in significance, giving way to equity, mutual funds, insurance and provident funds. On the other hand, the share of debt securities increased, mostly issued by general government. Loans and borrowings are the second most important instrument used for acquiring financial liabilities followed by equities. As regards loans and advances, the household sector had the highest share in issuance of liabilities, while the private non-financial corporations sector was the major borrower (Chart 16). Demonetisation had a significant but transitory impact on the instrument used for acquisition of financial liabilities during 2016-17, and a quick reversal in the following year. Increased number of insurance policies and mutual funds units were issued during 2016-17 (Chart 16, Table 3 and Statement 7). VI. Select Indicators of Financial Development The financial development of an economy can be gauged in terms of behavioural ratios, viz., the finance ratio (FR), the financial inter-relation ratio (FIR), new issues ratio (NIR), and the intermediation ratio (IR). In a secular perspective, these ratios provide insights into the relationship between financial development and overall economic growth. The finance ratio (FR), defined as the ratio of total issues of primary and secondary claims in relation to national income suggests the pace of financial deepening in the economy. The FR recorded an increase to 0.51 in 2017-18 from 0.38 in 2016-17, after having declined for three consecutive years since 2013-14 (Table 4). The relationship between financial development and the growth of physical investment is captured by the financial inter-relation ratio (FIR). This ratio defined as the ratio of total financial liabilities to net domestic capital formation, increased to 1.82 in 2017-18 from 1.63 in 2016-17. | Table 3: Instrument wise and Sector wise Acquisition of Assets, 2017-18 | | (₹ billion) | | Instrument/Sector | Financial Corporations | General Government | Non-financial Corporations | Households and NIPISHs | Rest of the World | Total | | 1. Monetary gold and SDRs | 125.2 | 0 | 0 | 0 | 0 | 125.2 | | 2. Currency and deposits | -252.5 | 1,300.0 | 2,152.3 | 10,018.2 | 1,066.0 | 14,284.0 | | 3. Debt Securities | 12,940.6 | -94.5 | 1,120.3 | 39.2 | 577.1 | 14,582.7 | | 4. Loans and borrowing | 19,733.9 | 735.5 | 417.1 | 0 | 1,039.0 | 21,925.5 | | 5. Equity and investment fund shares | -512.7 | 1,908.4 | 3,233.2 | 1,749.2 | 3,392.2 | 9,770.4 | | 6. Insurance, pension and provident | 0.6 | 0 | 0 | 7,435.8 | 0 | 7,436.4 | | 7. Other account receivable / payable | 1,087.6 | 2.3 | 3,544.8 | 42.0 | -4.8 | 4,671.9 | | 8. Other items not elsewhere classified | 40.0 | 0 | 0 | 0 | 0 | 40.0 | | 9. TOTAL | 33,162.6 | 3,851.8 | 10,467.7 | 19,284.4 | 6,069.4 | 72,836.0 | The uptick observed in the new issue ratio (NIR) indicates a surge in primary issues as a proportion to net domestic capital formation during 2017-18. Additionally, it may be noted that the role of external finance also has increased, as captured in the growth in primary issuances by the RoW sector. The intermediation ratio (IR) reflects the degree of dependence of the economy on the financial sector. It is measured as the ratio of liabilities of the financial sector (or secondary issues) to liabilities of the non-financial sector (or primary issues). This shows a lower role of financial sector in secondary issues than primary issues. This also supports the hypothesis that non-financial corporations are mostly financed by their own saving or they increasingly depend on external commercial borrowings. In other words, this is also reflected from the higher external finance as well as the increased intra-sectoral flows. | Table 4: Select Indicators of Financial Development | | | 2012-13 | 2013-14 | 2014-15 | 2015-16 | 2016-17 | 2017-18 | | 1. Secondary Issues# | 21,146.9 | 22,477.4 | 20,211.3 | 23,367.9 | 23,325.5 | 30,686.0 | | 2. Primary Issues## | 25,992.5 | 34,588.2 | 35,042.0 | 31,242.8 | 28,058.1 | 37,507.6 | | 2.1 Domestic Sectors | 24,977.5 | 31,976.1 | 31,055.8 | 29,476.5 | 26,817.2 | 34,524.2 | | 2.2 Rest of the World | 1,014.9 | 2,612.1 | 3,986.2 | 1,766.3 | 1,240.9 | 2,983.4 | | 3. Total Issues (1+2) | 47,139.4 | 57,065.6 | 55,253.3 | 54,610.7 | 51,383.7 | 68,193.6 | | 4. Net Domestic Capital Formation@ | 27,862.2 | 25,981.6 | 28,374.9 | 29,729.6 | 31,506.6 | 37,451.4 | | 5. Finance Ratio (Ratio of 3 to 5) | 0.54 | 0.58 | 0.50 | 0.45 | 0.38 | 0.51 | | 6. Financial Inter-relations Ratio (Ratio of 3 to 4) | 1.69 | 2.20 | 1.95 | 1.84 | 1.63 | 1.82 | | 7. New Issue Ratio ( Ratio of 2 to 4) | 0.93 | 1.33 | 1.23 | 1.05 | 0.89 | 1.00 | | 8. Intermediation Ratio (Ratio of 1 to 2) | 0.81 | 0.65 | 0.58 | 0.75 | 0.83 | 0.82 | #: Refers to issues by financial intermediaries (i.e., ODCs and OFCs).
##: Refers to issues by all sectors other than financial intermediaries.
@: At Current Prices. | VII. Applications of Financial Accounts: Network Analysis of Financial Flows The financial accounts provide insights into the working of the economy and the financial system. By providing insights into sources and destinations of financial funds and identifying sectoral surpluses or deficits, they help in understanding potential transmission of shocks and risks due to inter-sectoral linkages and explain saving, capital formation, wealth and indebtedness. 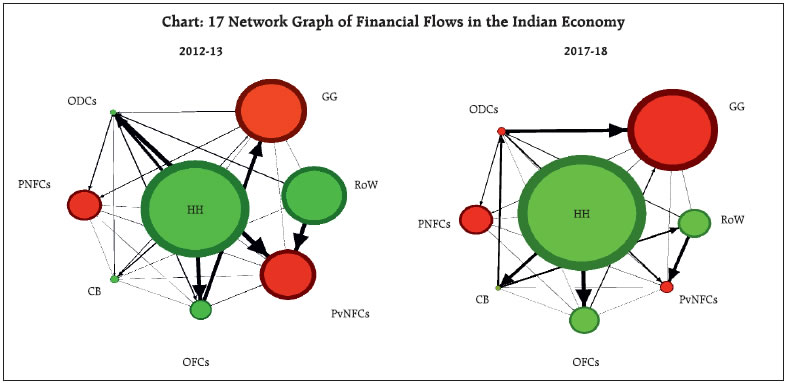 The FWTW framework enables the application of network theory in financial accounts to effectively disentangle propagation of shocks in the financial system (RBI, 2018). The graphs portray the extent (magnitude) of net flows (uses minus sources) between sectors in the economy (Chart 17). The size of the nodes pertains to the relative shares of sectors in total net lending/borrowing between all sectors in the economy. The nodes in green represent net lenders whereas the nodes in red represent net borrowers. The weight of the edges represents the relative share of net lending/borrowing from one sector to another in the total net lending/borrowing in the economy. The relative positions not absolute net lending/borrowing between sectors can be compared across time. HHs are net lenders and account for the largest share of relative net flows in the economy. The size of the GG as a net borrower has increased from 2012-13 to 2017-18. The role of the RoW as a net lender has reduced considerably, whereas the role of OFCs as a net lender has increased marginally. The relative size of the PuNFCs has remained broadly unchanged. Net borrowing position of the PvNFCs has declined from 2012 to 2017. The ODCs have changed from being net lenders to net borrowers due to changes in instrument composition owing to demonetisation. VIII. Conclusion The Indian economy witnessed major shifts in the pattern and volume of financial transactions across major sectors during the period 2011-12 to 2017-18. The household sector which remains the major supplier of funds, has been undergoing a major behavioural shift with greater financialisation and diversification of household savings - a trend that augurs well for sustaining high growth of the Indian economy. There has been a shift in savings of households sector from physical to financial assets. Furthermore, a shift away from bank deposits to investments in mutual funds, insurance and pension funds is also observed. Complementarities between banks and the non-banking financial companies are increasingly reflected in the financial accounts. It is observed that in years when loans and advances from the banking sector declined, those from NBFCs increased, and vice-versa. The inter-connectedness between other depository corporations and other financial corporations is also evident from the network analysis. From the point of view of monitoring systemic risk, the interconnectedness between SCBs and NBFCs in the form of loans extended by SCBs and equity holdings of NBFCs in SCBs becomes important (RBI, 2018). The rise in investment in equity and debt securities by the household sector, combined with a contraction in such investments by the RoW bears out the fact that the domestic investors have outperformed foreign investors in Indian equity market. The role of the rest of the world sector seems to have declined over time, given the rise of trade protectionism and high uncertainties unleashed by global spill overs in the years following the global financial crisis. In the recent years, the general government has emerged as the major deficit sector in the economy exhausting a major share of the surplus of households. This has resulted in pressure on prevailing interest rates in the market (Kanungo, 2018). Some crowding out is also confirmed by reduced borrowings of non-financial corporations. The private non-financial corporates have been using internal resources and have reduced reliance on borrowings. References FSB (2018), “Financial Crisis and Information Gaps, Second Phase of the G20 Data Gaps Initiative (DGI-2) Third Progress Report” International Monetary Fund and Financial Stability Board. Government of India (2012a), “Sequence of National Accounts India”, National Statistics Organisation, Central Statistics Office, Ministry of Statistics and Programme Implementation, Government of India. — (2012b), “Sources and Methods”, National Statistics, Central Statistics Office, Ministry of Statistics and Programme Implementation, Government of India. — (2015), “Changes in Methodology and Data Sources in the New Series of National Accounts Base Year 2011-12”, Central Statistical Organisation, Ministry of Statistics & Programme and Implementation, Government of India. — (2018), “Report of the Committee on Financial Sector Statistics”, Central Statistical Organisation, Ministry of Statistics & Programme and Implementation, Government of India. — (2019), “Back Series Estimation Base 2011-12 Methodology Document”, Central Statistical Organisation, Ministry of Statistics & Programme and Implementation, Government of India. IMF (2016), “Monetary and Financial Statistics Manual and Compilation Guide”, International Monetary Fund. OECD (2018), “National Accounts of OECD Countries, Financial Balance Sheets 2018”, OECD Publishing, Paris, https://doi.org/10.1787/na_fbs-2019-en. RBI (2015); “Report on the Working Group on Compilation of Flow of Funds Accounts of The Indian Economy”, Reserve Bank of India. — (2017), “Flow of Funds Accounts of The Indian Economy:2015-16”, RBI Bulletin, August 2017, Reserve Bank of India. — (2016), “Report on Trends and Progress of Banking in India”, Reserve Bank of India. — (2018), “Report on Trends and Progress of Banking in India”, Reserve Bank of India. — (2017), “Annual Report 2016-17”, Reserve Bank of India. — (2018), “Financial Stability Report”, December 2018, Reserve Bank of India. — (2019); “Bank Deposits: Underlying Dynamics”, RBI Bulletin, May, Reserve Bank of India. — (2018), “State Finances: A Study of Budgets of 2017-18 and 2018-19”, Reserve Bank of India. SNA (2008), “System of National Accounts”, United Nations, the European Commission, the Organisation for Economic Co-operation and Development, the International Monetary Fund and the World Bank Group. Van de Ven, P. and D. Fano (eds.) (2017), Understanding Financial Accounts, OECD Publishing, Paris, https://doi.org/10.1787/9789264281288-en.
|