Renewable sources of energy, though still minuscule in India’s overall energy mix, are nonetheless transforming the power scenario by moderating spot prices of electricity significantly. This impact is likely to magnify going forward, with the potential of altering the underlying electricity supply-demand and price dynamics significantly. Introduction The power generation sector in India is undergoing a transformation with the growing prominence of Renewable Energy (RE). While thermal power remains the mainstay, India’s energy-mix is tilting in favour of RE whose share in total power generation has increased from 3.7 per cent in 2008-09 to 9.2 per cent in 2018-19. Further, the competitiveness of Renewable Energy Sources (RES) has improved significantly with 64 per cent reduction in price of solar energy in the last five years. These developments are altering electricity price dynamics quite dramatically - average electricity price discovered in the spot market was about 33 per cent lower than the price embedded in long-term Power Purchase Agreements (PPAs) between Distribution Companies (DISCOMs) and power producers in the last five years. At a time when most Thermal Power Plants (TPPs) are reeling under severe financial stress, falling prices are undermining their viability. Instances of DISCOMs not honouring their commitments of buying electricity under PPAs, and TPPs selling power on the spot market at below PPA negotiated prices are symptoms of this distress in the energy sector1. This resembles what happened to the crude oil market with the entry of shale gas. Despite a mere 1.5 per cent share in global crude oil supply, shale oil has dampened price pressures and held back new investment plans in the sector across the Organisation of the petroleum Exporting Countries (OPEC) and non-OPEC countries. Typically, TPPs operate with a cost structure characterised by high operating leverage –minimum load capacity in electricity generation with a fixed cost base – and, therefore, their profits/earnings is highly sensitive to the scale of capacity utilisation and revenue realised. Revenue is a function of volume of electricity sold to the grid (proxied by plant load factor) and price realised per unit of electricity, both of which are impacted by the rising importance of renewables. TPPs with a high share of capacity committed with DISCOMs through long-term contracts (PPAs) may be relatively better off, but over a longer horizon, DISCOMs may prefer to renegotiate existing contracts, including as current contracts expire. These developments carry wider ramifications, including for investment and bank lending to thermal power generation companies. The aim of this article is to examine electricity price dynamics in India in the context of developments taking place in the RE sector. Section II discusses the stylised evidence about the increasing prominence of renewable energy and policy impetus for it. Section III delves into the evolution and functioning of electricity exchanges and price discovery mechanisms. Section IV presents the data sources, methodology and key results. Section V offers concluding observations and some policy perspectives. II. Renewable Energy in India: Some Stylised Evidence RES have accounted for the majority share in incremental power generation capacity for three successive years; its’ share being 67 per cent between 2016-17 and 2018-19 (Chart 1a). This period is co-incident with historically low levels of demand-supply mismatch and capacity utilisation of TPPs, dis-incentivising investment in additional capacity (Chart 1b). The investment in additional RES capacity is driven by its improved competitiveness vis-à-vis conventional thermal power, brought about by a steep decline in technology costs, particularly for solar power (Chart 1c). With the ramp-up in generation capacity, its’ share in overall generation has also registered a significant rise (Chart 1d)2. 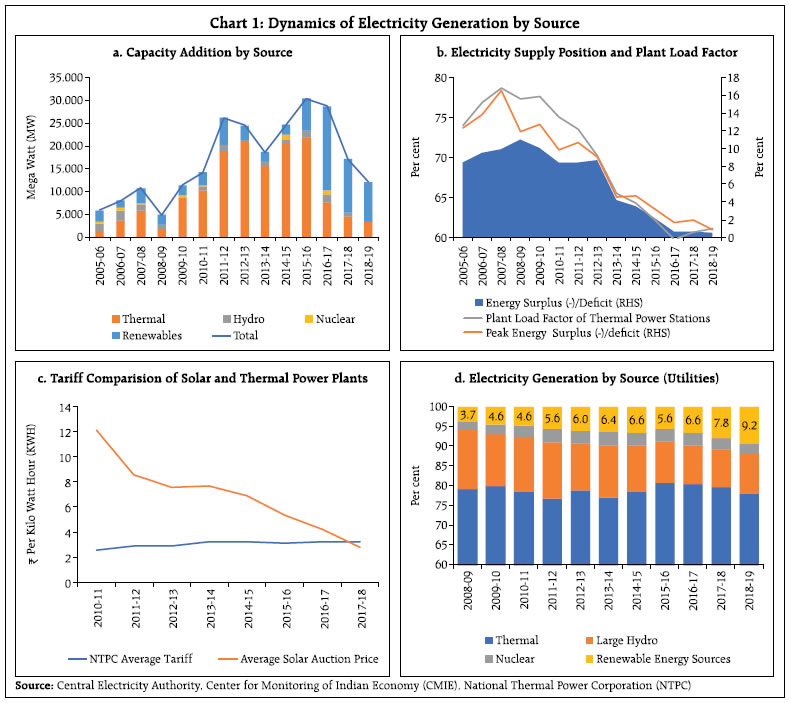 In addition to improved competitiveness, investment in RES has also benefited from government policy impetus. Renewables are crucial to fulfilling India’s strategic energy policy objectives of reducing reliance on imported fossil fuel and curbing carbon emissions to address climate change commitments under the 2015 Paris Accord and reinforced in subsequent meetings of the Conference of Parties (COP). The Paris Agreement targets to limit global temperature increase to below 2 degrees Celsius above pre-industrial levels, through Nationally Determined Contributions (NDC) by the signatories. India has committed to reduce its emissions intensity of GDP by 33 to 35 per cent (from 2005 level), achieve 40 per cent share of non-fossil fuel sources in cumulative electricity installed capacity and create an additional carbon sink of 2.5 to 3.0 billion tonnes of CO2 equivalent by 2030. The Union Government announced an ambitious target of 175 Giga Watts (GW) RE capacity by 2022, which was further increased to 227 GW. India has also taken a leadership role in international cooperation for harnessing technology and finance for solar power development with the establishment of International Solar Alliance (ISA). The policy support for RES, which had traditionally been in the form of fiscal incentives (tax breaks, accelerated depreciation) moved towards providing generation-based incentives with the introduction of the Electricity act, 2003. In particular, Feed in Tariff (FIT) which aims at regulating the tariff at which DISCOMs enter into long term PPAs with generating companies and must-run status which guarantees despatch of generation from RES, irrespective of demand conditions. FIT was generally fixed at cost-plus levels, but as RE costs declined over time, the FIT regime is being replaced by auctions to discover tariff levels. Also, Renewable Purchase Obligation (RPO) was introduced in 2003, which mandates DISCOMs and captive power users to procure a minimum share of their power requirement from RES, thereby ensuring adequate demand for generation from RES. An alternative to FIT regime was provided with the introduction of Renewable Energy Certificate (REC) in 2010 that aims to address the mismatch between RE potential and RPO targets across states by establishing a market mechanism for trade in credit for energy purchased for RES sources3. However, the REC route has not gained much traction and accounted for only 5.7 per cent of total RE capacity by 2017-18, possibly due to lax compliance of RPO mandate that reduces the demand of RECs. Recent policy initiatives are expected to provide a further impetus to the development of RES. The central government has increased the RPO targets from 17 per cent (of total power purchased by DISCOMs and captive power users) during 2018-19 to 21 per cent by 2021-22. With the increase in RPO targets and emphasis on adherence through creation of RPO Compliance cell by Ministry of Renewable Energy, REC route could potentially increase its share. Further, in February 2016, inter-state transmission charges4 for solar and wind energy generation were waived off for all projects commissioned up to March 31, 2022. However, the draft National Energy Policy 2017 envisages the gradual withdrawal of must-run status and non-levy of inter-state transmission costs to achieve non-discriminatory despatch and expose these competitive technologies to market discipline. The growth in renewables is expected to fulfill an increasing share of India’s electricity demand. Over the medium-term, however, as renewable energy stabilises and strengthens, thermal power plants will have to be harnessed as demand expands with rising per capita consumption. The peak demand on grid connected power is projected to increase from 161.8 GW in 2016-17 to 225.8 GW in 2021-22 and 298.8 GW in 2026-27. While the projected increase till 2021-22 can be met through existing capacity and new additions already in the pipeline, incremental thermal capacity of 46GW is projected to be required by 2026-27 to meet the increase in peak demand (GOI, 2017)5. III. Electricity Price Dynamics The Electricity Act, 2003, marked the beginning of market determined electricity price discovery. The Act provides for non-discriminatory market access for Independent Power Producers (IPPs) and recognises trading as a legal activity. Competitive price discovery was incentivised in 2008 when the government allowed power trading on exchanges. Currently, there are two power exchanges in the country – Indian Energy Exchange (IEX) and Power Exchange of India Limited (PXIL) – that commenced operations in June 2008 and October 2008, respectively. IEX commands a market share of 98.4 per cent by volume of power transacted through exchanges (in 2017-18). These measures resulted in the proliferation of market-based short-term contracts, though long-term contracts remain the mainstay for fulfillment of bulk power requirement of DISCOMs. The share of electricity traded through short-term market instruments has increased consistently over the last decade, especially through power exchanges (Chart 2a). DISCOMs are the biggest players in the market, accounting for over half of buy side volume of electricity transacted at IEX and over one third of sell side volumes. Open access consumers also have a significant share in buy side volumes, even though their participation has been hindered by the imposition of additional surcharges and high transmission charges on purchases from power exchanges (Chart 2b).  Increased volume has been accompanied by a steep decline in the average price of electricity transacted through short-term contracts, especially through power exchanges. The volatility6 of daily prices has also declined from over 20 per cent in 2008-09 to 11.1 per cent in 2017-18 (Chart 3a). 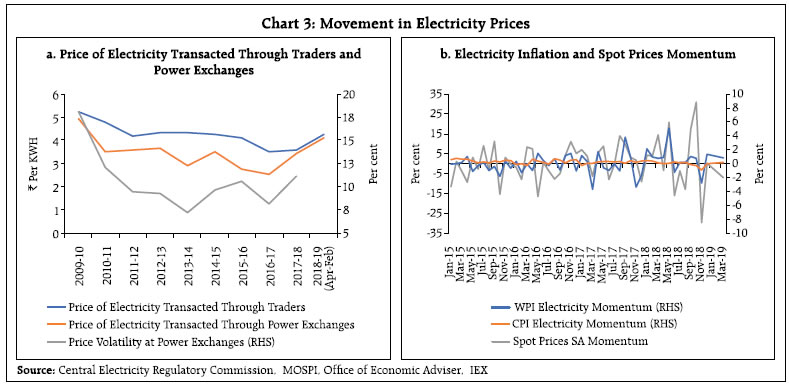 Trade in power exchanges is carried out in contracts based on day-ahead and term-ahead markets. Apart from physical trading, energy exchanges also facilitate trading in RECs. The day-ahead market refers to the trading window for deliveries for any time blocks (15 minutes in case of Indian exchanges) in 24 hours of the next day while the term-ahead market refers to the trading window for deliveries on a term basis for a future date (up to 11 days in the case of IEX). Similar to international exchanges, the day-ahead market dominates the volume of trade at power exchanges in India. In day-ahead markets, price calculation algorithm matches buy and sell bids for each 15-minute block. The intersection of aggregate demand and supply curves, based on bids submitted by market participants determines the market clearing price for each trading block. An increase in generation of RE impacts both demand and supply of electricity at the exchange. The demand from DISCOMs might decrease given the must-run status of RE, while the supply from IPP’s to the spot market could increase given minimum load capacity of TPPs, thereby exerting downward pressure on prices. Analysing the relationship of spot prices with other price indices, it was observed that while the administered nature of household and agricultural electricity prices results in little co-movement7 between CPI inflation for electricity and spot prices in exchanges, there is evidence of co-movement between spot prices and the WPI inflation in electricity (Chart 3b). The co-movement between spot prices and WPI electricity inflation is partly explained by the participation of industrial firms as open access consumers in the spot market impacting their electricity input price. In contrast, even as spot prices have consistently fallen over the last five years, CPI electricity inflation remained sticky at around 3.0 per cent8. IV. Methodology, Period of Study and Results Against the backdrop of these stylised facts, a quantitative estimation of the impact of RE generation on the spot price of electricity assumes critical importance for the near-term energy outlook and the prospects for energy mix in India. An Autoregressive Distributed Lag (ARDL) framework (Pesaran, 1999 and 2001) is adopted to accommodate different orders of integration - I(0) and I(1) - among the variables used. This empirical exercise uses monthly data from Central Electricity Authority (CEA) and IEX for the period April 2013 to September 2018. | Table 1: Empirical Results – Autoregressive Distributed Lag (ARDL) Framework | | (Dependent Variable: Spot price of Electricity) | | Explanatory Variables | Coefficient | t-statistics | p-value | | log.Spotprice(-1) | 0.53 | 5.16 | 0.00* | | log.Spotprice(-2) | 0.48 | 4.69 | 0.00* | | log.ThermalVol | 0.83 | 3.35 | 0.00* | | log.RenewableVol | -0.44 | -3.42 | 0.00* | | log.RenewableVol(-1) | 0.26 | 2.20 | 0.03** | | log.HydroVol | 0.26 | 1.58 | 0.12# | | Constant | -9.58 | -2.66 | 0.01* | | Exogeneous Variables | | | | | log.CoalImport | -0.22 | -2.06 | 0.04** | | Ratio.Spot_Total | 0.14 | 2.89 | 0.00* | Diagnostics
 = 0.81; SEE = 0.087; F-statistic = 32.76 (p-value = 0.00) = 0.81; SEE = 0.087; F-statistic = 32.76 (p-value = 0.00)
*: 1% level of significance; **: 5% level of significance; #: Insignificant |
| Where, | | | SpotPrice | : Seasonally Adjusted (SA) monthly average spot price of electricity volume traded/cleared in IE | | ThermalVol | : SA volume of energy generated per month from thermal sources | | RenewablesVol | : SA volume of energy generated per month from renewable sources | | CoalImportVol | : SA volume of coal imports | | HydroVol | : SA hydro electricity generated per month | | Ratio.Spot_Total | : SA ratio of volume of monthly electricity traded to total generated | | Source: Authors’ Estimates. | Distributed Lag (ARDL) framework (Pesaran, 1999 and 2001) is adopted to accommodate different orders of integration - I(0) and I(1) - among the variables used. This empirical exercise uses monthly data from Central Electricity Authority (CEA) and IEX for the period April 2013 to September 2018. The results (Table 1 and Annexure I) suggest that the volume of thermal power and RE with coal imports and ratio of volume traded at the exchange to total power generated as exogeneous variables influence spot prices of electricity in a statistically significant manner. There is robust evidence of persistence in electricity price. Thermal energy production remains a dominant influence on price formation, given that it constitutes about 80 per cent of power generation and is more expensive9. The results show that RE generation helped to reduce spot prices on an ongoing basis, especially, as solar power has become cheaper than conventional sources of energy, albeit with fluctuations in the supply10. The impact of hydro-electricity on spot prices is found to be statistically insignificant, possibly reflecting miniscule share in total energy mix and captive ownership by the government. Structural Vector Auto Regression (SVAR) results also suggest that the impact of RE generation in depressing the daily average IEX spot price of electricity is significant11. Thermal generation imparts upside to the daily average spot price due to elevated cost of production. Impulse responses using Cholesky decomposition12 suggest that one unit increase in RE generation leads to a peak decline of 0.1 unit in the daily average market clearing price (Annexure II). Thermal plants respond to higher renewable volumes and lower market clearing prices by reducing plant load factors and as a result, total volumes traded in exchanges decline. V. Conclusion This article highlights the increasing role of RE in the pricing of electricity, in spite of its low share in total power supply. Going forward, cost effective solar panels, storage technologies, and the realisation of RE capacity target of 227 GW by 2022 could potentially drive spot price of electricity down further. However, this poses a challenge for the viability of thermal power plants which are already under significant financial stress but remain essential for future energy security. Urgent policy intervention is required to address the financial stress faced by the thermal sector currently, and to prepare the sector for the future. A key requirement in this regard will be to adapt the technology of existing power plants to operate flexibly at lower baseload capacities. The Ministry of Power constituted a task force in May, 2016 under the aegis of the Indo-German Energy Forum to recommend measures for flexibilisation of thermal power plants. Another policy option is the creation of a capacity market for electricity that functions alongside the existing electricity market in which only the maintenance of capacity is traded and explicitly remunerated. This would incentivise the backstop role of thermal capacity in the face of peak demand, while buffering against the volatility in RE generation. References Central Electricity Regulatory Commission, “Report on Short-term Power Market in India: 2017-18”, http://www.cercind.gov.in/2018/MMC/AR18.pdf Economic Survey 2016-17, “State of the Economy: An Analytical Overview and Outlook for Policy (Chapter 1)”, https://www.indiabudget.gov.in/budget2017-2018/es2016-17/echap01_vol2.pdf Indian Energy exchange, day-ahead market data, https://www.iexindia.com/ India Energy Exchange (July 2018), “IEX strives for RE integration into power exchanges - Interview”, https://www.iexindia.com/Uploads/ Articles/03_08_2018IEX%20-%20Interview%20 EPR%20July%2018.pdf India Energy Exchange, “Market Snap Shot – Spot Price”, https://www.iexindia.com/marketdata/market_snapshot.aspx Indo – German Energy Programme Green Energy Corridors (2015), “Report on Market Design for Capacity Market in India”, https://mnre.gov.in/file-manager/UserFiles/Report-on-Market-Design-for-Capacity-Market-in-India.pdf Lütkepohl, Helmut (1991), “Introduction to Multiple Time Series Analysis”, New York: Springer-Verlag. Mamdouh G. Salameh (2013), “Impact of U.S. Shale Oil Revolution on the Global Oil Market, the Price of Oil & Peak Oil”, https://www.iaee.org/en/publications/newsletterdl.aspx?id=202 Ministry of Statistics and Programme Implementation, Govt. of India, CPI electricity data, http://164.100.34.62:8080/Default1.aspx Niti Aayog (2017), “New Energy Policy (NEP) (Draft)”, http://niti.gov.in/writereaddata/files/new_initiatives/NEP-ID_27.06.2017.pdf Office of the Economic Adviser, Govt. of India, Ministry of Commerce & Industry, WPI electricity data, http://eaindustry.nic.in/home.asp Power System of Operation Corporation Limited, Monthly reports, https://posoco.in/reports/monthly-reports/monthly-reports-2018-19/ Pesaran, M. and Shin, Y. (1999), An Autoregressive Distributed Lag Modeling Approach to Cointegration Analysis, in S. Strom, (Ed.) Econometrics and Economic Theory in the 20th Century: The Ragnar Frisch centennial Symposium, Cambridge University Press, Cambridge. Pesaran, M.H., Shin, Y. and Smith, R.J. (2001), Bounds testing approaches to the analysis of level relationship, Journal of Applied Economics, 16, 289-326. Task force committee report on Flexibilisation of Thermal Power Plants (2017), http://www.cea.nic.in/reports/others/thermal/trm/taskforce_report.pdf
Annexure I Renewable Energy and Electricity Price Dynamics in India - ARDL Autoregressive Distributed Lag (ARDL) framework was chosen as the appropriate methodology to assess the price dynamics of electricity traded at spot markets during April 2013 – September 2018. Taking log of seasonally adjusted variables used in the exercise, Spot price (India Energy Exchange, IEX) as dependent variable is regressed on volume generated of thermal power, renewable energy and hydro power; in addition to including coal import and ratio of volume traded at IEX to total power generated as exogenous variables. Thermal, renewable and hydro volumes are I(0) while spot price, coal import and ratio of volume traded to total power generated are I(1) based on the Augmented Dickey Fuller (ADF) unit root tests criteria (Table 1). The AIC test suggests appropriate lag length of two (2). The results confirm that there is statistical evidence of renewable energy contributing to moderation in spot prices of electricity even as there is persistence in price dynamics and thermal power remained the main determinant. The F and T-Bound tests with t-stats of 2.86, the absolute value of which was lower than the I(0) and I(1) values of 3.23 (at 5 per cent and below) and I(1) of 4.35; and that of t-Stats=-0.111 with -2.57 and -3.46, respectively for I(0) and I(1) confirmed that there was no cointegrating relationship between the variables (Table 2). | Table 1: ADF Test of Unit Root – Monthly Data | | Variables | Without trend t-statistics | With Trend t-statistics | | log.Spotprice | -2.09 | -2.08 | | log.ThermalVol | -1.36 | -5.32* | | log.RenewableVol | -0.14 | -3.20** | | log.HydroVol | -3.42** | -3.57** | | Ratio.Spot_Total | -0.67 | -1.74 | | log.CoalImport | -2.43 | -3.00 | *: 1% level of significance; **: 5% level of significance;
***: Significant at 10%
Source: Authors’ Estimates. |
| Table 2: F and T-Bounds Test | | Null Hypothesis: No levels relationship | | Test Statistic | Value | Signif. | I(0) | I(1) | | | | Asymptotic: n=1000 | | | F-statistic | 2.860536 | 10% | 2.72 | 3.77 | | k | 3 | 5% | 3.23 | 4.35 | | | | 2.50% | 3.69 | 4.89 | | | | 1% | 4.29 | 5.61 | | Actual Sample Size | 62 | Finite Sample: n=65 | | | | | 10% | 2.843 | 3.923 | | | | 5% | 3.435 | 4.583 | | | | 1% | 4.69 | 6.143 | | | | Finite Sample: n=60 | | | | | 10% | 2.838 | 3.923 | | | | 5% | 3.415 | 4.615 | | | | 1% | 4.748 | 6.188 | | t-Bounds Test | Null Hypothesis: No levels relationship | | Test Statistic | Value | Signif. | I(0) | I(1) | | t-statistic | 0.111304 | 10% | -2.57 | -3.46 | | | | 5% | -2.86 | -3.78 | | | | 2.50% | -3.13 | -4.05 | | | | 1% | -3.43 | -4.37 | | Source: Authors’ Estimates. | Breusch-Godfrey Serial Correlation LM Test with F-stats of 2.49 and probability F(2,50)=0.093 and probability of chi-square with probability value of 0.064, greater than 0.05 - insignificant confirms that there was no serial correlation (Table 3). The calculated variance inflation factors (VIF) of around 5 was within the acceptable limit indicating there is no multi-collinearity among the regressors. | Table 3: Breusch-Godfrey Serial Correlation LM Test | | F-statistic | 2.48495 | prob. F(2,51) | 0.0934 | | Obs*R-squared | 5.505347 | prob. Chi-Square(2) | 0.0638 | Note: Probabilities of F-stats and Chi-square which are greater than 0.05 confirms that there was no serial correlation.
Source: Authors’ Estimates. | Wald test of joint significance of the impact of RE volumes on current month’s spot price, shows that the negative impact of current month RE volumes is not nullified by positive impact of previous month’s RE volumes (Table 4). | Table 4: Wald Test | | Test Statistic | Value | df | Probability | | t-statistic | -2.58873 | 53 | 0.0124 | | F-statistic | 6.7015 | (1, 53) | 0.0124 | | Chi-square | 6.7015 | 1 | 0.0096 | | Null Hypothesis: C(4)+C(5)=0 | | | | | Normalized Restriction (= 0) | | Value | Std. Err. | | C(4) + C(5) | | -0.17816 | 0.068822 | Restrictions are linear in coefficients.
Source: Authors’ Estimates. |
Annexure II Renewable Energy and Electricity Price Dynamics in India - Impulse Response
|