Demonetisation generated a sudden jump in the share of savings deposits and over 80 per cent of incremental deposits during 2016-17 were driven up by individuals. Branch expansion and financial inclusion are playing a significant role in formalising savings into the banking system. A hierarchical cluster analysis suggests that a notable reduction in the intensity of cash transactions occurred in nine states/union territories (UTs) on account of demonetisation, which turned out to be transient, whereas there were no perceptible differences in cash habits pre- and post-demonetisation in some other states. Introduction Deposits mobilisation by banks transforms households’ and corporates’ savings into productive capital for financing economic activity. Key to the efficiency of financial intermediation and core to banks’ asset-liability management is the tenor and stability of deposit flows – since other sources of funds for banks depend on general liquidity conditions and are often of shorter duration than customer deposits. As a part of their deposit collection strategy, banks offer a range of products to suit the requirements of different stakeholders (corporates; households; non-residents; Government; financial sector entities) and population groups (rural; urban; semi-urban; metropolitan) – savings accounts that provide customers with the comfort of liquidity; fixed deposits that ensure more stable funds for banks at a relatively higher cost; and non-interest bearing current accounts that offer business-friendly banking services, often with overdraft facilities. It is in this context that monitoring of the composition and ownership of deposit mobilisation throws up valuable insights for designing appropriate policy responses in order to secure financial stability while ensuring adequate flows to productive sectors of the economy. Country practices reveal considerable diversity in regulatory and supervisory monitoring. For instance, the US Federal Deposit Insurance Corporation (FDIC) collects year-end deposit data from FDIC-insured institutions, including insured US branches of foreign banks. On the other hand, the Bank of England conducts a bank liabilities survey on a quarterly basis. These data are useful in ascertaining changes in ownership patterns and other characteristics, and their findings are keenly analysed for understanding underlying behavioural developments, typically of households (Summers, 1979; Calem and Carlino, 1991; Yener, et al., 2001; Vernikov, 2007; Han and Melecky, 2017). The Reserve Bank conducted its first survey on the ownership pattern of deposits with scheduled banks1, with the last day of the year 1945 as the reference date, “to analyse the community’s propensity to consume which, along with other factors determines the general level of prices and employment” (Savkar, 1947). The focus of the survey was on demand deposits in the post-war era, which witnessed an unprecedented expansion in most countries due to war financing. Till 1972, the survey of ownership of deposits was conducted through head offices of banks at sporadic frequency (RBI, 2007). As the geographical spread became core to the social objective of banking, the survey was brought under the basic statistical return (BSR) system in 1976 with biennial reporting at branch-level, and it was rechristened as BSR-4. The format and coverage of the survey have undergone changes over the period and its frequency was made annual since 1990. At present, all scheduled commercial banks (SCBs), including regional rural banks (RRBs), report under BSR-4 which, in effect, is a census. This article, which addresses the years 2016-17 and 2017-18 as its reference period2, is confronted by a large shock to the monetary and financial system with spillovers to the real economy. On November 8, 2016 currency notes of ₹ 500 and ₹ 1000 denominations accounting for 86.9 per cent (RBI, 2017) of the total notes in circulation were abruptly withdrawn and ceased to be legal tender. As people herded at eligible avenues of surrender, a wall of liquidity moved through the financial system. As this article goes on to show, current and saving deposits flooded into the banking system and, although the stock of term deposits declined marginally in terms of its share in total deposits, there was a sharp depletion in their share in incremental deposits. The Reserve Bank’s liquidity management operations and financial prices were impacted. Payment habits underwent a shift in favour of digital modes. Moreover, alterations in saving behaviour have been reported: as per preliminary estimates, net financial assets of the household sector increased in the form of currency, despite an increase in their liabilities (RBI, 2018). Over 2017-18, the RBI engaged in a war-time effort to remonetise the economy by stepping up printing and distribution of currency notes and by introducing the denomination of ₹ 2000. By March 2018, remonetisation was complete and although the stock of currency in circulation was restored to its pre-demonetisation level, the patterns underlying bank deposits were lagged and incomplete in their return to normalcy. Against this backdrop, the main motivation driving this article is to study the impact of demonetisation and the subsequent rapid remonetisation on the patterns of deposit mobilisation by banks by examining the composition and ownership of bank deposits over the reference years. In doing so, implications for financial inclusion are also addressed. The article also captures the behaviour of foreign currency non-resident (FCNR) deposits in the context of the unwinding of special FCNR(B) swaps with the Reserve Bank during September-November 2016 and the gradual reversion of these deposits to normalcy over 2017-18. The rest of the article is organised into three sections. Section II discusses the stylised facts about the composition and institutional ownership of deposits. Section III presents the results of a hierarchical cluster analysis, which examines the variability in deposits among states/UTs during the period of study. Section IV summarises the major findings and concludes the article. II. The Stylised Evidence Bank deposits generally tend to co-move with economic activity. Since 2010-11, this association appears to have become closer, pointing to the role of branch expansion and financial inclusion in formalising savings into the banking system (Chart 1). In 2016-17, however, a distinct deviation from this co-movement was observed, when an overwhelming share (66.2 per cent) of incremental deposits took the form of savings deposits in sharp contrast to the average share of 27.5 per cent during the 15-year period 2001-2016 (Chart 2). Correspondingly, term deposits accounted for less than 20 per cent of incremental deposits as against an average share of around 63 per cent during 2001-16. During 2017-18, the growth of savings deposits remained robust, indicating a degree of hysteresis in depositors’ preferences. Notwithstanding the demonetisation-driven jump, aggregate deposit growth moderated during 2016-18 in relation to the pre-demonetisation years. This counter-intuitive development needs to be viewed in the context of two factors which were simultaneously at work. Firstly, in the financial sector of the economy, there was a sharp reduction in interbank deposits, reflecting efficient cash management by banks aided by rapid strides in the real-time funds transfer technology commencing from 2013- 14. Secondly, in the foreign sector, the redemption of FCNR(B) swaps – contracted in the defence against the taper tantrum – produced a contraction in non-resident deposits in the second half of 2016-17, which began to get recouped in 2017-18 (Table 1). Consequently, the share of the financial sector in deposits of SCBs declined from 10.0 per cent in March 2013 to 5.9 per cent in March 2018. An acceleration in deposit growth occurred across states/Union Territories (UTs) during 2016-17, which moderated in 2017-18. Among the major contributors of incremental deposits, Uttar Pradesh and Gujarat improved their rankings in 2016-17 and states like Bihar, Haryana and Rajasthan joined the top 10 club, although Bihar and Rajasthan could not sustain their positions in 2017-18. Most of the north-eastern states also recorded high deposit growth during this period. In terms of incremental deposits from households, Gujarat, Maharashtra and Punjab improved their ranks within the top 10 club in 2016-17 but Gujarat and Punjab slipped out of the club in the following year (Tables A1.1 and A1.2). | Table 1: Deposits Growth – Institutional Sectors | | (per cent) | | Institutional Sector | Compound Annual Growth Rate | Annual Growth | | 2002-09 | 2009-16 | 2016-17 | 2017-18 | | I. Government Sector | 25.0 | 12.2 | 23.4 | 1.5 | | II. Non-Financial Private Corporate Sector | 37.2 | 8.9 | 5.8 | 4.8 | | III. Financial Sector | 24.5 | 9.9 | -13.7 | 14.6 | | IV. Household Sector | 17.8 | 14.4 | 14.1 | 7.2 | | V. Foreign Sector | 6.3 | 23.5 | -2.2 | 12.7 | | Total Deposits | 20.0 | 13.6 | 11.2 | 6.9 | | Source: RBI. |
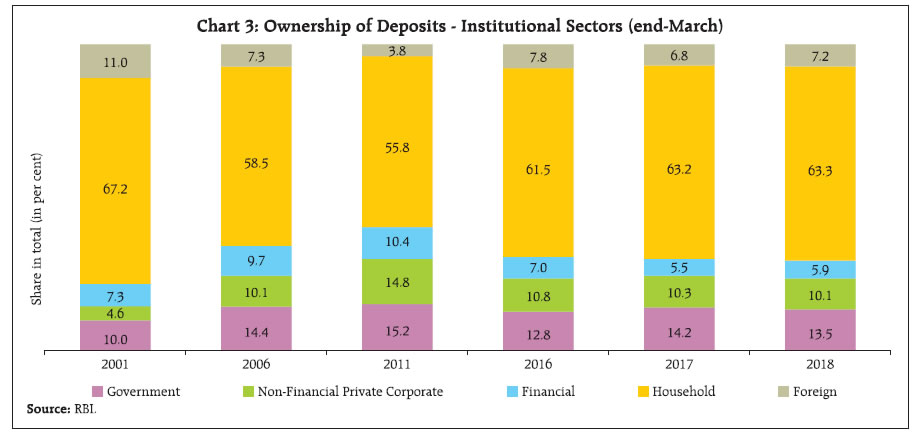 The household3 sector has accounted for 60 per cent of deposits with the Indian banking system in recent years (Chart 3). The share of the household sector increased significantly during 2016-17 and stayed at the same level up to March 2018, although the growth of its deposits moderated in 2017-18 from the demonetisation-induced growth. The household sector typically holds more than half of its deposits in term deposits and over one-third in savings deposits. However, deposit of specified bank notes (SBNs) in their savings bank accounts generated a sudden jump in their share of savings deposits in 2016-17 and 2017- 18. At 41.7 per cent, the share of savings deposits in the total deposits of households reached a new high in March 2018 (Table 2). The share of individuals within the household sector jumped to a new high on March 2017 before reducing marginally by March 2018. During 2016-17, incremental deposits were driven up by individuals (82 per cent), followed by Government entities (27 per cent); in the latter, central and State Governments had a combined share of 17 per cent (Chart 4). The overall behaviour of households’ bank deposits in the recent period has also been affected by schemes such as the Pradhan Mantri Jan Dhan Yojana (PMJDY), the Pradhan Mantri Suraksha Bima Yojana (PMSBY), the Pradhan Mantri Jeevan Jyoti Bima Yojana (PMJJBY) and the Atal Pension Yojana (APY). Bank deposits have remained the preferred instrument of household savings in financial assets, followed by provident and pension funds, and life insurance fund (Table A2). In 2017-18, however, there was a marked shift, with currency holdings becoming the preferred avenue for household saving. While this reflected the remonetisation that was underway, it suggests that households still prefer cash for transactional needs in spite of the after-effects of demonetisation and the follow-on remonetisation. | Table 2: Composition of Households’ Deposits – Type of Deposits | | (per cent) | | Type of Deposits | 2001 | 2006 | 2011 | 2016 | 2017 | 2018 | | Current | 9.0 | 10.2 | 8.9 | 5.4 | 5.9 | 5.8 | | Savings | 30.8 | 39.0 | 37.1 | 36.9 | 41.1 | 41.7 | | Term | 60.3 | 50.7 | 54.1 | 57.7 | 53.0 | 52.5 | | Total | 100.0 | 100.0 | 100.0 | 100.0 | 100.0 | 100.0 | | of which, Individuals | 83.5 | 80.2 | 75.4 | 84.1 | 86.7 | 86.6 | | Source: RBI. | Growth in households’ deposits was generally the lowest for rural branches across population groups till 2010-11 but became faster than urban/ metropolitan areas during 2011-16 (Table 3). In 2016-17, the growth pattern shifted in favour of metropolitan and semi-urban centres, followed by an across the board moderation in the following year. Aided by their wide network of branches, public sector banks (PSBs) retained around three-fourth of households’ deposits (Table A3). Private sector banks, which are the second largest bank group, mobilised more deposits than PSBs during 2017-18. During demonetisation, private sector banks increased their share in the deposits of governments, households and the financial sector. Public sector banks held over 80 per cent of the Government sector deposits, but a portion of Government sector deposits moved to private sector banks in 2016-18 (Chart 5). The growth of bank deposits from non-financial private corporate sector slackened: incremental deposits stood at ₹ 622 billion and ₹ 543 billion, respectively, much lower than ₹ 1,011 billion and ₹ 1,580 billion, respectively, in the preceding two years. | Table 3: Growth in Households’ Deposits – Population Groups | | (per cent) | | Population Group | Compound Annual Growth Rate | Annual Growth Rate | | 2001-06 | 2006-11 | 2011-16 | 2016-17 | 2017-18 | | Rural | 8.8 | 15.7 | 17.3 | 9.5 | 9.2 | | Semi-urban | 9.9 | 18.7 | 16.5 | 16.4 | 8.1 | | Urban | 14.1 | 19.5 | 15.7 | 5.4 | 7.9 | | Metropolitan | 18.8 | 21.9 | 11.3 | 20.2 | 5.7 | | Total | 14.0 | 19.8 | 14.1 | 14.1 | 7.2 | Note: Population group classification for the period 2002-2005 is based on Census 1991, from 2006-2016 is based on Census 2001, after which it is based on Census 2011.
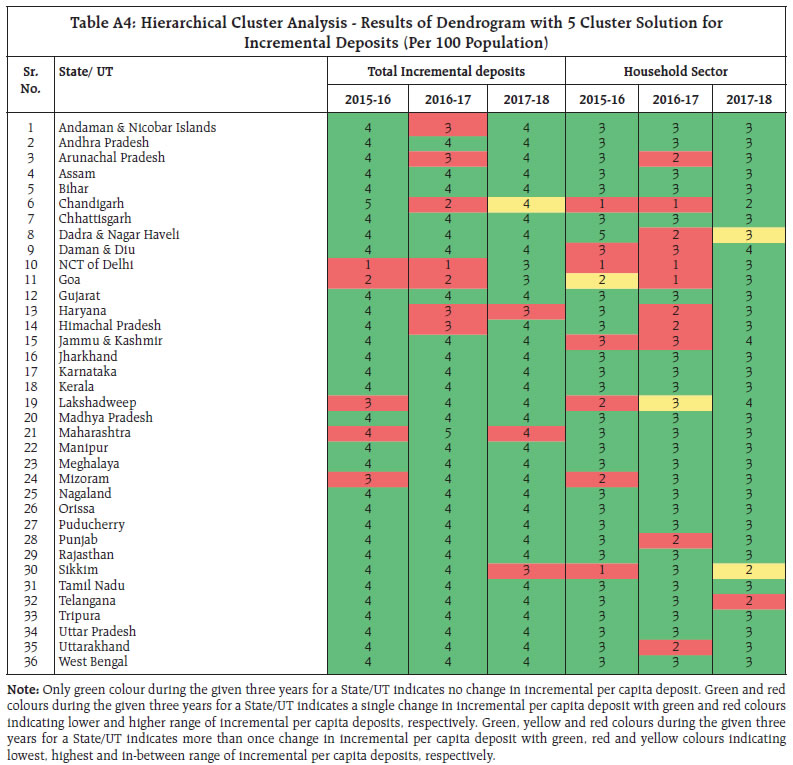
Source: RBI. | Metropolitan areas account for more than half of total deposits (Chart 6). Their share increased post demonetisation in March 2017, in spite of the large redemption of FCNR(B) deposits, which are mainly held by them. With increased emphasis on opening of branches in underbanked/ unbanked areas, including rural areas, hitherto untapped savings were mobilised through bank deposits. Consequently, deposit growth across population groups has witnessed convergence (Chart 7). III. Hierarchical Cluster Analysis (HCA) In this section, we analyse the variability in cash habits among geographical areas using hierarchical cluster analysis (HCA) in order to identify shift in patterns of deposits brought about by demonetisation which had resulted in a massive transfer of currency from the public to banks, with a significant portion not withdrawn immediately. HCA is a step-wise process in which at each step, two (out of n) objects/ clusters with the closest similarity based on a selected criterion are clustered into one (Everitt, et al., 2011; Hennig, et al., 2015). Eventually a hierarchy is built up from individual elements by progressively merging clusters. Among the several criteria identified to measure similarities/ dis-similarities between groups of clusters, the centroid method4, which is considered robust, is used here. The result of HCA is a binary tree or dendrogram with n-1 nodes in which branches are cut at a level when the jump in levels of two consecutive nodes is large. The HCA is employed for state-wise deposits (in ₹ million per 100 population) for three periods i.e., end-March 2016 (before demonetisation), end-March 2017 and end-March 2018 (after demonetisation). Incremental deposits per 100 population during 2015-16, 2016-17 and 2017-18 have also been used as a robustness check to validate the results. States are grouped into five hierarchical clusters using the centroid method. BSR- 4 data have been used for deposits and annual state-wise population has been estimated by extrapolating from the population census of India 2011 by applying annual growth rates in population between the 2001 and 2011 rounds of the census. The resultant clusters are sorted in descending order, with cluster-1 having the highest range of deposits and the lowest range is in cluster-5. Transition of a state/UT from one cluster to another shows major improvement / decline. Demonetisation brought about major improvement in per capita deposits of households of seven states/UTs namely Arunachal Pradesh, Dadra and Nagar Haveli, Goa, Haryana, Himachal Pradesh, Punjab and Uttarakhand (Table A4). This could not, however, be sustained in the following year. Incremental per capita deposits of households improved for Sikkim and Telangana after demonetisation. The UT of Chandigarh jumped from the lowest cluster to cluster-2 due to high per capita incremental deposit mobilisation during demonetisation; however, it fell back to cluster-4 post-demonetisation. National Capital Territory of Delhi moved to cluster-3 in the post-demonetisation phase from the highest cluster earlier. Maharashtra’s position fell during 2016-17 due to unwinding of FCNR(B) swap deposits but reverted thereafter. The majority of States/UTs were in cluster-5 in terms of per capita total outstanding deposits during the years of study (Table A5). In terms of per capita household sector deposits, Chandigarh, NCT of Delhi and Goa remained stable, occupying the top two clusters. There was a gradual decline in the number of States/UTs in the lowest cluster of household deposits. To sum up, the results of the HCA indicate -
a notable reduction in the intensity of cash transactions occurred in 9 out of 36 states/ UTs on account of demonetisation; -
this turned out to be transient, however, as these states/UTs reverted to cash as the preferred mode of transaction post-demonetisation; -
in states like Maharashtra, there were no perceptible differences in cash habits pre- and post-demonetisation, with the redemption of FCNR(B) swap producing a decline in deposits unrelated to demonetisation. IV. Conclusion Shifts in ownership and tenor of deposits provide valuable insights into payment habits, saving propensities and liquidity preferences. This article has the vantage position of studying these patterns under the impact of a shock – in this case, demonetisation – and its backwash. This event appears to have produced a permanent shift in deposit behaviour with households’ preference shifting to savings deposits and away from term deposits. This suggests a premium on liquidity induced by the shock, partly incentivised by lower rates of returns on term deposits and alternative avenues of saving which combine the benefits of liquidity and returns. While the withdrawal of SBNs caused a shift in payment habits away from cash, this has proven to be short-lived and mean reversion became evident in 2017-18 itself. Only two states show a break from the central tendency, with a decline in cash dependency. The results presented in this article draw from a census. They point to the fact that deposit and payment habits are inflexible across most states/ UTs in India and tend to return to steady state, even after large shocks. This has implications for banks’ deposit mobilisation strategies and business models. References Calem, P. S. and Carlino, G. A. (1991). “The Concentration / Conduct Relationship in Bank Deposit Markets”. The Review of Economics and Statistics, Vol. 73, No. 2, 268-276. Everitt, B. S., Landau, S., Leese, M. and Stahl, D. (2011). “Cluster Analysis”. John Wiley and Sons, New York. Han, R. and Melecky, M. (2017). “Broader use of saving products among people can make deposit funding of the banking system more resilient”. Journal of International Financial Markets, Institutions and Money, Vol.47, 89-102. Hennig, C., Meila, M., Murtagh, F. and Rocci, R. (Eds.) (2015). “Handbook of Cluster Analysis”. CRC Press. Registrar General of India: Census of India (1991, 2001 and 2011). Reserve Bank of India (2018): Annual Report. Reserve Bank of India: Articles on “Composition and Ownership Pattern of Deposits”, Reserve Bank of India Bulletin (various issues). Reserve Bank of India: Database of Indian Economy (https://dbie.rbi.org.in). Reserve Bank of India (2017): “Demonetisation and Bank Deposit Growth”. Mint Street Memo No. 01, August. Reserve Bank of India (2007): Manual on Financial and Banking Statistics. March. Savkar, D. S. (1947). “Ownership of Demand Deposits with Scheduled Banks: As on 31-12-1945”, Reserve Bank of India Bulletin, February. Sokal, R. R. and Michener, C. D. (1958). “A Statistical Method for Evaluating Systematic Relationships”. University of Kansas Science Bulletin, 38, 1409–1438. Summers, B. J. (1979). “Demand Deposits: A Comparison of the Behaviour of Household and Business Balances”. Economic Review. Federal Reserve Bank of Richmond (July/August). Vernikov, A. V. (2007). “Russia’s Banking Sector Transition: Where to?”. Bank of Finland, Institute for Economies in Transition, No.5. Yener, A., Evans, L. and Molyneux, P. (2001). “Bank Ownership and Efficiency”. Journal of Money, Credit and Banking, Vol.33, No.4, 926-954.
Appendix | Table A1.1: State-wise Incremental Deposits and Deposit Growth – Sorted According to Incremental Deposits of 2016-17 | | (Amount in ₹ Billion) | | Sr. No. | State/ UT | Incremental Deposit | Deposit Growth | | 2015-16 | 2016-17 | 2017-18 | 2015-16 | 2016-17 | 2017-18 | | 1 | Uttar Pradesh | 798 (3) | 1440 (1) | 705 (2) | 11.7 | 18.8 | 7.8 | | 2 | NCT of Delhi | 1044 (1) | 1122 (2) | 642 (3) | 11.8 | 11.4 | 5.8 | | 3 | Gujarat | 486 (7) | 866 (3) | 357 (7) | 10.0 | 16.3 | 5.8 | | 4 | Karnataka | 693 (4) | 786 (4) | 607 (4) | 10.8 | 11.1 | 7.7 | | 5 | West Bengal | 630 (5) | 748 (5) | 343 (8) | 11.3 | 12.1 | 4.9 | | 6 | Tamil Nadu | 601 (6) | 690 (6) | 477 (6) | 11.0 | 11.3 | 7.0 | | 7 | Haryana | 314 (12) | 587 (7) | 558 (5) | 14.1 | 23.0 | 17.8 | | 8 | Rajasthan | 274 (13) | 563 (8) | 191 (14) | 11.5 | 21.3 | 6.0 | | 9 | Bihar | 329 (11) | 503 (9) | 155 (15) | 14.7 | 19.6 | 5.0 | | 10 | Kerala | 481 (8) | 489 (10) | 214 (12) | 14.8 | 13.1 | 5.1 | | 11 | Punjab | 336 (10) | 459 (11) | 99 (19) | 12.7 | 15.3 | 2.9 | | 12 | Telangana | 370 (9) | 417 (12) | 208 (13) | 11.4 | 11.5 | 5.2 | | 13 | Andhra Pradesh | 187 (16) | 395 (13) | 257 (9) | 9.5 | 18.4 | 10.1 | | 14 | Odisha | 249 (14) | 365 (14) | 231 (10) | 13.1 | 16.9 | 9.1 | | 15 | Madhya Pradesh | 98 (19) | 331 (15) | 224 (11) | 3.5 | 11.3 | 6.9 | | 16 | Jharkhand | 207 (15) | 247 (16) | 125 (17) | 14.5 | 15.1 | 6.6 | | 17 | Chhattisgarh | 61 (22) | 213 (17) | 127 (16) | 6.1 | 19.9 | 9.9 | | 18 | Assam | 72 (21) | 191 (18) | 123 (18) | 7.3 | 18.0 | 9.8 | | 19 | Uttarakhand | 105 (17) | 177 (19) | 80 (21) | 11.7 | 17.6 | 6.8 | | 20 | Himachal Pradesh | 89 (20) | 133 (20) | 58 (22) | 14.5 | 18.9 | 6.9 | | 21 | Jammu & Kashmir | 99 (18) | 130 (21) | 99 (20) | 13.5 | 15.5 | 10.2 | | 22 | Goa | 55 (23) | 60 (22) | 32 (23) | 10.6 | 10.6 | 5.0 | | 23 | Chandigarh | 6 (31) | 48 (23) | 24 (24) | 1.1 | 8.5 | 3.9 | | 24 | Arunachal Pradesh | 9 (28) | 31 (24) | 12 (29) | 11.7 | 35.1 | 10.3 | | 25 | Tripura | 23 (24) | 28 (25) | 12 (30) | 13.4 | 14.3 | 5.6 | | 26 | Meghalaya | 20 (26) | 23 (26) | 12 (31) | 11.6 | 12.2 | 5.6 | | 27 | Puducherry | 20 (27) | 19 (27) | 17 (25) | 18.0 | 14.9 | 11.5 | | 28 | Nagaland | 9 (29) | 17 (28) | 5 (33) | 12.6 | 22.0 | 5.7 | | 29 | Manipur | 4 (35) | 17 (29) | 13 (28) | 6.0 | 27.6 | 16.6 | | 30 | Mizoram | 22 (25) | 14 (30) | 15 (27) | 55.0 | 22.3 | 20.2 | | 31 | Sikkim | 7 (30) | 9 (31) | 17 (26) | 11.4 | 13.2 | 21.5 | | 32 | Andaman & Nicobar Islands | 5 (33) | 8 (32) | 6 (32) | 15.2 | 23.2 | 14.9 | | 33 | Daman & Diu | 5 (32) | 6 (33) | 4 (34) | 14.8 | 14.7 | 8.2 | | 34 | Dadra & Nagar Haveli | 4 (34) | 5 (34) | 3 (35) | 13.5 | 17.1 | 7.6 | | 35 | Lakshadweep | 1 (36) | 1 (35) | 0 (36) | 15.7 | 9.0 | 4.1 | | 36 | Maharashtra | 972 (2) | -115 (36) | 1516 (1) | 4.5 | -0.5 | 6.8 | | ALL-INDIA | 8,686 | 11,024 | 7,569 | 9.7 | 11.2 | 6.9 | Note: Figures in brackets represent rank of the states/UTs for the corresponding year.
Source: RBI. |
| Table A1.2: State-wise Incremental Household Deposits and Household Deposit Growth – Sorted According to Incremental Household Deposits of 2016-17 | | (Amount in ₹ Billion) | | Sr. No. | State/ UT | Incremental Household Deposit | Household Deposit Growth | | 2015-16 | 2016-17 | 2017-18 | 2015-16 | 2016-17 | 2017-18 | | 1 | Uttar Pradesh | 831 (1) | 1086 (1) | 634 (1) | 15.7 | 17.7 | 8.8 | | 2 | Maharashtra | 470 (6) | 817 (2) | 628 (2) | 5.3 | 8.8 | 6.2 | | 3 | West Bengal | 540 (3) | 688 (3) | 241 (9) | 13.1 | 14.8 | 4.5 | | 4 | Gujarat | 346 (7) | 606 (4) | 121 (15) | 9.7 | 15.5 | 2.7 | | 5 | Tamil Nadu | 599 (2) | 510 (5) | 261 (7) | 16.7 | 12.2 | 5.5 | | 6 | Karnataka | 518 (5) | 499 (6) | 416 (4) | 13.5 | 11.5 | 8.6 | | 7 | NCT of Delhi | 535 (4) | 446 (7) | 260 (8) | 12.6 | 9.3 | 5.0 | | 8 | Haryana | 208 (13) | 433 (8) | 292 (5) | 12.2 | 22.8 | 12.5 | | 9 | Punjab | 231 (10) | 410 (9) | 51 (21) | 10.6 | 16.9 | 1.8 | | 10 | Madhya Pradesh | 301 (9) | 395 (10) | 141 (13) | 17.2 | 19.2 | 5.7 | | 11 | Rajasthan | 213 (12) | 378 (11) | 200 (10) | 11.1 | 17.8 | 8.0 | | 12 | Telangana | 220 (11) | 294 (12) | 608 (3) | 14.0 | 16.4 | 29.2 | | 13 | Bihar | 314 (8) | 294 (13) | 160 (11) | 19.3 | 15.1 | 7.2 | | 14 | Andhra Pradesh | 176 (16) | 279 (14) | 291 (6) | 12.1 | 17.2 | 15.3 | | 15 | Kerala | 160 (17) | 254 (15) | 138 (14) | 9.3 | 13.5 | 6.4 | | 16 | Odisha | 194 (15) | 222 (16) | 147 (12) | 16.8 | 16.4 | 9.3 | | 17 | Jharkhand | 197 (14) | 168 (17) | 97 (16) | 20.0 | 14.2 | 7.2 | | 18 | Chhattisgarh | 95 (20) | 140 (18) | 60 (18) | 14.6 | 18.7 | 6.8 | | 19 | Assam | 106 (19) | 132 (19) | 78 (17) | 15.1 | 16.3 | 8.3 | | 20 | Uttarakhand | 81 (21) | 128 (20) | 60 (19) | 13.0 | 18.1 | 7.2 | | 21 | Jammu & Kashmir | 116 (18) | 119 (21) | -74 (36) | 17.7 | 15.4 | -8.3 | | 22 | Himachal Pradesh | 68 (22) | 97 (22) | 54 (20) | 13.9 | 17.4 | 8.3 | | 23 | Goa | 23 (24) | 35 (23) | 16 (24) | 6.8 | 9.8 | 4.1 | | 24 | Chandigarh | 25 (23) | 31 (24) | 24 (22) | 7.8 | 8.9 | 6.3 | | 25 | Tripura | 19 (25) | 21 (25) | 17 (23) | 16.0 | 15.4 | 10.8 | | 26 | Arunachal Pradesh | 6 (30) | 20 (26) | 8 (28) | 9.5 | 30.9 | 9.1 | | 27 | Meghalaya | 9 (29) | 12 (27) | 10 (26) | 8.5 | 10.1 | 7.5 | | 28 | Puducherry | 12 (28) | 12 (28) | 9 (27) | 15.3 | 12.9 | 8.5 | | 29 | Nagaland | 5 (31) | 11 (29) | 0 (34) | 8.3 | 18.1 | 0.0 | | 30 | Manipur | 4 (32) | 9 (30) | 4 (30) | 10.4 | 21.2 | 7.9 | | 31 | Mizoram | 18 (26) | 7 (31) | 7 (29) | 70.7 | 15.8 | 14.6 | | 32 | Dadra & Nagar Haveli | -5 (36) | 6 (32) | 2 (32) | -19.8 | 30.6 | 6.7 | | 33 | Sikkim | 13 (27) | 4 (33) | 10 (25) | 33.3 | 7.7 | 18.4 | | 34 | Andaman & Nicobar Islands | 4 (33) | 4 (34) | 4 (31) | 16.6 | 14.9 | 12.1 | | 35 | Daman & Diu | 3 (34) | 3 (35) | 1 (33) | 13.6 | 11.3 | 2.4 | | 36 | Lakshadweep | 1 (35) | 0 (36) | 0 (35) | 17.3 | 6.8 | -1.3 | | ALL-INDIA | 6,656 | 8,569 | 4,972 | 12.3 | 14.1 | 7.2 | Note: Figures in brackets represent rank of the states/UTs for the corresponding year.
Source: RBI. |
| Table A2: Composition of Changes in Financial Assets of Households | | (per cent) | | Year | Currency | Bank deposits | Non-bank deposits | Life insurance fund | Provident and pension fund | Capital Market | Others | Total | | 2001-02 | 9.8 | 39.5 | -0.1 | 14.4 | 15.5 | 2.8 | 18.1 | 100.0 | | 2002-03 | 8.9 | 37.9 | 3.9 | 16.1 | 14.2 | 1.7 | 17.3 | 100.0 | | 2003-04 | 11.0 | 40.0 | 0.5 | 13.4 | 12.6 | 0.1 | 22.4 | 100.0 | | 2004-05 | 8.3 | 39.1 | 0.0 | 15.2 | 12.5 | 1.1 | 23.8 | 100.0 | | 2005-06 | 8.9 | 45.5 | 0.1 | 14.3 | 10.6 | 5.7 | 14.9 | 100.0 | | 2006-07 | 8.8 | 56.1 | 0.6 | 15.0 | 9.5 | 6.6 | 3.4 | 100.0 | | 2007-08 | 10.5 | 50.4 | 0.2 | 22.0 | 9.3 | 9.6 | -1.9 | 100.0 | | 2008-09 | 12.7 | 57.5 | 2.0 | 21.0 | 10.1 | -0.7 | -2.6 | 100.0 | | 2009-10 | 9.8 | 40.2 | 1.9 | 26.2 | 13.1 | 4.5 | 4.2 | 100.0 | | 2010-11 | 12.7 | 50.8 | 0.5 | 19.5 | 13.1 | 0.2 | 3.4 | 100.0 | | 2011-12 | 11.4 | 56.4 | 1.1 | 21.0 | 10.3 | 1.8 | -1.9 | 100.0 | | 2012-13 | 10.5 | 54.0 | 2.6 | 16.9 | 14.7 | 1.6 | -0.4 | 100.0 | | 2013-14 | 8.4 | 53.7 | 1.9 | 17.2 | 14.9 | 1.6 | 2.3 | 100.0 | | 2014-15 | 10.6 | 46.1 | 2.3 | 23.8 | 15.2 | 1.6 | 0.4 | 100.0 | | 2015-16 | 13.2 | 41.0 | 1.2 | 17.8 | 19.2 | 3.0 | 4.7 | 100.0 | | 2016-17 | -22.5 | 67.0 | 1.8 | 24.9 | 21.5 | 2.6 | 4.8 | 100.0 | | 2017-18 | 25.0 | 25.3 | 1.1 | 17.4 | 18.6 | 8.0 | 4.6 | 100.0 | | Source: Data Base on Indian Economy, RBI. |
| Table A3: Distribution of Deposits – Bank Groups and Institutional Sectors | | (Amount in ₹ billion) | | Bank Group | Government Sector | Private Corporate Sector | Financial Sector | Household Sector | Foreign Sector | Grand Total | | As at end-March 2016 | | Public Sector Banks | 11,257 | 4,003 | 4,180 | 46,228 | 3,822 | 69,490 | | | (89.2) | (37.6) | (60.4) | (76.3) | (50) | (70.6) | | Private Sector Banks | 1,197 | 4,297 | 2,270 | 10,754 | 2,731 | 21,251 | | | (9.5) | (40.3) | (32.8) | (17.8) | (35.7) | (21.6) | | Regional Rural Banks | 157 | 20 | 58 | 2,845 | 7 | 3,087 | | | (1.2) | (0.2) | (0.8) | (4.7) | (0.1) | (3.1) | | Foreign Banks | 9 | 2,335 | 414 | 743 | 1,083 | 4,585 | | | (0.1) | (21.9) | (6) | (1.2) | (14.2) | (4.7) | | Small Finance Banks | - | - | - | - | - | - | | | - | - | - | - | - | - | | All SCBs | 12,620 | 10,656 | 6,923 | 60,571 | 7,643 | 98,413 | | | (100) | (100) | (100) | (100) | (100) | (100) | | As at end-March 2017 | | Public Sector Banks | 12,848 | 4,026 | 2,684 | 51,819 | 4,230 | 75,607 | | | (82.5) | (35.7) | (44.9) | (74.9) | (56.6) | (69.1) | | Private Sector Banks | 2,503 | 4,502 | 2,594 | 13,160 | 2,730 | 25,490 | | | (16.1) | (39.9) | (43.4) | (19.0) | (36.5) | (23.3) | | Regional Rural Banks | 178 | 23 | 67 | 3,378 | 9 | 3,656 | | | (1.1) | (0.2) | (1.1) | (4.9) | (0.1) | (3.3) | | Foreign Banks | 37 | 2,725 | 617 | 755 | 507 | 4,642 | | | (0.2) | (24.2) | (10.3) | (1.1) | (6.8) | (4.2) | | Small Finance Banks | 0 | 1 | 12 | 27 | 3 | 43 | | | - | - | (0.2) | - | - | - | | All SCBs | 15,567 | 11,278 | 5,974 | 69,139 | 7,478 | 109,437 | | | (100) | (100) | (100) | (100) | (100) | (100) | | As at end-March 2018 | | Public Sector Banks | 12,859 | 3,350 | 2,205 | 54,939 | 4,501 | 77,854 | | | (81.4) | (28.3) | (32.2) | (74.1) | (53.4) | (66.5) | | Private Sector Banks | 2,698 | 5,310 | 3,908 | 14,736 | 3,369 | 30,022 | | | (17.1) | (44.9) | (57.1) | (19.9) | (40) | (25.7) | | Regional Rural Banks | 211 | 18 | 101 | 3,618 | 11 | 3,959 | | | (1.3) | (0.1) | (1.5) | (4.9) | (0.1) | (3.4) | | Foreign Banks | 11 | 3,130 | 540 | 718 | 545 | 4,943 | | | (0.1) | (26.5) | (7.9) | (1) | (6.5) | (4.2) | | Small Finance Banks | 17 | 13 | 95 | 99 | 4 | 227 | | | (0.1) | (0.1) | (1.4) | (0.1) | - | (0.2) | | All SCBs | 15,796 | 11,821 | 6,848 | 74,111 | 8,430 | 117,005 | | | (100) | (100) | (100) | (100) | (100) | (100) | Note: Figures in parentheses indicate percentage share in total.
Source: RBI. |
| Cluster Range, Incremental Deposit (in ₹ million) Per 100 Population | | Cluster No. | Range | Total Incremental deposits | Household Sector | | 1 | Min | 4.70 | 1.75 | | | Max | 4.91 | 2.44 | | 2 | Min | 3.34 | 1.03 | | | Max | 3.65 | 1.52 | | 3 | Min | 1.68 | 0.00 | | | Max | 2.33 | 0.93 | | 4 | Min | 0.06 | -0.64 | | | Max | 1.50 | -0.16 | | 5 | Min | -0.37 | -1.31 | | | Max | -0.24 | -1.31 | | Source: Staff Estimates, RBI. |
| Cluster Range of outstanding Deposit (in ₹ million) Per 100 Population | | Cluster No. | Range | Total outstanding deposits | Household Sector | | 1 | Min | 58.05 | 30.30 | | | Max | 60.27 | 33.97 | | 2 | Min | 49.83 | 23.40 | | | Max | 54.40 | 28.43 | | 3 | Min | 37.69 | 10.68 | | | Max | 43.09 | 11.34 | | 4 | Min | 18.13 | 4.56 | | | Max | 19.08 | 9.59 | | 5 | Min | 2.20 | 1.48 | | | Max | 14.83 | 4.31 | | Source: Staff Estimates, RBI. |
|