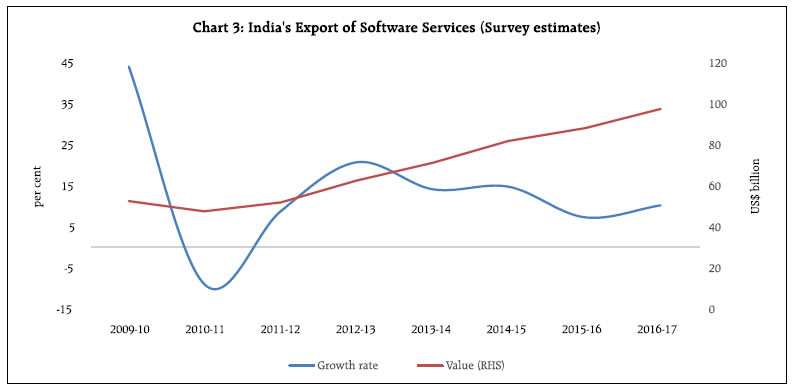
The 2016-17 round of Reserve Bank’s annual survey on computer software and information technology enabled services (ITES) exports reveals that India’s software services business exhibited resilience amidst subdued global demand conditions, supported by shifts in type of services exported and in modes of supply, especially through commercial presence of Indian companies abroad1. 1. Introduction India is a major provider of software and information technology (IT) enabled services in the global arena. The contribution of these services to India’s gross domestic product (GDP), employment and exports has also risen substantially over the years. Consequently, an ecclectic assessment of the sector’s performance warrants an evaluation of various attributes such as type of activity, on-site/offsite nature of services, export destinations and modes of supply. It is in this context that the Reserve Bank has been conducting surveys on exports of computer software and information technology enabled services (ITES) since 2002-03, as per the recommendations of the National Statistical Commission. The conduct of the survey has been enriched by guidance from the Technical Group on Computer Services Exports. The survey follows the concepts given in the IMF’s Balance of Payments and International Investment Position Manual (BPM6), 2008 and the Manual on Statistics of International Trade in Services (MSITS), 20102. For the 2016-17 round3, the eleventh in the series, 7,506 companies were approached and valid responses were received from 1,158 companies which together accounted for 81.2 per cent of total software services exports from India during the year. For the non-responding companies, estimates of software exports were generated (Annex). The remainder of this article is organised into four sections. Some stylised facts on information and communication technology (ICT) services by India vis-à-vis major countries are presented in section 2. Software and ITES export activity of Indian companies canvassed in this round of the survey are described in section 3, covering industry and organisation profile, export destinations, currency composition, modes of supply and software business of subsidiaries/ associates. Section 4 summarises the main takeaways and sets out concluding observations. 2. Global Software Services Exports: Stylised Facts Global exports of information and communication technology (ICT) services recovered rapidly from the global financial crisis by 2011. In more recent years, though, there has been moderation in growth across major suppliers (USA, UK, Germany, India and France) (Chart 1). India remains among the top four countries providing ICT services, and its share in world ICT exports has been gradually increasing (Chart 2). As per balance of payments (BoP) statistics, India’s exports of software services grew at a compound annual growth rate (CAGR) of 30.2 per cent in US dollar terms during the period 2000-01 to 2007-08. This pace of growth has tempered subsequently, with the CAGR dropping to 12.5 per cent during 2009-10 to 2012-13 and further to 2.0 per cent during 2013-14 to 2016-17. During 2016-17, software services receipts (net) accounted for 72.1 per cent of India’s net invisible surplus of US$ 97.1 billion, which helped in restricting the current account deficit to US$ 15.3 billion, despite a trade deficit of US$ 112.4 billion during the year. India’s total exports of computer services and ITES/ business process outsourcing (BPO) services from cross-border supply (mode 1), consumption abroad (mode 2) and presence of natural persons (mode 4) recorded 10.3 per cent annual growth to US$ 97.1 billion (Chart 3) (comparision of survey estimates with the NASSCOM’s estimates is described in Box 1). 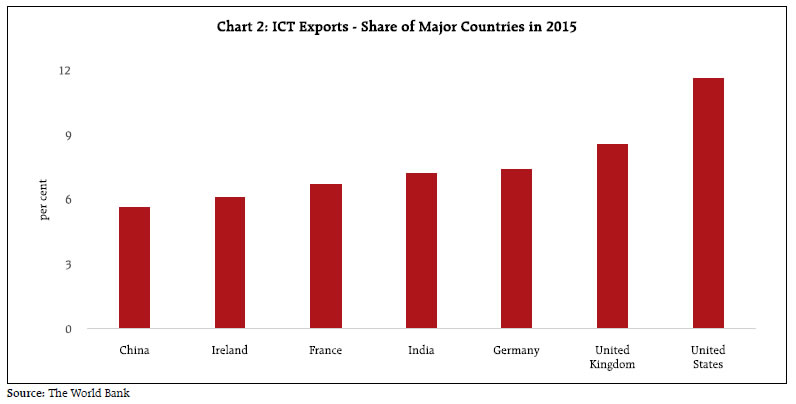
 Computer services continue to be the dominant component of India’s software services exports with a share of around 70 per cent (Table 1). Engineering services have gradually increased their contribution in overall ITES exports over the last decade. Overseas commercial presence of subsidiaries and affiliates of Indian companies (i.e., mode 3) augmented India’s overall software exports (Chart 4). | Table 1: Components of Software Services Exports from India | | (₹ billion) | | Activity | Software Services Exports | Share in Total (%) | | 2012-13 | 2013-14 | 2014-15 | 2015-16 | 2016-17 | 2008-09 | 2012-13 | 2016-17 | | (1) | (2) | (3) | (4) | (5) | (6) | (7) | (8) | | A) Computer Services | 2,447.8 | 3,181.7 | 3,610.8 | 4,104.4 | 4,506.7 | 72.9 | 71.9 | 69.2 | | Of which i) IT services | 2,256.7 | 2,936.7 | 3,399.7 | 3,862.8 | 4,300.0 | 64.0 | 66.3 | 66.0 | | ii) Software Product Development | 191.1 | 245.0 | 211.1 | 241.6 | 206.7 | 8.9 | 5.6 | 3.2 | | B) ITES/BPO Services | 957.4 | 1,141.1 | 1,403.2 | 1,658.7 | 2,003.3 | 27.1 | 28.1 | 30.8 | | Of which: i) BPO Services | 789.6 | 934.2 | 1,089.2 | 1,336.8 | 1,539.0 | 22.9 | 23.2 | 23.7 | | ii) Engineering Services | 167.8 | 206.9 | 314.0 | 321.9 | 464.3 | 4.2 | 4.9 | 7.1 | | Total Exports of Software Services (A+B) | | | | | | | | | | in billion | 3,405.2 | 4,322.8 | 5,014.0 | 5,763.1 | 6,510.0 | 100.0 | 100.0 | 100.0 | | in US$ billion * | 62.6 | 71.4 | 82.0 | 88.0 | 97.1 | | | | | Annual Growth (in US dollar terms) | 20.8 | 14.1 | 14.8 | 7.3 | 10.3 | | | | | * Using average exchange rate for the year (applicable for all tables) |
3. The 2016-17 round of the ITES Survey The survey categorises ICT services in accordance with the MSITS Manual (2010). As per the manual, there are four modes of international trade in services, viz., transactions between residents and non-residents covering cross-border supply (mode 1), consumption abroad (mode 2), services provided locally by commercial presence through affiliates established abroad (mode 3) and presence of natural persons (mode 4). Under the BoP concept, however, overseas affiliates are treated as domestic units in the host economy and hence the services delivered by them are not considered as exports of the home country. To this extent, data on services exports in the BoP differ from those in the foreign affiliates trade statistics (FATS). 3.1 Industry-wise Distribution of ITES/BPO Services Exports Exports of ITES/BPO services are categorised as per the industrial classification of the Department of Information Technology (DIT-2003), Ministry of Electronics and Information Technology, Government of India. During 2016-17, exports of BPO and engineering services increased significantly, with finance and accounting, auditing, book-keeping and tax consulting services being the major components. It is also noteworthy that the share of customer interaction services under BPO has nearly halved over the last five years (Table 2). The share of engineering services in total ITES/ BPO services’ exports has increased in the recent times, reflecting diversification efforts undertaken by companies. The contribution of product design engineering has accelerated, while other BPO services (e.g., legal services, animation, gaming, pharmaceuticals and biotechnology services as well as combination of services) accounted for more than half of the ITES/BPO services. 3.2 Organisation-wise Distribution Over the years, larger presence of foreign software companies through their subsidiaries in India has led to a steady rise in the share of private limited companies in total software exports. Private limited companies and public limited companies held roughly equal shares in exports during 2016-17 (Table 3). | Table 2: Industry-wise Share of ITES/BPO Services Exports | | (per cent) | | Activity | 2012-13 | 2013-14 | 2014-15 | 2015-16 | 2016-17 | | (1) | (2) | (3) | (4) | (5) | | BPO Services | 82.5 | 81.9 | 77.6 | 80.6 | 76.8 | | Customer interaction services | 10.9 | 8.4 | 4.6 | 3.5 | 5.0 | | Finance and Accounting, auditing, book keeping and tax consulting services | 9.7 | 11.2 | 12.2 | 11.2 | 10.3 | | HR Administration | 0.9 | 0.7 | 0.9 | 1.2 | 0.6 | | Procurements and logistics | 0.4 | 0.3 | 0.5 | 0.5 | 0.4 | | Medical transcription | 0.7 | 1.3 | 1.0 | 0.8 | 0.8 | | Document Management | 0.5 | 0.9 | 0.7 | 0.4 | 0.3 | | Content development and management and publishing | 1.4 | 0.9 | 0.9 | 0.8 | 0.8 | | Other BPO services * | 58.0 | 58.2 | 56.8 | 62.2 | 58.6 | | Engineering Services | 17.5 | 18.1 | 22.4 | 19.4 | 23.2 | | Embedded Solutions | 4.1 | 5.3 | 4.1 | 4.3 | 3.7 | | Product Design Engineering (mechanical, electronics excluding software) | 5.9 | 5.5 | 5.9 | 5.1 | 7.7 | | Industrial automation and enterprise asset management | 2.4 | 0.2 | 0.2 | 0.1 | 0.1 | | Other Engineering services * | 5.1 | 7.1 | 12.2 | 9.9 | 11.7 | | Total ITES/BPO Services | 100.0 | 100.0 | 100.0 | 100.0 | 100.0 | | * ‘Other services’ include a combination of the services indicated above, which are provided by companies where activity wise revenue segregation is not available. This is applicable for all tables. |
| Table 3: Organisation-wise Share of Software Services Exports | | (per cent) | | Organisation | 2012-13 | 2013-14 | 2014-15 | 2015-16 | 2016-17 | | (1) | (2) | (3) | (4) | (5) | | Private limited companies | 35.3 | 36.0 | 43.1 | 44.3 | 49.2 | | Public limited companies | 64.6 | 63.6 | 55.6 | 54.4 | 50.3 | | Others | 0.1 | 0.4 | 1.3 | 1.3 | 0.5 | | Total | 100.0 | 100.0 | 100.0 | 100.0 | 100.0 | 3.3. Export Destinations and Currency Composition The USA and Canada together remained the top destinations of India’s export of software services with a share of 60.3 per cent, which has largely remained unchanged during the last decade (61.5 per cent share in 2008-09) (Chart 5). They were followed by Europe with a share of 23.1 per cent (27.0 per cent in 2008-09). There has been a clear shift towards the Asian region, which has more than doubled its share during 2008-09 to 2016-17.
| Table 4: Share of On-site and Off-site Exports | | (per cent) | | Type of Services | 2008-09 | 2012-13 | 2013-14 | 2014-15 | 2015-16 | 2016-17 | | (1) | (2) | (3) | (4) | (5) | (6) | | On-site (Mode-4) | 32.2 | 15.8 | 19.8 | 20.0 | 19.9 | 17.2 | | Off-site (Mode-1 & Mode-2) | 67.8 | 84.2 | 80.2 | 80.0 | 80.1 | 82.8 | | Total | 100.0 | 100.0 | 100.0 | 100.0 | 100.0 | 100.0 | The US dollar has remained the principal invoice currency during the last decade, accounting for nearly three-fourths of software exports, followed by the pound sterling and euro. The share of rupee invoicing increased significantly to 3.6 per cent during 2016-17 from 1.6 per cent in the previous year. 3.4 Modes of Software Service Exports The off-site mode remained the preferred mode of delivery of software services and its share increased in 2016-17 after remaining broadly unaltered in the preceding three years (Table 4). | Table 5: Software Exports by Modes of Supply | | (per cent) | | Mode of Supply | 2012-13 | 2013-14 | 2014-15 | 2015-16 | 2016-17 | | (1) | (2) | (3) | (4) | (5) | | Mode 1 (cross-border supply) | 74.7 | 69.1 | 68.4 | 64.8 | 66.5 | | Mode 2 (consumption abroad) | 1.6 | 0.1 | 0.1 | 0.2 | 0.2 | | Mode 3 (commercial presence) | 9.4 | 13.7 | 14.4 | 18.9 | 19.4 | | Mode 4 (presence of natural person) | 14.3 | 17.1 | 17.1 | 16.1 | 13.9 | Total software exports under all the four delivery modes stood at ₹ 8,077.8 billion (US$ 120.4 billion) during the year. The share of mode 1 and mode 3 increased during the year and together they accounted for around 86 per cent of total software exports (Table 5). Box 1: Comparison of Survey Results with the NASSCOM’s Data The Reserve Bank publishes information on software exports as part of BoP Statistics using data reported by authorised dealer banks (ADs), Software Technology Parks of India (STPI) and the National Association of Software and Services Companies (NASSCOM) on non-physical software exports. As per the BoP data, non-physical software exports stood at ₹ 4,940.1 billion in 2016-17. The NASSCOM publishes estimates of exports of the IT-BPO industry, which is based on the global software business of Indian software companies, i.e., it includes the software business of their overseas subsidiaries. In order to make the data generated through the RBI’s annual survey on software and ITES/BPO services exports comparable with the NASSCOM’s data, the software business of overseas subsidiaries of Indian companies has been added to the estimates emanating from the survey. Based on the survey, exports of software services from India was placed at ₹ 6,510 billion (US$ 97.1 billion) in 2016-17 and the software business of overseas subsidiaries of Indian companies was estimated at ₹ 1,567.8 billion (US$ 23.4 billion). Thus, the survey estimates of global software exports of India are placed at ₹ 8,077.8 billion (US$ 120.4 billion) as against ₹ 7,847.4 billion (US$ 117.0 billion) published by the NASSCOM. As per the survey, overseas subsidiaries of Indian companies accounted for 19.4 per cent of the global software business (Table A). | Table A: Reconciliation of Software Exports of India during 2016-17 | Software exports as per NASSCOM
(Global business) | Software Exports based on annual survey | Indian companies
(Mode 1, Mode 2 & Mode 4) | Subsidiaries abroad
(Mode 3: services provided locally) | Global business | | (1) | (2) | (3) | (4)=(2)+(3) | | 7,847.4 | 6,510.0 | 1,567.8 | 8,077.8 | |
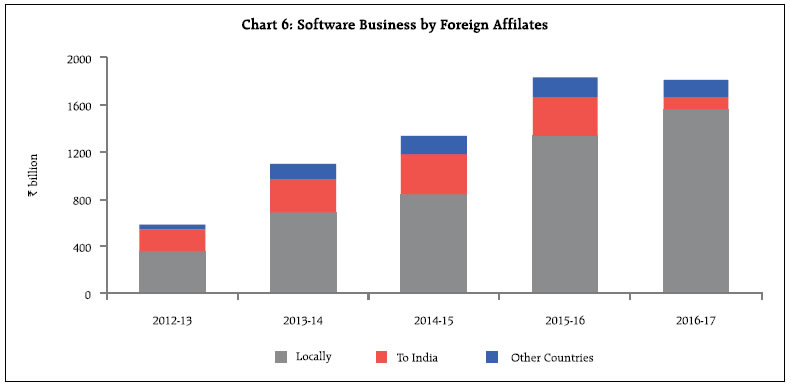 3.5 Software Business of Subsidiaries/ Associates Software business of foreign subsidiaries/ associates of Indian companies (foreign affiliates) are components of foreign affiliate trade statistics (FATS). Total software business (excluding the services provided to India) of the foreign affiliates of Indian companies increased by 13.2 per cent to US$ 25.6 billion (₹ 1,712.9 billion) in 2016-17 as overseas subsidiaries focused on local business in the host countries: their business with India, however, declined during the year (Chart 6). Most of the foreign affiliates of Indian companies provided multiple services (i.e., a combination of IT services, software product development, BPO services and engineering services). In the instances where activity-wise revenue segregation is not available, the services provided by companies are classified under ‘other services’ (Table 6). | Table 6: Software Business by Foreign Affiliates of Indian Companies | | (₹ billion) | | Activity | 2008-09 | 2012-13 | 2016-17 | | Locally | To India | Other Countries | Locally | To India | Other Countries | Locally | To India | Other Countries | | (1) | (2) | (3) | (4) | (5) | (6) | (7) | (8) | (9) | | IT services | 12.2 | 0.8 | 0.1 | 23.9 | 1.8 | 0.4 | 51.0 | 5.2 | 6.0 | | Software Product Development | 1.7 | 0.3 | 0.1 | 5.0 | 2.3 | 11.2 | 0.8 | 0.6 | 14.9 | | BPO Services | 3.8 | 0.4 | 28.5 | 15.9 | 0.4 | 3.6 | 70.1 | 2.3 | 12.0 | | Engineering Services | 0.0 | 0.2 | 0.3 | 1.6 | 0.5 | 0.0 | 5.6 | 0.3 | 0.1 | | Other services | 319.3 | 9.8 | 37.3 | 307.4 | 184.6 | 28.9 | 1,440.3 | 93.0 | 112.1 | | Total (₹ billion) | 337.0 | 11.5 | 66.4 | 353.8 | 189.6 | 44.1 | 1,567.8 | 101.4 | 145.1 | | Total (USD billion) | 7.3 | 0.3 | 1.4 | 6.5 | 3.5 | 0.8 | 23.4 | 1.5 | 2.2 | Nearly two-third of total software business by foreign affiliates was concentrated in the USA. The UK is the other major partner but its share declined during the year. Canada and Germany were other significant trade partners and their shares increased marginally during the year (Table 7). | Table 7: Software Business by Foreign Affiliates of Indian Companies- Country-wise Distribution | | (per cent) | | Country | 2012-13 | 2013-14 | 2014-15 | 2015-16 | 2016-17 | | (1) | (2) | (3) | (4) | (5) | | USA | 71.3 | 65.4 | 66.7 | 64.6 | 65.0 | | United Kingdom | 6.6 | 7.9 | 8.0 | 9.2 | 6.7 | | Canada | 4.1 | 4.1 | 3.3 | 2.4 | 3.6 | | Germany | 3.0 | 3.5 | 2.4 | 2.9 | 3.3 | | Singapore | 2.7 | 3.3 | 3.3 | 3.3 | 2.9 | | Netherlands | 2.1 | 3.2 | 2.3 | 2.5 | 2.7 | | Other Countries | 10.2 | 12.6 | 14.0 | 15.1 | 15.8 | | Total | 100.0 | 100.0 | 100.0 | 100.0 | 100.0 | 4. Conclusion India’s exports of software services (including ITES), which grew at a remarkable pace during 2001-08, were dented in the aftermath of the global financial crisis but recovered subsequently. The subdued pace of global economic activity has, however, adversely affected external demand conditions during the last three years. Of the total business of software services provided by India across the globe, services provided through foreign affiliates of Indian companies have steadily increased and reached around one-fifth of the total. Recently, overseas subsidiaries of Indian companies have focused on local business in the host countries. Cross-border supply continues to be the dominant mode of software exports and the share of on-site delivery has gradually declined over the last decade. India’s exports of ITES/BPO services grew faster than computer software services though the share of customer interaction services has halved during the last five years. The US dollar remains the principal invoicing currency but the share of Rupee invoicing is rising albeit from modest levels. In recent years, software export destinations have diversified, with increased exports to the Asian region. The lion’s share of business for Indian software companies continue to come from the USA and the UK. References Central Statistical Organisation, Government of India (2001): Report of the National Statistical Commission (Chairman: Dr.C.Rangarajan). International Monetary Fund (2008): Balance of Payments and International Investment Position Manual (BPM6). National Association of Software and Services Companies (NASSCOM): The IT-BPM Industry In India 2017: A Strategic Review. Reserve Bank of India: Annual Survey on Computer Software and Information Technology Enabled Services Exports, Reserve Bank of India Bulletin (various issues). The World Bank: World Development Indicators https://data.worldbank.org/indicator/BX.GSR.CCIS.ZS. United Nations Statistics Division, Eurostat, International Monetary Fund, Organisation for Economic Cooperation and Development, United Nations Conference on Trade and Development, World Tourism Organisation and World Trade Organisation (2010): Manual on Statistics of International Trade in Services.
Annex: Methodology for Estimation of Software Services Exports of Non-responding Companies Annual survey on software and ITES exports for 2016-17 was launched among nearly 7,506 Software and ITES/BPO companies. Of these, 1,362 companies responded to the survey which included 204 nil-reporting companies. The non-respondent companies were generally the smaller companies, as the 1,158 active companies that supplied data included all major companies in the sector. Using the observed proportion, number of companies with NIL exports was estimated from 6,144 nonrespondent companies and software exports have been estimated for the remaining 5,224 nonresponding companies, using the following method: I. Based on the ITES/BPO reported activity, companies have been classified in four groups: (i) IT services, (ii) ITES/BPO services, (iii) engineering services and (iv) software product development services (having 100 per cent business under respective group). II. For classifying the other companies having combination of these as their business activity, reported proportions of their exports done in the above-mentioned four group of services have been used. III. It was observed that major companies primarily reported on-site software exports. Therefore, only off-shore software exports component was used for estimating software exports of nonresponding companies. IV. As the observed distribution of exports was highly positively skewed in each of these groups, median was used for estimating software exports in each group. Estimated software exports for ith group of nonresponding companies Total software exports of India has been compiled as the sum of reported software exports and the estimated software exports for non-responding companies in each of the four groups. Using the methodology given above, the software services exports of non-respondent companies was estimated to the tune of ₹ 1,223.9 billion (around 18.8 per cent of total software services exports).
|