Rapid urbanisation and migration to cities have caused severe urban housing shortages in India, particularly for the economically weaker sections. In this context, the Government and the Reserve Bank of India have undertaken a number of initiatives to boost affordable housing. Even as loan disbursements as well as launches of new projects in the affordable housing segment have risen sharply in 2016-17, there was an increase in non-performing housing loans, particularly for the lower slabs of home loans. While the credit linked subsidy scheme was found to be effective in improving the housing affordability of the economically weaker sections, unlocking of land in the urban areas poses a major challenge for further development of the sector. Section 1: Introduction In India, rapid urbanisation has given rise to development challenges in the form of urban congestion, pressure on basic amenities like water and sanitation and most importantly, severe housing shortages in cities, especially, in the low cost segment. Real estate developers and private players tend to focus on middle income and high income segments due to higher returns. In addition, issues relating to high land costs, delay in project approvals, increasing raw material costs and low profit margins have made low cost housing projects less attractive for private realty investors and developers. In order to bridge this demand – supply gap, the Government of India has recently taken major initiatives to provide a boost to affordable housing in India, complemented by a number of measures by the Reserve Bank of India (RBI). In view of the increased attention received by affordable housing in the recent period, an attempt has been made in this article to study various dimensions of affordable housing. The rest of the article is structured into six sections. Section 2 discusses various measures of housing affordability and the international experience in the policy design for affordable housing. Section 3 highlights the need for affordable housing in India and the steps taken by the Government and the Reserve Bank of India to provide a boost to this sector. Section 4 presents some stylised facts based on housing credit data. An empirical assessment of the impact of Credit Linked Subsidy Scheme on housing affordability is provided in Section 5. Section 6 flags some of the major challenges faced by the affordable housing sector in India. Section 2: The International Experience There are various methodologies adopted internationally to estimate housing affordability: -
Expenditure Method or Housing Cost Burden: The ratio of housing expenditure to household income is used to measure affordability. Housing expenditure covers all the costs related to housing including rentals, mortgage repayments, utilities and maintenance costs. Housing units can be classified as affordable if the ratio is less than some cut-off value. The choice of this cut-off is judgemental; however, as a thumb rule, it is taken to be 30 per cent. -
Median Multiple Indicator: Under this approach, the median house price is divided by median household annual income to derive housing affordability. Demographia International, an organisation which conducts survey across countries for affordable housing, considers price to income ratio below 3 to classify housing units as affordable. -
Housing and Transport (H+T): In this method, transport costs are also included with housing costs to measure affordability. The underlying idea is that congestion in cities has led to rise in human settlements at long distances from the city centre, which has resulted in increase in costs and time spent in commuting (Hamidi et al., 2016). During the period 2000-2016, housing prices across the world showed an increasing trend, temporarily interrupted by the global financial crisis of 2008-09, with India’s nominal house price index increasing at the fastest rate (Chart 1). This incidence has prompted different countries to undertake targeted policy actions for providing affordable housing to economically weaker sections. In this regard, the lessons drawn from the country experiences provide useful insights. The policies adopted towards housing affordability by select countries, viz., the United States, Australia and China (for which detailed information is available) are discussed below. The United States of America In the United States (US), the Department of Housing and Urban Development (HUD) defines affordable housing by the expenditure approach, under which housing is deemed affordable if it costs less than 30 per cent of the household income. It estimates that there are 12 million renter and homeowner households which pay more than 50 per cent of their annual income for housing, and face difficulties in obtaining necessities such as food, clothing, transportation and medical care. Affordable housing programmes in the US are sponsored by both the federal and the state governments: 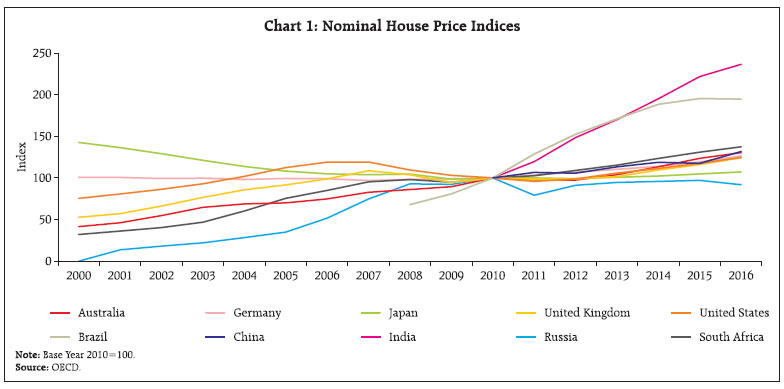 -
Under the Housing Choice Voucher (HCV) programme, the HUD disburses funds to public housing agencies (PHAs) for providing rental subsidies to the eligible families. The maximum assistance received by a family is equal to standard rent1 minus 30 per cent of monthly adjusted income. It involves agreements among the participants, viz., tenants, landlords and PHAs. However, the number of housing cost burdened HCV households has increased by 52 per cent from 517,655 in 2003 to 786,958 in 2015 driven primarily by variation in income and housing market cycles (HUD, 2017). -
The Low Income Housing Tax Credit (LIHTC) programme was established in 1986 to provide project based affordable rental housing. It provides tax credits to developers of affordable housing projects under conditions of restricted rents2 and occupancy3 benefiting low income households. During 1995 to 2015, 30,693 projects and 2.3 million housing units were placed in service under this project. The LIHTC projects were found to have a positive impact in low income areas, leading to improved welfare for homeowners and renters (Diamond et al., 2015). Australia In Australia, the proportion of households facing housing stress4 increased from 15.4 per cent in 2007-08 to 17.7 per cent in 2013-14. To address the problem of housing stress, affordable housing schemes are sponsored by both the federal and the state governments in the form of rental and home ownership assistance. Under the Commonwealth Rent Assistance (CRA) and National Rental Affordability Scheme (NRAS) of the federal government, the aim is to reduce rental costs for eligible households by at least 20 per cent of market rates. NRAS is a supply side intervention, which gives housing providers and developers annual financial incentives for up to 10 years, enabling them to provide affordable rental housing to public. On the other hand, CRA is a demand side intervention which provides rental assistance in the form of non-taxable income transfers to eligible households. The federal and state governments spent approximately US$10 billion on affordable housing in 2015-16.5 The impact of NRAS was found to be significant as its implementation resulted in reduction of number of households facing housing stress (AHURI, 2009) Among the states, in Western Australia, the Housing Authority has launched different programs to address the problem of lack of affordable housing, viz., rental subsidies; home loans at lower rates; public housing, shared ownership of houses with the Housing Authority.6 Unlike CRA and NRAS which aim to provide only rental affordability, the Housing Authority provides for both rental and home ownership. China Prior to 1978, urban housing units in China were constructed and freely distributed through public employers. Since then a slew of reforms have been undertaken to make the housing sector more market oriented (Xue, 2013). At present, the Chinese government provides affordable housing through subsidised loans for housing purchases and by offering affordable public rentals under three major programs: -
Under the Economic and Comfortable Housing (ECH) program, the local government supplies land to developers at subsidised rates so that the latter can sell the housing units to eligible low and middle income families at discounted prices. The construction and profit margins for such housing are regulated by the government. In 2010, the share of housing under ECH in total housing stock was 3.4 per cent. -
Under the Housing Provident Fund Scheme, both the employees and the employers contribute a portion of the employees’ salaries to a state owned bank. In return, the employee can get a low cost housing loan from the fund for home ownership. -
Under the Cheap Rental Housing scheme, the government provides rental assistance to the low income families. The country experience suggests that the Government’s response to promote affordable housing is largely similar across countries in terms of stimulating the market participants. The Government policies can be broadly classified under two categories: the supply and the demand side interventions. While the supply side measures target developers and investors to undertake affordable housing projects, the demand side measures provide incentives to households in the form of rental and mortgage based subsidies. Section 3: The Indian Experience Need for Affordable Urban Housing in India As per the Report of the Technical Group (TG-12) on Estimation of Urban Housing Shortage (2012), there has been a huge gap in demand and supply of urban housing in India. The economically weaker sections (EWS) and low income group (LIG) accounted for 96 per cent of the total housing shortage in India (Table 1). | Table 1: Distribution of estimated urban housing shortage in India | | (million) | | Factors | As at end-2012 | | Households living in non-serviceable katcha houses | 0.99 | | Households living in obsolescent houses | 2.27 | | Households living in congested houses | 14.99 | | Households in homeless condition | 0.53 | | Total Urban Housing shortage | 18.78 | | I. Economically Weaker Sections (EWS) | 10.55 (56%) | | II. Low Income Group (LIG) | 7.41 (40%) | | III. Medium and High income group (MIG+HIG) | 0.82 (4%) | Note: Values in parentheses are percentage shares.
Source: Report of Technical Group (TG-12) on Estimation of Urban Housing Shortage 2012, Ministry of Housing & Urban Poverty Alleviation. | According to the McKinsey Report (2010), India will have 40 per cent of its population living in urban areas with 68 cities with one million plus population (from 42 currently) by 2030 (Chart 2). It estimates that the demand for affordable housing will increase to 38 million housing units in 2030 from 19 million in 2012. Initiatives to Promote Affordable Housing While efforts to provide low cost housing have been made for many years (National Housing Policy, 1994; Jawaharlal Nehru National Urban Renewal Mission, 2005; Rajiv Awas Yojana 2013), the Pradhan Mantri Awas Yojana (PMAY) launched in 2015 provides a fresh impetus – the PMAY-Urban (PMAY-U) subsumes all the previous urban housing schemes and aims at ‘Housing for All’ to be achieved by the year 2022. The total housing shortage envisaged to be addressed through the PMAY-U is 20 million. The mission has four components: (i) In-situ slum redevelopment (ISSR): using land as resource, the scheme aims to provide houses to eligible slum dwellers by redeveloping the existing slums on public/ private land. Under this scheme, a grant of ₹ 1 lakh per house is provided by the central government to the planning and implementing authorities of the states/UTs. (ii) Credit-linked subsidy scheme (CLSS): under this scheme, easy institutional credit is provided to EWS, LIG and MIG households for purchase of homes with interest subsidy credited upfront to the borrower’s account through primary lending institutions (PLIs), effectively reducing housing loan and equated monthly instalments (EMI) (Table 2). | Table 2: Credit Linked Subsidy Scheme | | Type | Income
(per annum) | Interest Subsidy
(%) | Up to Loan Amount
(₹ lakh) | Up to Carpet Area
(sq.m.) | | Economically Weaker Section (EWS) | Up to ₹ 3 lakh | 6.5 | 6 | 30 | | Low Income Group (LIG) | ₹ 3-6 lakhs | 6.5 | 6 | 60 | | Middle Income Group (MIG-I) | ₹ 6-12 lakhs | 4 | 9 | 120 | | Middle Income Group (MIG-II) | ₹ 12-18 lakhs | 3 | 12 | 150 | Note: Carpet area of houses eligible for subsidy under CLSS for MIG-I and MIG-II has been increased from 90 and 110 sq.m to 120 and 150 sq.m, respectively, effective from January 1, 2017.
Source: Ministry of Housing and Urban Poverty Alleviation (MoHUPA). | (iii) Affordable housing in partnership (AHP): it aims to provide financial assistance to private developers to boost private participation in affordable housing projects; central assistance is provided at the rate of ₹ 1.5 lakh per EWS house in private projects where at least 35 per cent of the houses are constructed for the EWS category. (iv) Beneficiary-led construction or enhancement (BLC): this scheme involves central assistance of ₹ 1.5 lakh per family for new construction or extension of existing houses for the EWS/ LIG. The central government’s aggressive push to affordable housing is evidenced from the three-fold increase in the stock of houses completed under PMAY-U since April 2017 (Table 3). | Table 3: Progress of PMAY-U | | As on | Project Proposal considered | Financial Progress
(₹ Crore) | Physical Progress
(Nos.) | | Investments in projects | Central Assistance involved | Central Assistance released | Houses involved | Houses grounded for construction | Houses completed | | January 3, 2017 | 2,691 | 72,030.87 | 19,632.58 | 4,463.70 | 13,28,295* | 2,13,187 | | | April 3, 2017 | 3,735 | 95,660.05 | 27,879.15 | 7,820.10 | 17,73,052 | 5,35,769 | 92,308 | | July 31, 2017 | 5,147 | 1,27,480.16 | 37,270.84 | 11,451.89 | 23,92,061 | 9,93,278 | 1,57,106 | | October 3, 2017 | 5,974 | 1,54,180.15 | 44,278.49 | 12,065.85 | 28,57,321 | 11,50,783 | 2,00,096 | | December 4, 2017 | 6,671 | 1,72,293.56 | 49,537.19 | 12,764.47 | 31,99,267 | 14,08,537 | 2,88,963 | Note: *includes only EWS.
Source: Ministry of Housing and Urban Affairs. | The Union Budget 2017-18 announced a number of measures to boost affordable housing, which include: (i) granting infrastructure status to affordable housing; (ii) increasing the time for project completion to affordable housing promoters from earlier three years to five years; (iii) providing a year’s time to developers to pay tax on notional rental income on completed but unsold units; (iv) reducing the tenure for long-term capital gains for affordable housing from three to two years; (v) revision of the qualifying criteria for affordable housing from saleable area to the carpet area; (vi) announcement of a new CLSS for the MIG with a provision of ₹ 1,000 crore; and (vii) refinancing facility by National Housing Bank (NHB) for individual loans for the affordable housing segment. Apart from the Centre, some State Governments, viz., Madhya Pradesh, Chhattisgarh and Gujarat are also encouraging affordable housing by providing rebates on stamp duty rates levied on housing for the EWS, low and middle income groups. These measures are likely to spur growth in the affordable housing segment in India by encouraging developers through several incentives, subsidies, tax benefits and most importantly, institutional funding. The accordance of infrastructure status to affordable housing will help developers to mobilise funds from different channels, viz., external commercial borrowings (ECB), foreign venture capital investors (FVCI) and foreign portfolio investors (FPIs). The RBI has taken various policy measures to promote affordable housing. First, in July 2014, the RBI defined affordable housing loans as eligible under priority sector lending, as also housing loans to individuals up to ₹ 50 lakhs for houses of values up to ₹ 65 lakhs located in the six metropolitan centres (Mumbai, New Delhi, Chennai, Kolkata, Bengaluru and Hyderabad) and ₹ 40 lakhs for houses of values up to ₹ 50 lakhs in other centres for purchase/construction of dwelling unit per family. Second, it allowed banks to issue long term bonds (of minimum 7 years maturity) to finance loans to affordable housing and exempt such bonds from the computation of adjusted net bank credit (ANBC). Third, the RBI allowed the banks to provide home loans up to 90 per cent for properties that cost up to ₹ 30 lakh in October 2015.7 Fourth, the RBI also modified the provisioning or risk-weight norms for home loans to make them cheaper – it cut the standard asset provisioning on housing loans to 0.25 per cent from 0.4 per cent in June 7, 2017. In its Monetary Policy Statement of October 2017, the RBI has indicated that faster rollout of affordable housing programme with time bound single window clearances and rationalisation of high stamp duties by the state governments can support growth. Section 4: Some Stylised Evidence Growth in Housing Loans Responding to policy efforts, affordable housing is currently driving home loan growth in India. While the total disbursement of housing loans by public sector banks (PSBs) as well as the housing finance companies (HFCs) witnessed a deceleration in 2016-17, there was significant growth for the lower slabs. Housing loans up to ₹ 10 lakh recorded robust growth in 2016-17, primarily driven by the PSBs (Chart 3). While the number of beneficiaries for loan amounts up to ₹ 10 lakhs has increased sharply in 2016-17, the number of beneficiaries for higher value loans of above ₹ 25 lakhs has, in fact, declined marginally during the year (Chart 4). NPA Ratio for Housing Loans With the sharp rise in loan disbursements and number of beneficiaries in the affordable housing segment, non-performing asset (NPA) ratios of PSBs and HFCs have increased moderately in 2016-17. Among all slabs, housing loans up to ₹ 2 lakhs had the highest level of NPAs and the PSBs reported higher NPAs than the HFCs in the last two fiscal years (Table 4). | Table 4: NPAs Across Slabs of Housing Loans | | (per cent) | | NPAs | PSBs | HFCs | Total | | 2015-16 | 2016-17 | 2015-16 | 2016-17 | 2015-16 | 2016-17 | | Up to ₹ 2 lakhs | 12.0 | 11.9 | 6.1 | 8.6 | 9.8 | 10.4 | | Up to ₹ 5 lakhs | 4.9 | 5.0 | 2.4 | 3.4 | 4.0 | 4.4 | | Up to ₹ 10 lakhs | 2.7 | 2.7 | 1.5 | 1.2 | 2.3 | 2.1 | | Up to ₹ 25 lakhs | 1.7 | 1.7 | 0.8 | 0.7 | 1.4 | 1.3 | | >₹ 25 lakhs | 0.9 | 1.2 | 0.3 | 0.5 | 0.6 | 0.9 | | Total | 1.4 | 1.5 | 0.4 | 0.6 | 0.9 | 1.1 | | Source: National Housing Bank. | Refinance Scheme for Affordable Housing The National Housing Bank (NHB)’s refinance scheme makes available funds to lending institutions for their lending to public and private agencies/ developers/builders for projects in the affordable housing segment at concessional rates of interest. Small value loans (loans less than ₹ 25 lakh) accounted for 54.6 per cent of the total refinance in 2016-17 (Table 5). | Table 5 : Refinance Disbursements – Loan Size-wise | | Individual Loan Size | 2016-17 | Amount
(₹ Crore) | Share in Total
(%) | | Up to ₹ 2 lakhs | 1220.1 | 5.4 | | ₹ 2 lakhs to ₹ 5 lakhs | 1234.5 | 5.4 | | ₹ 5 lakhs to ₹ 10 lakhs | 2143.4 | 9.5 | | ₹ 10 lakhs to ₹ 15 lakhs | 3360.8 | 14.8 | | ₹ 15 lakhs to ₹ 20 lakhs | 2389.8 | 10.5 | | ₹ 20 lakhs to ₹ 25 lakhs | 2055.7 | 9.1 | | Over ₹ 25 lakhs | 9881.7 | 43.6 | | Prospective and Data Awaited | 398.2 | 1.8 | | Total | 22684.1 | 100 | | Source: National Housing Bank. | Trend in Housing Affordability in India As per the Housing Development Finance Corporation (HDFC) Report (2016), the affordability ratio, defined as property prices to annual income, has declined from 22 in 1995-96 to 4 in 2016. After the sharp fall in the 1990s it has largely been stable in recent years (Chart 5). All India House Price Index, which is compiled by RBI (captures changes in the housing prices across major cities) recorded a moderation in growth in the recent years (Chart 6). As per the Cushman & Wakefield research report (2017), the number of new launches in the residential sector in the top eight cities (Ahmedabad, Bengaluru, Chennai, Delhi-NCR, Hyderabad, Kolkata, Mumbai and Pune) declined by about 8 per cent during 2016-17. The launches of affordable house units, however, increased by 10 per cent (Table 6). Accordingly, the share of affordable segment in total launches improved to 30 per cent in 2016-17 from 25 per cent in 2015-16. | Table 6: Segment-wise New Unit Launches in the Residential Sector | | (Number of units) | | Segment | 2015-16 | 2016-17 | Growth (%) | | Affordable | 29325 | 32300 | 10.1 | | Mid-ranged | 72800 | 64250 | -11.7 | | High-end | 14600 | 10700 | -26.7 | | Luxury | 925 | 950 | 2.7 | | Total | 117650 | 108200 | -8.0 | | Source: Cushman & Wakefield, 2017. | Section 5: Impact of CLSS on Housing Affordability: An Empirical Exercise In this section, an attempt has been made to study the impact of CLSS on housing affordability in India. Since CLSS provides interest subsidy, which in turn brings down the housing cost, it is expected that with the implementation of CLSS more housing units would be classified as affordable. While housing affordability may be defined in terms of cost price of house to annual income or monthly cost of housing (such as EMI) to monthly income, the latter approach has been used for the analysis. For this exercise, the affordability of housing units across four segments – EWS, LIG, MIG-I and MIG-II – is computed for 49 cities under two scenarios: (i) affordability without the benefit of CLSS; and (ii) affordability with the benefit of CLSS. For this purpose a metric for affordability of housing units is constructed which is termed as Affordability Measure (AM). As discussed in Section 2, as per the expenditure approach, AM is defined as the ratio of housing cost to monthly income of the household and a house is considered to be affordable if AM < 30 per cent. Lower AM implies higher affordability. While housing cost can comprise of mortgage repayments, property taxes, etc., here it is assumed that it includes only monthly mortgage repayments or equated monthly instalments (EMI). Therefore AM is the ratio of EMI to monthly income of the household (Annex I). These estimates indicate that in most of the cities, affordable houses which have AM < 30 per cent are concentrated in income groups higher than EWS, particularly in the MIG segments, which is consistent with the premise that higher income leads to greater affordability (Chart 7). The CLSS, however, is found to be effective in making houses affordable for the EWS segment (Table 7). With CLSS, housing in 21 cities became affordable for the EWS in comparison to only 5 cities without CLSS. The impact of CLSS in making houses affordable for the LIG and MIG segments, however, is less significant. Given the effectiveness of CLSS in improving housing affordability for the EWS, it should receive priority attention in policy design. | Table 7: Number of Cities with Affordable Housing | | | AM
Without CLSS
<30 per cent | AM
With CLSS
<30 per cent | Change with CLSS | | EWS | 5 | 21 | 16 | | LIG | 5 | 9 | 4 | | MIG-I | 9 | 11 | 2 | | MIG-II | 18 | 20 | 2 | Note: Affordability is analysed for 49 cities based on carpet area prices given by NHB-Residex database.
Source: Authors’ calculations. | Section 6: Issues and Challenges Affordable housing can accelerate economic growth through its linkage with the other sectors of the economy. The output multipliers of residential construction (proxy for housing sector) are higher than sectors like agriculture, electricity, trade, railways, communication, and banking and insurance (NCAER, 2014). The direct employment linkage coefficient of residential construction is the highest among all sectors even though the nature of employment is largely informal. The Government’s recent thrust on affordable housing through policy measures, viz., government incentive schemes, accordance of infrastructure tag, interest subsidy scheme under PMAY have resulted in sharp rise in new housing projects in the affordable segment for low income groups. From the consumers’ perspective, while availability of low cost credit is driving the demand for affordable housing, policies like Real Estate Regulatory Authority (RERA) Act may infuse fresh buyer interest in the reality sector. While the joint efforts of the Government and the RBI to boost affordable housing have generated positive outcome, there are various factors affecting the pace of affordable housing development in India and restricting private sector participation: (i) lack of suitable low cost land within the city limits; (ii) lengthy statutory clearance and approval process; (iii) shortcomings in development norms, planning and project design; (iv) lack of participation of large organised real estate players due to low profit margins; (v) high cost of funds for construction finance making the projects unviable; (vi) lack of suitable mechanism for maintenance; (vii) challenges in beneficiary selection; and (viii) capacity constraint or inadequate capacity of the implementing agencies (Deloitte, 2016). Unless the above challenges are addressed, creating two crore homes may be a distant dream.
Annex I Methodology for Construction of AM For estimation of AM, in the first step we have obtained data on Carpet Area Prices (CAP) from the NHB-RESIDEX database. NHB provides Housing Price Indices (HPI) for various cities of India under two heads HPI@Assessment Prices and HPI@ Market Prices. Assessment Prices are valuation data obtained from banks and HFCs, and Market Prices are obtained for under construction projects through market surveys. We have taken CAP given under HPI@Assessment Prices since it is going to affect the valuation and lending done by banks/HFCs and the interest subsidy received under CLSS. CAP is provided on per sq.ft. basis for 3 different segments of housing unit whose area fall in the range: <646 sq.ft. (60 sq.m.), 646-1184 sq.ft. (60-110 sq.m.) and > 1184 sq.ft. (110 sq.m.). This segmentation was in line with eligibility criteria mentioned in PMAY for various types of beneficiaries. In the second step, we have computed the cost of the housing unit by multiplying CAP with carpet area of the house. Here, it is assumed the carpet area of the house is the maximum carpet area that could be availed by the beneficiary under PMAY as given in Table 2. After computing housing cost, in the third step we have calculated the maximum permissible housing loan that a household under each category can get. It is computed by multiplying the housing cost with the appropriate loan-to-value (LTV) ratio. The effective loan amount will be different for the two categories of borrowers: with CLSS and without CLSS. The effective loan amount for CLSS borrowers will be lower by the amount of interest subsidy available under this scheme as the amount is paid upfront to the lender by the Government. In the fourth step, the EMI to be paid by the household is computed assuming the term of the loan to be 20 years, as allowed under PMAY, and a uniform interest rate of 8.35 per cent, which is presently offered by many banks. In the fifth step, monthly income of the household is computed based on eligibility income as given under PMAY. For example, households with income up to ₹ 3 lakh are considered under EWS category. Therefore, monthly income of EWS, for calculation of AM, is assumed to be ₹ 25,000, i.e. ₹ 3 lakh/12. Finally, AM is calculated by taking the ratio of EMI, calculated in step 4, to monthly income, as determined in step 5. If AM < 30 per cent then the housing unit is considered as affordable. Here, AM is computed for two scenarios – with CLSS and without CLSS. Conceptually AM with CLSS should be lower than AM without CLSS. Higher difference implies greater impact on affordability by CLSS.
References Australian Housing and Urban Research Institute (AHURI) (2009), “What Impact will the National Rental Affordability Scheme have upon Housing Affordability?”, AHURI Research & Policy Bulletin, Issue 108, January. Cushman & Wakefield (2017), Sector Overview Residential: Q1 2017. Deloitte (2016), Mainstreaming Affordable Housing in India Moving towards Housing for All by 2022, August. Diamond, R. and McQuade, T. (2015), “Who Wants Affordable Housing in Their Backyard? An Equilibrium Analysis of Low Income Property Development” Stanford Graduate School of Business. Hamidi, S., Ewing, R. and Renne, J. (2016), “How Affordable is HUD Affordable Housing?” Housing Policy Debate. Housing Development Finance Corporation Limited (HDFC) (2016), The Report on Mortgage Market in India, March. McKinsey Global Institute (2010), India’s Urban Awakening: Building Inclusive Cities, Sustaining Economic Growth, April. Ministry of Housing & Urban Poverty Alleviation (2012), Report of Technical Group (TG-12) on Estimation of Urban Housing Shortage. NCAER (2014), Impact of Investments in the Housing Sector on GDP and Employment in the Indian Economy, April. Reserve Bank of India (2014), Circular-Issue of Long Term Bonds by Banks – Financing of Infrastructure and Affordable Housing, July. Reserve Bank of India (2016), Circular-Investment by a Foreign Venture Capital Investor (FVCI) registered under SEBI (FVCI) Regulations, 2000, October. Reserve Bank of India (2017), Circular- Individual Housing Loans: Rationalisation of Risk-Weights and Loan to Value (LTV) Ratios, June. U.S. Department of Housing and Urban Development (2017), Rent Burden in the Housing Choice Voucher Program, October. Xue, X. (2013), “Affordable Housing in China- A Case Study in Datong”, Masters Dissertation submitted to Ball State University, Muncie, Indiana, July.
|