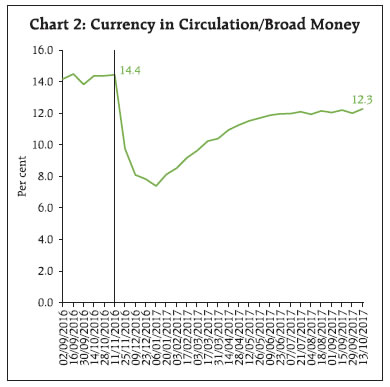
Introduction On November 8, 2016, currency notes of denominations of ₹ 1000 and ₹ 500 (specified bank notes or SBNs) valued at ₹ 15.4 trillion and constituting 86.9 per cent of the value of total notes in circulation, were demonetised. Demonetisation led to several changes for the financial sector which can be summarised below. (a) Shift in currency demand: There has been a significant shift in the income elasticity of currency demand in the post-demonetisation period to 0.9 from more than 1 in the pre-demonetisation period, reflecting a reduction in cash intensity in retail transactions.1 (b) Significant growth in bank deposits: The ‘excess’ low-cost bank deposit growth, a mirror image of the decline in currency in circulation (CIC), following demonetisation has been estimated in the range of 3.0-4.7 percentage points. (c) Greater financial inclusion: Since demonetisation, 50 million new accounts were opened under Pradhan Mantri Jan Dhan Yojana (PMJDY) by October 2017. (d) Detection of suspicious transactions: The amount of unusual cash deposits in special types of accounts (such as the Basic Saving Bank Deposit, PMJDY, Kisan Credit Card (KCC), loan accounts and the like) is estimated in the range of ₹ 1.6-1.7 trillion. (e) Improved monetary transmission: In an environment of a surge in low-cost current account and saving account (CASA) deposits, banks announced a large cut in their marginal cost of funds based lending rates (MCLR) with a 100 basis points (bps) reduction in the 1-year MCLR. (f) Increase in mutual fund investments by households: A sizeable expansion in the collections of debt/income-oriented mutual funds occurred after demonetisation i.e., during November 2016 to March 2017. The assets under management (AUM) by mutual funds increased from about ₹ 16 trillion to ₹ 21 trillion between end-October 2016 and end-October 2017. (g) Higher collections under life insurance schemes: The cumulative insurance premium collections during November 2016 to January 2017 increased by 46 per cent over the same period of the previous year. (h) Accelerated digitisation of retail payments: The latest data reveal that prepaid payment instrument (PPI) volumes increased by 54 per cent between November 2016 and August 2017, as also mirrored in the significant drop in the income elasticity of currency demand referred to earlier. (i) Higher rate of detection of fake Indian currency notes (FICNs): In the post-demonetisation period, the rate of detection of FICNs rose to 6 pieces and 12 pieces for ₹ 500 and ₹ 1000 notes, respectively, for every million pieces of notes processed - more than twice during the pre-demonetisation period. I. Demonetisation and Currency Demand Following demonetisation, there has been a decline in CIC. The demonetised notes were accepted at bank counters till December 30, 2016. Between November 4, 2016 to January 6, 2017 (i.e., between weeks immediately prior to and the lowest level of CIC witnessed after demonetisation), total CIC declined by about ₹ 9 trillion. CIC, which recorded significant downward movement immediately after demonetisation, still remains below its trend: (i) As on October 27, 2017, CIC was lower by 8.0 per cent on y-o-y basis as against an increase of 17.2 per cent in the previous year, notwithstanding the rapid pace of remonetisation (Chart 1a). (ii) As on October 27, 2017, CIC stood at 91 per cent of its pre-demonetisation level, and even lower at 81 per cent, if it is assumed that the increase in CIC would have followed the baseline growth rate (Chart 1b).2 (iii) As a proportion of broad money (M3), CIC fell to 12.3 per cent on October 13, 2017 as compared with 14.4 per cent on November 11, 2016 (Chart 2). 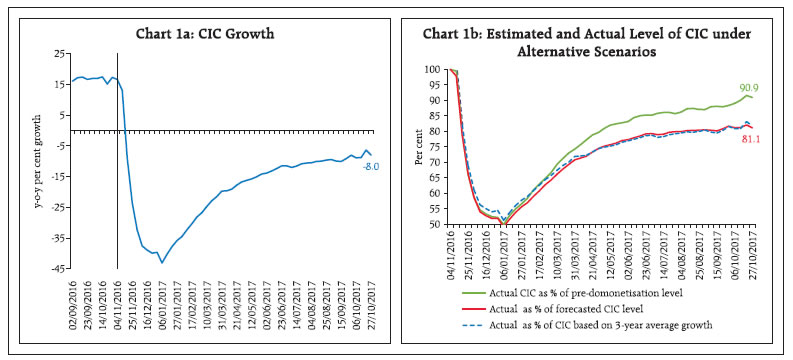
 Thus, there seems to be a noticeable downward trend shift in CIC even without constraints on cash withdrawals. This suggests that demonetisation, given the data available so far, has had a significant effect on the currency holding habits of the public which, in conjunction with greater digitisation of retail transactions and the sharp increase in electronic modes of payments, may have led to a durable downward shift in the currency demand of households. In line with the foregoing discussion, we select four variables viz., CIC (LRcy), real GDP (LRgdp), the consumer price index (CPI-Combined) and the average deposit rate (Rdep) for estimating currency demand. Rolling regressions of CIC on the other variables with a window of 30 quarters was estimated for the sample period from 1998:Q3 to 2017:Q2. The demonetisation effect is captured by using a dummy variable (demon) for 2016:Q4 to 2017:Q1. The long-run point elasticity computed from the estimated model suggests that there is a significant drop in the income elasticity of currency demand in the post-demonetisation period to 0.91 in 2017:Q2 from 1.07 in 2014:Q2 (Chart 3 and Annex 1). Furthermore, the demonetisation impact captured through dummy variable is found to be statistically significant. These model-based results corroborate the trend-based analysis of the impact of demonetisation on currency demand shown in earlier charts. It is important to keep in mind that only more data in the coming months and years will inform researchers of the depth and durability of changes that seem to be underway in this context. 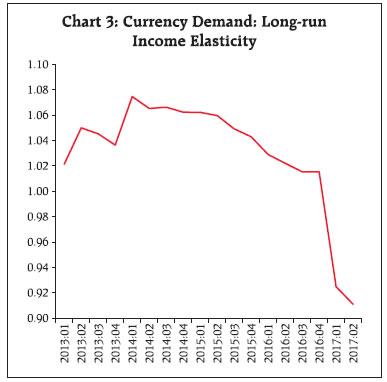 II. Demonetisation and Bank Deposit Growth Between October 28, 2016 to January 6, 2017 notes in circulation declined by about ₹ 9 trillion which, in turn, was largely reflected in an increase of about 4 percentage points in the share of CASA deposits (low-cost deposits) in aggregate deposits of the banking system (Charts 4 and 5).
Demonetisation also led to a significant increase in financial intermediation, with an increase of 38 per cent in deposits in PMJDY accounts, with addition of 27 million accounts post-demonetisation (November 9, 2016 to March 31, 2017). The latest data indicate that 50 million new accounts were opened since demonetisation until October, 2017 (Chart 6). II.a Estimates of Excess Deposits Against this backdrop, deposit behaviour can be analysed with a view to estimating ‘excess’ deposit growth due to demonetisation. First, a macro approach employing certain assumptions and a time series model is adopted to assess the ‘normal’ rate of growth in bank deposits during the demonetisation period and then ‘excess’ growth is derived by juxtaposing it with actual growth. Second, seven categories of special accounts constituting about 30 per cent of bank deposits are evaluated against the growth recorded during previous years. Such accounts are selected in view of the lack of significant activity in these accounts during normal times and indications of unusual cash deposits. II.a.1 Estimates based on Aggregate Banking Statistics In what follows, the benchmark nominal rate of deposit growth is assumed under alternate scenarios to be the same as (i) in the corresponding period of 2015-16; (ii) the average growth recorded during the corresponding periods of the previous two years (i.e., 2014-15 and 2015-16); and (iii) the growth estimated using an ARMA (1,1) model.3 Scenario 1: Normal deposit growth proxied by the observed rate in 2015-16 Aggregate deposits grew by 14.5 per cent (y-o-y) during the period November 11 to December 30, 2016, as against 10.3 per cent during the corresponding period of 2015, indicating a 4.2 percentage point excess deposit growth due to demonetisation (Table 1). In nominal terms, excess deposits work out to ₹ 3.8 trillion. Assessment for the period November 11, 2016 to February 17, 2017 reveals that average fortnightly bank deposit growth was 13.9 per cent, 3.5 percentage points in excess of the assumed normal growth of 10.4 per cent during the corresponding period of 2015-16. With a view to factoring in some temporal tapering of deposits, the actual deposit growth of 13.4 per cent exceeds the estimated growth of 10.1 per cent by 3.3 percentage points if the period up to end-March 2017 is considered. Scenario 2: Normal deposit growth proxied by average of 2014-15 and 2015-16 The average fortnightly growth (y-o-y) in bank deposits during November 11-December 30 of 2014-15 and 2015-16 was 10.6 per cent, while the average deposit growth for the same period of 2016-17 was 14.5 per cent. Under this scenario, excess deposit growth due to demonetisation is estimated at 4 percentage points (Table 1). On the same basis, deposit growth for the period November 11 to February 17, 2017 was 3.3 percentage points in excess of the deposit growth of 10.7 per cent, based on the average growth of deposits in the same period of the previous two years. If the period up to end-March 2017 is considered, the excess deposit growth works out to 3 percentage points above the average deposit growth of 10.4 per cent. | Table 1: Estimated Impact of Demonetisation on SCBs’ Aggregate Deposits | | Period | Deposit growth | Scenario I | Scenario II | Scenario III | | November 11, 2016 to December 30, 2016 | Excess growth in percentage points
| 4.2 | 4.0 | 4.7 | | Excess growth in ₹ billion | 3,829 | 3,608 | 4,309 | | November 11, 2016 to February 17, 2017 | Excess growth in percentage points
| 3.5 | 3.3 | 4.2 | | Excess growth in ₹ billion | 3,233 | 2,991 | 3,848 | | November 11, 2016 to March 31, 2017 | Excess growth in percentage points
| 3.3 | 3.0 | 3.8 | | Excess growth in ₹ billion | 3,088 | 2,754 | 3,472 | | Note: Due to fortnightly reporting system, data have been taken from the fortnight ending November 11, 2016 to capture the impact of demonetisation. | Scenario 3: Estimates based on ARMA Model Deposit growth (y-o-y) was also forecasted by using an ARMA (1,1) model on fortnightly data for the period 2012-13 to 2016-17 (up to the fortnight ending October 28, 2016) (see Annex 2 to 6). The excess deposit growth due to demonetisation using the model works out to 4.7 percentage points over the model forecast growth of 9.8 per cent for the period November 11-December 30, 2016 (Table 1). For the period November 11, 2016 to February 17, 2017 deposit growth was 4.2 percentage points in excess of the model forecast growth of 9.7 per cent. When the period up to end-March 2017 is taken into account, the excess deposit growth is 3.8 percentage points over the model forecast growth of 9.7 per cent. II.a.2 Estimation of Excess Deposits based on Bank Accounts About ₹ 370 billion of SBNs were exchanged under the over-the-counter exchange facility at bank branches until November 25, 2016. A significant amount of SBNs also flowed into the special types of accounts such as Basic Saving Bank Deposit Accounts (BSBDA); PMJDY Accounts; KCC; dormant or inoperative accounts; co-operative banks’ accounts with scheduled commercial banks (SCBs); bullion trader/jewellers’ accounts; and loan accounts. The total cash deposits in these seven types of accounts during November-December 2016 with 52 banks were estimated at ₹ 4,358 billion. Cash deposits in these accounts during September-October 2016 were ₹ 2,701 billion. Thus, the variation of ₹ 1,657 billion can be assumed to be the increase in cash deposits under these accounts due to demonetisation, given that there is a lack of noticeable activity in such accounts during normal times. The estimated cash deposits in such accounts with 52 banks amounted to ₹ 3,065 billion during November-December 2015. Assuming the trend growth rate of last five years (i.e., growth of -9.2 per cent in net deposits during November- December for last 5 years), estimated cash deposits in these accounts during November-December 2016 works out to ₹ 2,783 billion. Thus, under this assumption, excess cash deposits during November- December 2016 would be ₹ 1,575 billion. Excess deposit growth in the banking system during the demonetisation period (i.e., November 11, 2016 to December 30, 2016) works out to 4.0-4.7 percentage points. If the period up to mid-February 2017 is taken into account to allow for some surge to taper off, excess deposit growth is in the range of 3.3- 4.2 percentage points. Considering some more temporal tapering of deposits, the exercise taken up to end-March 2017 reveals that excess deposit growth would be in the range of 3.0-3.8 percentage points. In nominal terms, excess deposits that accrued to the banking system due to demonetisation are estimated in the range of ₹ 2.8-4.3 trillion. The unusual cash deposits in specific accounts, which are usually less active, is estimated to be in the range of ₹ 1.6-1.7 trillion. Overall, there appears to have been a significant increase in bank deposits due to demonetisation, which if sustained, could have a favourable impact on financial savings and their channelisation to capital markets. III. Demonetisation and Monetary Transmission As banks credited the depositors’ accounts with the value of surrendered demonetised bank notes, CASA deposits of banks rose sharply in the post-demonetisation period. The share of the low-cost CASA deposits in total bank deposits increased from 35.2 per cent in October 2016 to 40.6 per cent in March 2017, before declining to 38.6 per cent in June 2017. With credit demand remaining sluggish, banks reduced their term deposit rates significantly towards end-December 2016/early January 2017; interest rates on saving deposit accounts, however, were left unchanged. In an environment of surplus liquidity, weak credit demand, lower cost of term deposits and a surge in low cost CASA deposits, banks announced a large cut in their MCLRs in January 2017. The median term deposit rates of SCBs declined by 62 bps during November 2016-August 2017 (Chart 7), while the weighted average term deposit rate of banks declined by 69 bps. The weighted average lending rate (WALR) of banks in respect of fresh rupee loans declined by nearly 100 bps during November 2016-August 2017 (Chart 7). The 1-year median MCLR has declined by a cumulative 80 bps since November 2016. This is significant, considering that the 1-year median MCLR declined by only 15 bps during the preceding seven months (April-October 2016) when the policy repo rate was reduced by 50 bps. The WALR on outstanding rupee loans declined by 50 bps during November 2016-August 2017. Thus, a large part of the transmission was facilitated by the surplus liquidity on account of demonetisation. IV. Demonetisation and Financialisation of Savings Demonetisation also resulted in gains for the non-banking financial intermediaries such as debt/ income oriented mutual funds and insurance companies. In fact, the aggregate balance sheet of the non-banking financial companies (NBFCs) expanded by 14.5 per cent during 2016-17. The financialisation of saving can be broken up under three non-banking financial intermediaries: mutual funds, insurance companies and NBFCs. IV.a Mutual Funds Moderation in interest rates on bank deposits after demonetisation and decline in the price of gold enhanced the relative attractiveness of both debt and equity oriented mutual funds. Reflective of this, AUM by mutual funds increased to ₹ 17.5 trillion by end-March 2017 and further to ₹ 21.4 trillion at end- October 2017. The buoyant equity market also improved the attractiveness of equity oriented mutual funds. Resource mobilisation under equity schemes more than doubled during this period. There were also net inflows in the income/debt schemes during November 2016-June 2017 in contrast to net outflows during November 2015-June 2016. This was reflected in a sharp increase in the overall resources mobilised by mutual funds during November 2016-June 2017 as compared with the same period last year (Table 2). Higher resource mobilisation by mutual funds after demonetisation has mainly been driven by retail and high net worth individual investors. | Table 2: Net Inflows/Outflows in Mutual Funds | | (₹ billion) | | Category | Nov 2015 - June 2016 | Nov 2016 - June 2017 | 2015-16 | 2016-17 | April-September | | 2017-18 | | Income / Debt Schemes | -328.6 | 386.2 | 330.1 | 2131.5 | 676.1 | | Equity Schemes | 235.7 | 670.7 | 740.3 | 703.7 | 803.6 | | Balanced Schemes | 111.4 | 436.5 | 197.4 | 366.1 | 470.5 | | Exchange Traded Fund | 75.5 | 203.8 | 78.2 | 232.8 | 72.5 | | Fund of Funds Investing Overseas | -2.4 | -1.9 | -4.2 | -3.6 | -2.6 | | Total | 91.6 | 1695.5 | 1341.8 | 3430.5 | 2020.0 | | Source: Securities and Exchange Board of India. | IV.b Life Insurance Companies Collections of premia by life insurance companies more than doubled in November 2016 (Table 3). Premia collected by Life Insurance Corporation (LIC) of India increased by 142 per cent (y-o-y) in November 2016, whereas collection by private sector life insurance companies increased by nearly 50 per cent. About 85 per cent of the total collections by LIC of India in November 2016 were under the ‘single premium’ policies, which are paid lump sum, unlike the non-single premium policies that can be paid monthly, quarterly or annually. The LIC of India revised downward the annuity rates of its immediate annuity plan Jeevan Akshay VI purchased from December 1, 2016, which might have created a spurt in collections in the month of November 2016. The cumulative collections during November 2016 to January 2017 increased by 46 per cent over the same period of the previous year. Despite subsequent slowdown in the growth rate, the premium collections still witnessed an average growth of 22 per cent during November 2016 to September 2017. IV.c Non-Banking Financial Companies (NBFCs) Loans disbursed by all categories of NBFCs declined significantly in November 2016 as compared with the monthly average disbursals during April- October 2016, especially by micro finance companies (NBFC-MFIs) whose business is cash intensive (Table 4). Disbursements by Asset Finance Companies (AFCs) and Loan Companies (LCs) generally contracted up to February 2017. Disbursals turned positive from March 2017 and grew generally at a higher rate than the monthly average disbursals recorded during April- October 2016. In the case of MFIs, however, disbursals continued to contract in comparison with the monthly average of disbursals during April-October 2016 in view of the uncertainty surrounding loan waivers by state governments. | Table 3: Life Insurance Premium* | | (₹ billion) | | Month | Private Insurance cos. | y-o-y growth (%) | LIC | y-o-y growth (%) | Grand Total | y-o-y growth (%) | | Nov-2016 | 35.3 | 48.9 | 125.3 | 141.9 | 160.6 | 112.7 | | Dec-2016 | 47.5 | 28.4 | 82.6 | 12.8 | 130.1 | 18.1 | | Jan-2017 | 44.1 | 23.8 | 87.2 | 29.8 | 131.4 | 27.8 | | Feb-2017 | 39.4 | 13.0 | 68.5 | -12.3 | 107.9 | -4.5 | | Mar-2017 | 93.8 | 17.8 | 253.0 | 7.5 | 346.8 | 10.1 | | Apr-2017 | 25.6 | 22.3 | 44.3 | -24.7 | 69.9 | -12.3 | | May-2017 | 33.9 | 4.5 | 84.1 | 14.2 | 118.0 | 11.2 | | Jun-2017 | 40.2 | 16.2 | 104.5 | 11.7 | 144.7 | 12.9 | | Jul-17 | 41.7 | 33.9 | 162.5 | 51.4 | 204.3 | 47.4 | | Aug-17 | 41.3 | 15.8 | 133.8 | 24.9 | 175.1 | 22.6 | | Sep-17 | 55.9 | -1.1 | 153.0 | 37.6 | 208.9 | 24.6 | | Nov-2016 to Jan-2017 | 126.9 | 31.8 | 295.1 | 53.5 | 422.1 | 46.3 | | Nov-2016 to Sep-2017 | 498.7 | 18.1 | 1298.9 | 22.8 | 1797.7 | 21.5 | * Data pertain to ‘first year premium’.
Source: Insurance Regulatory and Development Authority of India. |
| Table 4: Disbursals by Non-Bank Finance Companies in India | | Category | Monthly average disbursal (April-Oct 2016) in ₹ billion | % Change over monthly average disbursal of April-October 2016 | | Nov-16 | Dec-16 | Jan-17 | Feb-17 | Mar-17 | Apr-17 | May-17 | Jun-17 | | Asset Finance Companies (12) | 186.8 | -14.6 | 9.2 | -6.9 | -2.5 | 48.7 | -10.4 | 1.1 | 22.8 | | Loan Companies (13) | 611.6 | -24.7 | -22.5 | -19.3 | -12.6 | 39.9 | 4.5 | 7.1 | 13.0 | | Micro Finance Companies (12) | 94.1 | -63.2 | -71.4 | -56.5 | -42.3 | -5.8 | -47.8 | -11.3 | -15.3 | Note: Figures in parenthesis pertain to number of companies covered.
Source: Reserve Bank of India. | In contrast to disbursals, growth in collections (i.e., repayments of loans due) of AFCs and LCs during November 2016-June 2017 increased significantly over the monthly average collections during April-October 2016 (Table 5). Collections by NBFC-MFIs declined during November 2016-February 2017 vis-à-vis April- October 2016, but witnessed an improvement during the months of March, May and June 2017. | Table 5: Collections by Non-Bank Finance Companies in India | | Category | Monthly average collection (April-Oct 2016) in ₹ billion | % Change over monthly average collection of April-October 2016 | | Nov-16 | Dec-16 | Jan-17 | Feb-17 | Mar-17 | Apr-17 | May-17 | Jun-17 | | Asset Finance Companies (12) | 123.2 | -4.3 | 7.7 | 5.5 | 5.1 | 19.4 | 5.3 | 13.1 | 7.7 | | Loan Companies (13) | 355.8 | 3.9 | 14.9 | 4.5 | 6.4 | 58.9 | 24.9 | 21.0 | 38.9 | | Micro Finance Companies (12) | 74.9 | -8.8 | -0.8 | -3.7 | -8.7 | 7.9 | -3.8 | 5.2 | 1.4 | Note: Figures in parenthesis pertain to number of companies covered.
Source: Reserve Bank of India. | Bank credit to NBFCs decelerated from 5.1 per cent (y-o-y) in October 2016 to 1.3 per cent in November 2016; however, it subsequently improved to 10.9 per cent in March 2017. In terms of the returns submitted by the reporting NBFCs, loans and advances by NBFCs increased broadly at the same rate in the year ending March 2017 (16.4 per cent) as in the year ending March 2016 (16.6 per cent) (Table 6). In summary, demonetisation appears to have led to the acceleration of the financialisation of savings in India. V. Demonetisation and Digitisation of Payments Another important outcome of demonetisation has been the considerable increase in use of digital transactions. The pattern of digital transactions in March 2017 over November 2016 showed that growth rates surged in both value and volume terms compared to the corresponding period last year. The behaviour of electronic payments suggests that the surge in digital activity has been sustained. The latest data reveal that Prepaid Payment Instrument (PPI) volumes increased by 54 per cent between November 2016 and August 2017 and the transactions under the Immediate Payment Service (IMPS) more than doubled during the same period (Table 7). Debit and credit card payments at point of sale (PoS), the familiar and time-tested mode of digital payments, also recorded a sharp pick-up. | Table 6: Consolidated Balance Sheet of NBFC Sector | | (y-o-y growth in per cent) | | Items | Mar-16 | Mar-17 | | 1. Total Borrowings | 15.3 | 15.0 | | 2. Current Liabilities and Provisions | 31.8 | 16.0 | | Total Liabilities / Assets | 15.5 | 14.5 | | 1. Loans & Advances | 16.6 | 16.4 | | 2. Investments | 10.8 | 11.9 | | Income/Expenditure | | | | 1.Total Income | 15.8 | 8.9 | | 2. Total Expenditure | 15.8 | 9.6 | | 3. Net Profit | 15.6 | -2.9 | | Source: Reserve Bank of India. | In addition, there appears to be a structural break in the volume and value of retail electronic payments, coinciding with the onset of demonetisation and the special measures put in place to promote digital payments. The trend in the volume of retail electronic payments points to a structural shift having taken place after November 2016 (Chart 8a and b). | Table 7: Growth in Digital Mode of Payments | | Month/Year | EFT/NEFT | Immediate Payment Service (IMPS) | Credit/Debit Cards (Usage at ATMs and POS) | Prepaid Payment Instruments (M-wallet, PPI card, paper vouchers) | Volume
(Million) | Value
(₹ billion) | Volume
(Million) | Value
(₹ billion) | Volume
(Million) | Value
(₹ billion) | Volume
(Million) | Value
(₹ billion) | | Nov-2016 | 123.0 | 8807.9 | 36.2 | 324.8 | 896.1 | 1823.2 | 169.3 | 50.7 | | Mar-2017 | 186.7 | 16294.5 | 67.4 | 564.7 | 1089.4 | 2952.6 | 342.1 | 106.8 | | Aug-2017 | 151.6 | 12500.4 | 75.7 | 651.5 | 1097.8 | 3072.1 | 261.1 | 102.9 | | Growth rate (%) | | | | | | | | | | Mar-2017 over Nov-2016 | 51.7 | 85.0 | 86.4 | 73.9 | 21.6 | 61.9 | 102.0 | 110.4 | | Aug-2017 over Nov-2016 | 23.2 | 41.9 | 109.2 | 100.6 | 22.5 | 68.5 | 54.2 | 102.7 | EFT/NEFT: Electronic fund transfer/national electronic funds transfer.
Source: Reserve Bank of India. |
VI. Demonetisation and Detection of Fake Indian Currency Notes (FICNs) During 2016-17, 762,072 pieces of counterfeit notes were detected in the banking system, 20.4 per cent higher than in the previous year. Coincident with the announcement of the withdrawal of legal tender status of SBNs on November 8, 2016, the Reserve Bank launched a nation-wide exercise to estimate the density of FICNs detected during the counting and verification of notes. The result showed the rate of FICNs detected per million pieces of notes processed at the currency chest level was 7 pieces for ₹ 500 denomination and 19 pieces for ₹ 1000 denomination. At the Reserve Bank’s currency verification and processing system, there were 2 pieces of FICNs of ₹ 500 denomination and 6 pieces of FICNs of ₹ 1000 denomination for every million pieces of notes processed during 2015-16; these rose to 6 pieces and 12 pieces, respectively, during the post-demonetisation period. As compared to 2015-16, 12 clusters for ₹ 500 denomination and 14 clusters for ₹ 1000 denomination showed a statistically significant higher rate of FICN detection during the post-demonetisation period.4 These findings imply a significant pick-up in the rate of FICN detection at the Reserve Bank level in the post-demonetisation period as compared to a year ago. VII. Conclusion To conclude, an important effect of demonetisation has been the inducement to shift towards formal channels of saving by households and a noticeable downward shift in the currency demand of public. There has been a sharp increase in the number of accounts under the PMJDY and the deposits in such accounts have also surged, which has given a boost to financial inclusion efforts. During demonetisation and the subsequent period, there has been a distinct increase in saving flows into equity/ debt oriented mutual funds and life insurance policies. Apart from this, non-banking financial companies seem to have recorded improvement in collections and disbursals. Demonetisation-led increase in CASA deposits also led to significant improvement in transmission to bank lending rates during the post-demonetisation period. The challenge, going forward, would be to channel these funds into productive segments of the economy and expand the footprints of the digital economy, which has undergone a sharp increase - another important consequence of demonetisation. References: Box, George and Jenkins, Gwilym (1970), Time Series Analysis: Forecasting and Control, San Francisco: Holden-Day. Dash, Manoranjan, Singh, Bhupal, Herwadkar, Snehal and Rasmi Ranjan Behera (2017), Financialisation of Savings into Non-Banking Financial Intermediaries, Mint Street Memo No. 02, Reserve Bank of India. RBI (2017), Annual Report for 2016-17. RBI (2017), Report of the Internal Study Group to Review the Working of the Marginal Cost of Funds Based Lending Rate System. Singh, Bhupal and Indrajit Roy (2017), Demonetisation and Bank Deposit Growth, Mint Street Memo No. 01, Reserve Bank of India.
Annex 1: Rolling Regressions 1998:Q3 to 2017:Q2 (with rolling window of 30 quarters) Rolling regression for the window post-demonetisation: Long-run income elasticity = 0.91* (31.5).
*: Significant at less than 5 per cent level.
The results pertain to the rolling estimates of the last sample period. Notes: Figures in parentheses are t-statistics. CPI index has been used to transform nominal variables into real. LRcy = log of real currency in circulation; LRgdp = log of real GVA Rdep = real deposit rate for the tenure 1-3 years demon = dummy variable 1 for 2016:Q4 and 2017:Q1 and 0 for others. The lag dependent variable (i.e., LRcyt-1) is observed to be insignificant at conventional level for the last estimates (which represent currency demand adjustment in the post-demonetisation period), though it was significant during the predemonetisation period. However, the estimated long-term income elasticity is statistically significant at 1% level.
Annex 2: Unit Root Tests for Stationarity | Null Hypothesis: Deposit growth (DEPGR) has a unit root | | Exogenous: Constant, Linear Trend | | | t-Statistic | Prob.* | | Augmented Dickey-Fuller test statistic | -3.39 | 0.06 | | Phillips-Perron test statistic | -4.07 | 0.01 | | Note: Test critical values are: -4.01 at 1% level, -3.43 at ** 5% level, * -3.14 10% level. |
Annex 3: Estimates of ARMA(1,1) Model | Dependent Variable: Aggregate deposit growth rate (DEPGR) | | Variable | Coefficient | t-Statistic | | C | 16.48** | 24.81 | | TREND | -0.04** | -4.53 | | AR(1) | 0.94** | 35.60 | | MA(1) | -0.37** | -5.57 | | R-squared | 0.93 | | | Akaike info criterion | 2.12 | | | Schwarz criterion | 2.21 | | | ** Significant at 1% level. |
Annex 4: Serial Correlation LM Test | Correlogram Q-statistic | | Lag | AC | PAC | Q-Stat | Prob. | | 3 | 0.04 | 0.06 | 3.85 | 0.08 | | 10 | -0.10 | -0.10 | 6.54 | 0.59 | | Correlogram Squared Residuals | | 1 | 0.12 | 0.12 | 2.49 | 0.12 | | 10 | -0.05 | -0.08 | 10.18 | 0.43 | | Note: All Q-statistics are highly insignificant suggesting no serial correlation left in the residuals. |
Annex 5: Heteroskedasticity Test – ARCH | Null Hypothesis: Residuals are homoskedastic | | F-statistic | 2.46 | Prob. F(1,160) | 0.13 | | Obs*R-squared | 2.44 | Prob. Chi-Square(1) | 0.12 |
Annex 6: Stationarity of the ARMA (1,1) Model: Inverse Roots of AR/MA Polynomial(s)
|