Non-Banking Finance Companies (NBFCs) have played an important role in the Indian financial system by complementing and competing with banks, and by bringing in efficiency and diversity into financial intermediation. NBFCs have evolved considerably in terms of operations, heterogeneity, asset quality and profitability, and regulatory architecture. Going forward, the growing systemic importance and interconnectedness of this sector calls for regulatory vigil. Section 1: Introduction The world over, non-banking financial entities complement the mainstream banking system in the process of financial intermediation. Regarded as shadow banks by the Financial Stability Board (FSB) –“entities and activities (fully or partially) outside the regular banking system”1 (FSB, 2017), these specialised intermediaries leverage on lower transaction costs, financial innovations and regulatory arbitrage. In emerging economies, they often play an important role because of their ability to (a) reach out to inaccessible areas; and (b) act as not just complements but also substitutes to banks when the banks are confronted with stricter regulatory constraints. Customers tend to find the non-banking entities convenient due to their quicker decision-making ability, prompt provision of services and expertise in niche segments. Apart from widening the ambit of and access to financial services, they also enhance the resilience of the financial system by acting as backup institutions when banks come under stress. Given the nature of their operations, NBFCs also carry inherent risks including, excess leverage, amplification of procyclicality and over-reliance on wholesale funding (Ghosh, et al, 2012). Given their exposure to niche segments, they may also suffer from concentration of risks. They are often not allowed the benefit from the central bank as lender of last resort and from deposits insurance institutions. The shadow banking sector in India primarily includes NBFCs and collective investment vehicles such as money market funds, fixed income funds, mixed funds, real estate funds, and securitisation-based credit intermediation like securitisation vehicles and structured finance vehicles. NBFCs are, however, distinctly different from shadow banking entities in other countries. They are regulated by the Reserve Bank of India (RBI) with priority being assigned to calibrating regulations to harmonise them with those of the banking sector regulations to minimise the scope of regulatory arbitrage. NBFCs are gaining increasing importance in the Indian financial system, accounting for about 9 per cent of the total assets of the financial sector – the third largest segment after scheduled commercial banks or SCBs (64 per cent) and insurance companies (14 per cent) (RBI, 2014).2 Mapping of the degree of interconnectedness showed that NBFCs had the third largest bilateral exposures after banks and mutual funds. Also, they were the biggest receivers of funds, on a net basis, surpassing banks, signifying their systemic importance. In the context of the slowdown in bank credit in the wake of asset quality stress in recent years, double-digit growth in credit by NBFCs has distinctly emphasised their role as credit provider in India’s financial system. Against this backdrop, this article explores recent developments in the operations of NBFCs in India across time as well as in a cross-country perspective, based on data from the FSB database and supervisory returns filed by NBFCs with the Reserve Bank. The rest of the article is divided into seven sections. Section 2 provides a comparative perspective of the Indian non-banking financial sector relative to counterparts in other countries. Section 3 provides an overview of the structure of the non-banking financial institutions (NBFIs) sector in India. Section 4 discusses salient regulatory developments in this sector in recent years, particularly those aimed at addressing stability and inclusion. Section 5 analyses key indicators of the NBFCs sector’s balance sheet, particularly of the NBFC-Non-Deposit taking Systemically Important (ND-SI) segment. Section 6 presents the sectoral distribution of credit from NBFCs and implications for the process of financial inclusion. Section 7 presents salient indicators of the financial health of NBFCs and wherever possible compares them with the banking system.3 Section 8 provides concluding observations and the way forward. 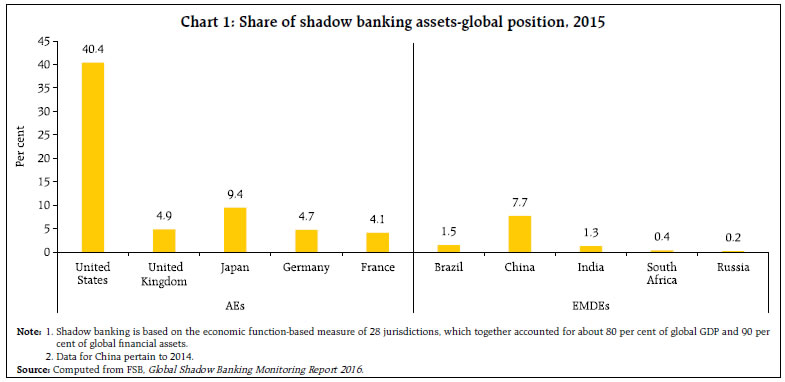 Section 2: A Cross Country Perspective There has been a steady expansion in the size of the global shadow banking sector in recent years from US$ 31 trillion in 2010 to US$ 34 trillion in 2015 (FSB, 2017).The size of India’s shadow banking sector stood at US$ 436 billion, accounting for 1.3 per cent of the total global shadow banking assets in 2015 (Chart 1). Shadow banking assets were placed at about 14 per cent of total domestic financial assets in 2015 (Chart 2). Global shadow banking assets were primarily concentrated in the advanced economies (AEs), particularly the United States and the United Kingdom. AEs accounted for about three-fourth of the global shadow banking assets. The higher share of AEs in shadow banking activities could partly be attributed to tighter regulation of mainstream banks and low interest rates. Although securitisation declined in these economies, less risky shadow banking activities such as those undertaken by investment funds have expanded rapidly in recent years (Monaghan, 2014). Despite being a small player in the global shadow banking business, India has stood out among both AEs and emerging market and developing economies (EMDEs) in terms of high growth, after China and Russia which reported growth rates exceeding 10 per cent in shadow banking assets between 2011 and 2015 (Chart 3). The surge in growth of shadow banking in China was primarily demand-driven, emanating from developers, local governments and small and medium enterprises (SMEs), as access to bank credit became restricted (Bottelier, 2015). Section 3: Structure of the NBFIs Sector in India The Reserve Bank regulates and supervises three categories of NBFIs, viz. All-India financial institutions (AIFIs), primary dealers (PDs) and NBFCs (Chart 4).4 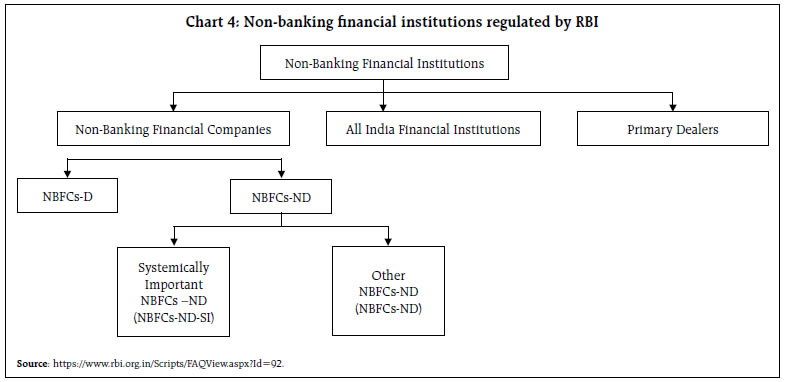 Based on deposit mobilisation, NBFCs are classified into two major categories: NBFCs-D (deposit taking) and NBFCs-ND (non-deposit taking).5 In view of the phenomenal increase in their number and deposits, a comprehensive legislative framework for NBFCs-D was introduced in 1997 to protect the interests of depositors. A conscious policy was pursued to discourage acceptance of deposits by NBFCs so that only banks accept public deposits. Hence, no new license has been given to NBFCs-D after 1997. NBFCs-ND were sub-divided into two categories in 2006 - Systemically Important Non- Deposit taking NBFCs (NBFCs-ND-SI) and other Non-Deposit taking NBFCs (NBFCs-ND) based on asset size.6 NBFCs with an asset size greater than ₹1 billion were considered as NBFC-ND-SI. The threshold for recognition of NBFCs-ND-SI was increased to ₹5 billion in 2014. This classification was made in order to ensure greater regulatory control over NBFCs-NDSI, which were expected to pose greater systemic risks on account of their larger size. NBFCs-ND-SI, as a result, were subjected to stricter prudential regulations as compared to NBFCs-ND.7 The number of NBFCs-ND-SI increased till 2014 due to increased licences given to these entities following notification of newer categories. Thereafter, there was a decline in their number mainly reflecting the increase in threshold asset size for defining NBFCs-ND-SI (Table 1). NBFCs-ND-SI have become significantly larger than NBFCs-D – their share in total assets of the two categories taken together was about 86 per cent in 2017 (Chart 5). 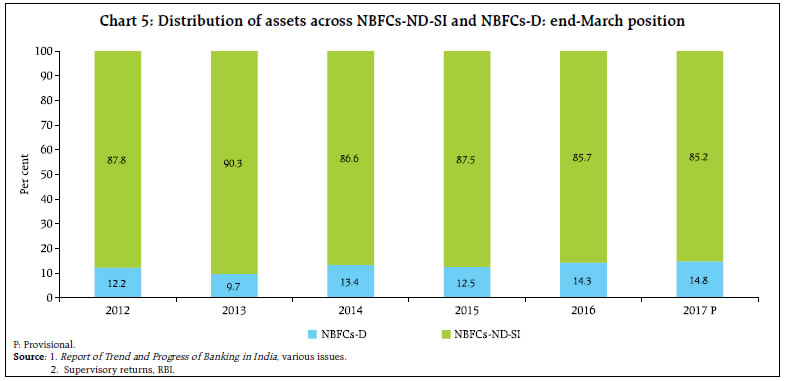 Based on activities undertaken, NBFCs are classified into 12 major categories8 (Table 2). While loan companies and investment companies have traditionally been the two core categories of the NBFC sector, newer categories have been added to this sector over time in recognition of the growing diversification of financial intermediation and the need for better regulatory oversight. Illustratively, in 2006, ‘hire purchase’ and ‘equipment leasing’ categories were merged and categorised as Asset Finance Companies (AFCs) – the third major category in the NBFC sector. Infrastructure Finance Companies (NBFC-IFC) were defined as a separate category in 2010. NBFC-IDFs were set up in 2011 to increase longterm debt financing of infrastructure projects as well as to alleviate asset liability mismatches arising out of financing such projects. They were envisaged to take over loans provided for infrastructure projects based on Public Private Partnership (PPP) route which had completed one year of commercial operation.9 NBFCs-MFI were also set up in 2011 in order to serve the needs of the micro finance sector and the underserved segments more effectively. The focus of the regulations was more on strengthening the lending and recovery practices in the sector, especially with regard to the pricing of credit and multiple lending operations leading to over borrowing. NBFC-Factors were notified in accordance with the Factoring Act, 2011 as they were required to be registered with the Reserve Bank as NBFCs to commence their operations. | Table 1: Number of different types of NBFCs in India: end-March position | | Year | NBFC-D | NBFC-ND-SI | NBFC-ND | Total | | 2012 | 273 | 375 | 12,010 | 12,385 | | 2013 | 254 | 418 | 11,553 | 12,225 | | 2014 | 241 | 465 | 11,323 | 12,029 | | 2015 | 220 | 420 | 11,202 | 11,842 | | 2016 | 202 | 209 | 11,271 | 11,682 | | 2017 (P) | 178 | 218 | 11,126 | 11,522 | P: Provisional.
Sources: 1. Report of Trend and Progress of Banking in India, various issues.
2. Supervisory returns, RBI. |
| Table 2: Classification of NBFCs based on activities undertaken | | Types of NBFCs | Activity | | 1. Asset Finance Company (AFC) | Financing of physical assets supporting productive/economic activity, including automobiles, tractors and generators. | | 2. Loan Company | Providing finance by extending loans or otherwise for any activity other than its own but does not include an AFC. | | 3. Investment Company | Acquiring securities for the purposes of selling. | | 4. Infrastructure Finance Company (NBFC-IFC) | Providing infrastructure loans. | | 5. Systemically Important Core Investment Company (CIC-ND-SI) | Acquiring shares and securities for investment in mainly equity shares. | | 6. Infrastructure Debt Fund (NBFC-IDF) | For facilitating flow of long-term debt into infrastructure projects. | | 7. Micro Finance Institution (NBFC-MFI) | Extending credit to economically disadvantaged groups as well support Micro, Small and Medium Enterprises (MSMEs). | | 8. Factor (NBFC-Factor) | Undertaking the business of acquiring receivables of an assignor or extending loans against the security interest of the receivables at a discount. | | 9. NBFC- Non-Operative Financial Holding Company (NOFHC) | For permitting promoter / promoter groups to set up a new bank. | | 10. Mortgage Guarantee Company (MGC) | Undertaking mortgage activities. | | 11. Account Aggregator (NBFC-AA) | Collecting and providing the information of customers’ financial assets in a consolidated, organised and retrievable manner to the customer or others as specified by the customer. | | 12. Non-Banking Financial Company – Peer to Peer Lending Platform (NBFC-P2P) | Providing an online platform to bring lenders and borrowers together to help mobilise unsecured finance. | | Source: https://www.rbi.org.in/Scripts/FAQView.aspx?Id=92. | Notwithstanding the addition of newer categories over time, loan companies remain the single largest category, with a share of 36.2 per cent in total assets of NBFCs at end-March 2017. NBFCs-IFC emerged as the second-largest category following the growing thrust on infrastructure financing. AFCs occupied the third position constituting 13.7 per cent of total assets of NBFCs followed by investment companies. NBFCs-MFI, although accounting for only about 3 per cent of the NBFC sector’s assets at end-March 2017, have shown a steady rise in its share since their inception (Table 3). | Table 3: Shares of NBFCs classified by activities in total assets of the NBFC sector: end-March position | | (Per cent) | | Category | 2012 | 2013 | 2014 | 2015 | 2016 | 2017 | | 1. Loan companies | 31.2 | 28.9 | 28.6 | 28.0 | 33.2 | 36.2 | | 2. NBFCs-IFC | 30.8 | 32.1 | 34.0 | 35.4 | 27.1 | 31.5 | | 3. AFCs | 12.6 | 14.2 | 14.3 | 13.9 | 13.2 | 13.7 | | 4. Investment companies | 22.3 | 21.4 | 19.7 | 17.7 | 22.4 | 12.6 | | 5. NBFCs-MFI | 1.6 | 1.9 | 1.9 | 2.4 | 2.8 | 3.0 | | 6. CICs-ND-SI | 1.0 | 1.2 | 1.2 | 2.2 | 0.9 | 2.2 | | 7. NBFCs-Factor | 0.5 | 0.3 | 0.3 | 0.2 | 0.2 | 0.1 | | 8. IDF-NBFCs | 0.0 | 0.0 | 0.0 | 0.1 | 0.3 | 0.6 | | Total | 100.0 | 100.0 | 100.0 | 100.0 | 100.0 | 100.0 | Note: 1. Data are provisional.
2. NOFHC, MGC and NBFC-AA data are not captured in the Table as they have a miniscule share in the total assets of the NBFC sector.
Source: Supervisory returns, RBI. | Section 4: Regulatory Environment for NBFCs NBFCs were brought under the regulation of the Reserve Bank in 1964 by inserting Chapter III B in the Reserve Bank of India Act, 1934. In more recent years, regulatory measures have been motivated by the objectives of financial stability, financial inclusion and harnessing of specialised domain expertise. As alluded to in the preceding section, one of the key regulatory initiatives by the Reserve Bank to improve the role of NBFCs in financial inclusion was the creation of NBFCs-MFI in 2011, following the recommendations by the Sub-Committee of the Central Board of the Reserve Bank (Chairman: Shri Y. H. Malegam). In 2015, guidelines for this segment were revised, including the enhancement of the annual income limit for availing microfinance loans, increasing the limit of total indebtedness of the borrower and rationalisation of income generation criteria following the recommendations of the Committee on Comprehensive Financial Services for Small Businesses and Low Income Households (Chairman: Shri Nachiket Mor). As regards financial stability related concerns, a revised regulatory framework was introduced in 2014 to ensure that only strong entities exist in the NBFC sector. Accordingly, the minimum amount of net owned funds (NOF) for NBFCs registered before April 21, 1999 was stepped up to ₹20 million from ₹2.5 million and the capital adequacy framework was further strengthened.10 Furthermore, only rated NBFCs-D were allowed to accept public deposits for enhanced depositors’ protection. In order to plug regulatory gaps to minimise regulatory arbitrage, the prudential norms for NBFCs, including asset classification and provisioning norms, were harmonised with those for banks in a phased manner. In September 2016, the Reserve Bank allowed the establishment of a new category of NBFCs NBFCAccount Aggregator (AA) to provide a consolidated view of individual investors’ financial asset holdings on a single platform, even for entities falling under the purview of different financial sector regulators. Recently, the Reserve Bank issued guidelines for regulating the NBFCs undertaking peer-to-peer (P2P) lending activities. | Table 4: Key indicators of NBFCs | | (Amount in ₹ billion) | | Item | 2014 | 2015 | 2016 | 2017 | | 1. Share Capital | 737 | 851 | 761 | 921 | | 2. Reserves & Surplus | 2,723 | 3,117 | 3,033 | 3,538 | | 3. Public Deposits | 131 | 205 | 271 | 306 | | 4. Borrowings | 10,142 | 12,237 | 12,263 | 13,748 | | 5. Others | 766 | 875 | 904 | 1,159 | | Total Liabilities/Assets | 14,499 | 17,284 | 17,231 | 19,671 | | | (12.9) | (13.9) | (12.6) | (12.9) | | 1. Loans & Advances | 10,782 | 12,875 | 13,169 | 14,846 | | 2. Investments | 2,159 | 2,603 | 2,253 | 2,673 | | 3. Cash & Bank Balances | 548 | 668 | 585 | 778 | | 4. Others | 1,010 | 1,138 | 1,225 | 1,375 | | Financial Ratios (per cent) | | | | | | 1. Income to total assets | 11.8 | 11.6 | 12.4 | 11.7 | | 2. Cost to income ratio | 52.9 | 52.1 | 50.4 | 49.4 | | 3. Gross NPA to total advances | 3.9 | 4.1 | 4.5 | 5.0 | | 4. Net NPA to total advances | 2.5 | 2.5 | 2.5 | 2.3 | | 5. Return on equity | 9.0 | 10.3 | 7.9 | 6.8 | Note: 1. Data are provisional.
2. Figures in parentheses are percentages to GDP.
Source: 1. Financial Stability Report, various issues.
2. Supervisory returns, RBI.
3. Handbook of Statistics on the Indian Economy, various issues. | Section 5: Key Indicators of the NBFCs Sector Reflecting their ability to evolve as well as innovate, NBFCs have recorded robust growth in recent years. Moreover, their balance sheet performance has been better than banks on various parameters (Table 4). Credit by NBFCs-ND-SI has risen strongly in recent years with a growth of 13 per cent in 2016-17 (Table 5). This is in contrast to the slowdown in bank credit growth, especially in respect of public sector banks. As a result, the credit intensity, i.e., credit as per cent of GDP, of NBFCs-ND-SI has shown a steady increase, reaching 8 per cent in 2017 (Chart 6). | Table 5: Credit growth of NBFCs and banks | | (per cent) | | Year | NBFCs-ND-SI | Banks | Private Sector Banks | Public Sector Banks | | 2011-12 | 30.5 | 16.8 | 21.8 | 16.4 | | 2012-13 | 23.7 | 14.0 | 18.5 | 12.0 | | 2013-14 | 8.8 | 14.2 | 16.1 | 13.9 | | 2014-15 | 15.0 | 9.3 | 18.6 | 7.8 | | 2015-16 | 12.4 | 10.9 | 25.7 | 1.4 | | 2016-17 (P) | 13.0 | 5.4 | 17.1 | 0.6 | P: Provisional.
Source: 1. Report on Trend and Progress of Banking in India, Various Issues.
2. Handbook of Statistics on the Indian Economy, RBI.
3. Quarterly Statistics on Deposits and Credit of Scheduled Commercial Banks, RBI. |
NBFCs-ND-SI credit has maintained a steady share in total credit to the commercial sector barring a dip in 2015-16 due to a pick-up in bank credit as well as the conversion of Bandhan Financial Services and Infrastructure Development Finance Corporation (IDFC), two major players in the NBFC sector, into universal banks (Chart 7).11 Their share went up sharply in 2016-17 reflecting growing intermediation. 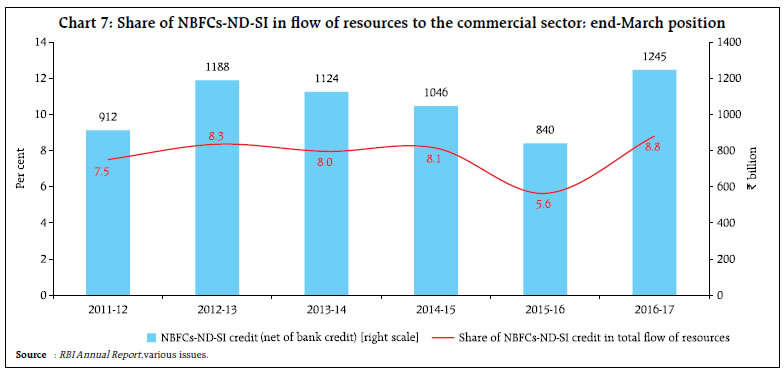 Among NBFCs-ND-SI, credit extension is the main business for loan companies, NBFCs-IFC, NBFCs-MFI, and AFCs. While all these categories of NBFCs posted double-digit growth till 2015-16, they showed divergent patterns in 2016-17. Loan companies and NBFCs-IFC maintained positive credit growth, whereas NBFCs-MFI and AFCs shrank their asset portfolios mainly due to conversion of large NBFCs- MFI into small finance banks during the year (Table 6). AFCs, which mainly lend to finance vehicles and retail loans, were affected by the postponement of purchase decisions by their customers due to uncertainty in the wake of demonetisation (RBI, 2017). Protection of depositors’ interests has been a dominant objective of the Reserve Bank and, therefore, there has been a conscious move to contain deposit mobilisation by NBFCs-D. Nevertheless, amount of public deposits mobilised by NBFCs-D has grown over time (Chart 8). As a share of total liabilities of NBFCs sector, it increased from 0.5 per cent in 2012 to 1.6 per cent by end-March 2017. In absolute terms, the total deposit mobilisation by these institutions stood at ₹306 billion at end-March 2017, though less than one per cent of bank deposits. | Table 6: Growth rate of credit of major categories of NBFCs | | Category | 2012-13 | 2013-14 | 2014-15 | 2015-16 | 2016-17 | | Loan Companies | 11.3 | 7.7 | 20.5 | 22.7 | 22.1 | | NBFCs-IFC | 24.4 | 17.8 | 24.6 | 7.6 | 5.6 | | NBFCs-MFI | 34.3 | 21.3 | 47.6 | 36.3 | -3.4 | | AFCs | 30.0 | 10.4 | 13.2 | 23.1 | -17.1 | Note: Data are provisional.
Source: Supervisory returns, RBI. |
Borrowings constitute about 71 per cent of total liabilities of NBFCs-ND-SI. While banks have been the main source of borrowings for NBFCs-ND-SI, they have been increasingly replaced with market-based instruments in recent years. In 2016-17, NBFCs- ND-SI largely borrowed through debentures, which constituted nearly half of their total borrowings. Borrowing through commercial paper too has increased over time, reflecting lower cost of raising funds through these instruments (Chart 9). Section 6: Sectoral Distribution of NBFCs Credit NBFCs-ND-SI have traditionally funded both the industrial sector and the retail segment. While industry has received about two-thirds of the total credit by these companies, the share of retail credit has increased from 3.4 per cent in 2014-15 to 15.6 per cent in 2015-16 and 17.7 per cent in 2016-17 (Chart 10).12 Several NBFCs-ND-SI specialise in financing niche segments, including the micro and small enterprises (MSE), which particularly figure prominently in the loan portfolios of NBFCs-MFI and loan companies. Over recent years, there has been a steady growth in the credit to MSE sector from these two categories (Chart 11). This was mainly on account of the revision in December 2015 in the returns filed by NBFCs, as mentioned earlier. NBFCs-IFC and NBFC-IDFs are the two major categories within NBFCs-ND-SI which specialise in infrastructure financing. In line with bank credit, infrastructure credit growth of NBFCs-IFC and NBFC-IDFs has decelerated in recent years (Chart 12), attributed to industrial slowdown, particularly in the power sector as well as the conversion of IDFC into a universal bank.13 Nevertheless, growth in infrastructure credit by NBFCs-IFC and NBFCs-IDF was higher than by banks, which, in fact, reported credit contraction in 2016-17.14 Section 7: Key Soundness Indicators of NBFCs There has been a steady deterioration in asset quality of NBFCs in recent years. Gross non-performing assets (GNPA) ratio for NBFCs increased to 5.0 per cent at end-March 2017 from 2.9 per cent at end-March 2012. The deterioration in asset quality could partly be attributed to the change in NPA recognition norms. Notwithstanding the recent deterioration, their asset quality remained better than that of banks (Chart 13). Return on Assets (RoA) of NBFCs declined from 2013 onwards in tandem with the asset quality deterioration in the financial system (Chart 14). Compared to banks, however, NBFCs reported a fairly higher RoA. The capital to risk-weighted assets ratio (CRAR) of NBFCs has declined in recent years although it was higher than the prescribed regulatory level of 15 per cent, symbolising the soundness of the sector (Chart 15). 8. Conclusions and the Way Forward India’s NBFC sector, which has shown robust growth in the recent years, is generically different from shadow banks operating elsewhere in the world, as this article has argued. The regulatory framework for NBFCs in India has evolved over time in line with the growing functional diversification of the sector while keeping in view the objectives of depositors’ interest, financial inclusion and financial stability. At the same time, the shaping and calibration of regulatory initiatives have been influenced by considerations of harnessing sectorspecific expertise and the proven abilities of these institutions to serve niche segments. The creation of different categories of NBFCs signifies this intention. While allowing for diversification of the sector, harmonisation of the regulatory framework for NBFCs, both within the sector and with that for banks, is being pursued to minimise regulatory arbitrage. An assessment of the recent financial performance of NBFCs suggests that they are emerging as an important source of credit to micro and small enterprises and infrastructure. Although the capital position of NBFC sector remains strong, the gradual deterioration in their asset quality points to the need for greater monitoring. The growth of financial technology (fintech) platforms presage even greater scope and opportunities for the NBFC sector. New players in the field of P2P/business-to-business (B2B)/ business-to-consumers (B2C) lending offer novel opportunities for NBFCs to evolve further and emerge as an increasingly important component of India’s financial landscape. References Bottelier, Pieter (2015), “Shadow Banking in China”, World Bank 1818 H Association - Economics and Financial Chapters, June 17. FSB (2015), Global Shadow Banking Monitoring Report - 2015, Financial Stability Board. - (2017), Global Shadow Banking Monitoring Report - 2016, Financial Stability Board. Ghosh Swati, Mazo Ines Gonzalez del, and Ötker-Robe İnci. (2012), “Chasing the Shadows: How Significant Is Shadow Banking in Emerging Markets?” World Bank Economic Premise, (88). Monaghan, Angela (2014), “Shadow banking system a growing risk to financial stability – IMF”, The Guardian, October 01. RBI (2014), Financial Stability Report, December, Reserve Bank of India, Mumbai. - (2017), Macroeconomic Impact of Demonetisation- A Preliminary Assessment, Reserve Bank of India, Mumbai.
|