This article presents the monthly seasonal factors of selected 84 economic/financial time series covering five broad sectors (viz., monetary and banking aggregates, price, industrial production, external trade and services sector) for 2015-16, based on data for more than a decade. For a majority of monetary/banking indicators and industrial production, seasonal peaks are witnessed in March. On the other hand, the seasonal troughs of industrial production was found to be occurring in February/April/August. Among IIP sub-groups, seasonal variation is found to be higher for ‘food products and beverages’ and ‘coal production’. For WPI, seasonal variation are high for ‘food articles’ due to high seasonality in eggs, fruits and vegetables items whereas ‘manufactured products’, ‘non-food manufactured products’ as well as for ‘non-food non-fuel commodities’ witnessed minimal seasonality. A majority of service sector indicators recorded seasonal peaks in March and seasonal troughs in September. ‘Sale of Commercial motor vehicles’ exhibited high seasonal variation. Economic activities are often seasonal and, when measured at a frequency less than a year (e.g., weekly, monthly, quarterly), may exhibit seasonal fluctuations around their annual trend. Seasonal variations occur due to climatic conditions, production cycle characteristics, seasonal nature of economic activity, festivals, vacation practices, etc. Analysis of the seasonal pattern and magnitude is useful in interpretation of movements of economic variables over time. Seasonal adjustment, i.e., removal of seasonal effects in variables, helps in estimating underlying sequential changes and is useful in understanding the underlying economic phenomenon. Prior knowledge of seasonal fluctuations also allows policy makers to take policy measures to attenuate the impact. Towards this objective, monthly seasonal factors for selected economic and financial time series relating to the Indian economy are being published annually in the Bulletin since 19801. 2. Data Coverage and Methodology For estimating the seasonal factors, 84 monthly economic/financial time series in the Indian context, covering (i) Monetary and Banking Indicators (17 series); (ii) Wholesale Price Index (WPI) (26 series); (iii) Consumer Price Index (CPI) (3 series); (iv) Industrial Production (29 series); (v) External Trade Sector (3 series) and (vi) Service Sector Indicators (6 series) have been considered. For calculation of seasonal factors (SFs), monthly data from Apr 1994 to Mar 2016 (i.e., last 22 years) are considered for most of the series. However, the reference period for CPI – Agricultural Labourers and CPI- Rural Labourers are last 20 years whereas it is last 12 years for Fertiliser Production and Natural Gas Production, due to non availability of consistent time series data for 22 years. Using these data, SF estimates have been compiled for the last 10 years using X-13ARIMA-SEATS software package, developed by the US Bureau of Census2, where the Diwali festival (major holiday in India, which moves in October/November over the years) as well as trading day effects@ are incorporated. The seasonality of series are further subjected to various parametric and non-parametric statistical test procedures to assess their statistical significance. 3. Salient Findings 3.1 Seasonal Variation during Last Ten Years (2006-07 to 2015-16) The average monthly SFs over the last ten years are presented in Table 1. Annual estimates of seasonal variation in terms of range (difference between peak and trough SF values during a year), during the period, are presented in Table 2. The changing pattern of seasonality in the latest period (i.e., 2015-16 over previous 5-year average) is presented in Table 3. The list of top-20 and bottom-20 series based on the average SF range, during last five years (i.e., 2011-12 to 2015-16) and the corresponding peak and trough months are presented in Table 4. The salient features of seasonal variation over the reference period are briefly discussed below. 3.2 Characteristics of Seasonal Factors 3.2.1 Seasonality across Indicators • Monetary and Banking Indicators: Seasonal variation remained stable and range-bound for majority of monetary and banking indicators during the last 10 years. Time deposits of schedule commercial banks (SCBs) exhibited the lowest seasonal variation (average SF range: 1.8), followed by aggregate deposits of SCBs (average SF range: 2.2) and broad money (average SF range: 2.4). Within aggregate deposits, seasonal variation of demand deposits started moderating post 2008-09 and has become stable since 2012-13. Seasonal variation of broad money remained at a lower level than narrow money and reserve money. SCBs’ demand deposits and their assets with the banking system exhibited high seasonal fluctuation (Table 2). 15 out of 17 monetary and banking series witnessed seasonal peak during March-May while seasonal trough of majority of these series occurred during August-September and in December (Chart 1). 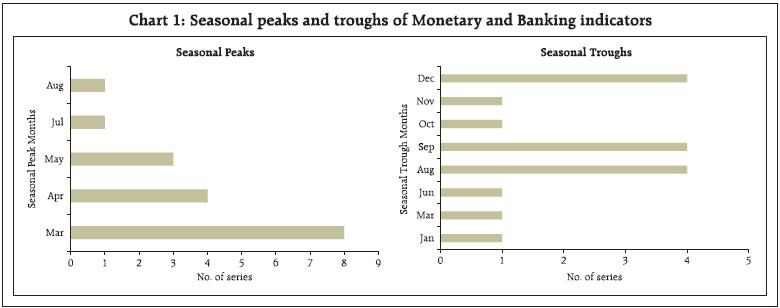 • Consumer Price Index: Consumer Price Indices, including those for Agricultural Labourers (AL) and Rural Labourers (RL), displayed low seasonality at aggregate level during the last ten years. CPI-AL had consistently higher variation than the CPI-RL. The seasonality of various CPI series were marginally higher than WPI-All Commodities but the gap has narrowed down in recent times (Chart 2 & Table 2). CPI series recorded peak seasonality in October, while seasonal peak for WPI occurred in September. Seasonality in CPI-Combined (CPI-C) is not presented in this article as its data span is little over five years. 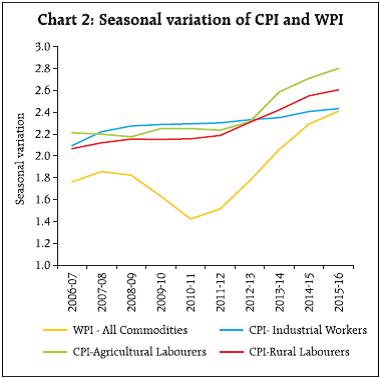 • Wholesale Price Index: Out of 26 WPI series, 11 series witnessed their seasonal peaks in September and November whereas seasonal troughs were traced in March for 10 WPI series (Chart 3). Seasonal fluctuations of WPI-All Commodities started increasing marginally since 2011-12 primarily due to higher seasonal fluctuation in Food Articles, which witnessed average seasonal peak in October. Egg and Fruits & Vegetables recorded very high average seasonal variation of 19.0 and 12.1, respectively (Table 2). On the other hand, Manufactured Products had seasonal peak in May but had overall low seasonal fluctuation. 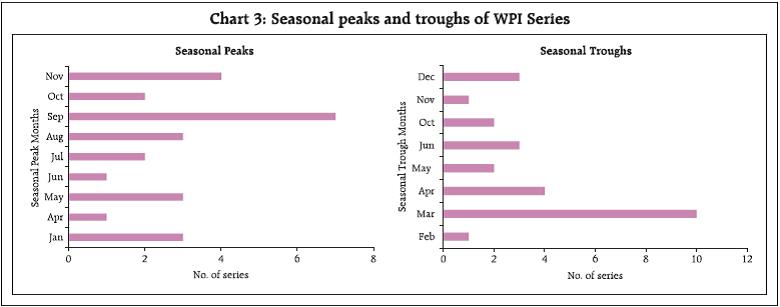 • Industrial production: Index of Industrial Production (IIP) – General recorded high seasonality during the last decade. A majority of IIP series recorded seasonal peak in March while February, April and August were the seasonal lows (Chart 4). As per the use-based classification, IIP-Consumer Non-durables and IIP- Intermediate Goods exhibited high and low seasonal fluctuation respectively (Table 2). As per IIP sectoral classification, Mining and Electricity exhibited the highest and the lowest seasonal variation, respectively. Among the core-industries, seasonal patterns are found to be consistently higher for cement production compared to steel production. 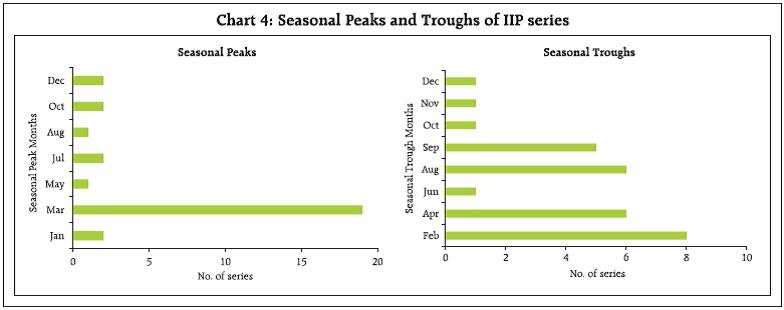 • Service Sector Indicators: A majority of services sector indicators had their seasonal peak in March and trough in September (Chart 5). Sale of commercial motor vehicles remained highly seasonal. In air passenger traffic, domestic sector witnessed higher seasonal variation when compared to the international sector, though the gap started narrowing since 2010-11(Table 2). Domestic passenger air traffic observed seasonal peak in May, which coincides with the school holiday season. The seasonal variation of cargo handled at major ports, gradually declined and remained lower than railway freight traffic. • External Trade: Merchandise exports recorded seasonal peak in March while November witnessed the trough, and its seasonality moderated since 2012-13 (Chart 6 & Table 2). Merchandise imports (including non-oil non-gold import) peaked in May and it was the lowest in February. The seasonality in non-oil non-gold imports rose since 2012-13. 3.2.2 Indicators with High and Low Seasonality Based on the average range of monthly seasonal factors during last five years (i.e., 2011-12 to 2015-16), it is observed that the external trade and service sector indicators exhibited high seasonality followed by industrial production while seasonal variations in money and banking aggregates and aggregate prices are relatively lower. Among 84 series, ‘IIP-Food products and beverages’ (Peak seasonal factor value of 136.8 in January vis-à-vis trough value 69.9 in September),‘Coal Production’ (Peak seasonal factor value of 134.0 in March vis-à-vis trough value 82.6 in September), ‘IIP-Fabricated Metal Products, except machinery & equipment’ (Peak seasonal factor value of 130.8 in March vis-à-vis trough value 83.7 in April), ‘Sales of commercial motor vehicles’ (Peak seasonal factor value of 128.2 in March vis-à-vis trough value 87.3 in April) and ‘Consumer non-durable goods industries’ (Peak seasonal factor value of 115.6 in December vis-à-vis trough value 88.9 in October) have exhibited high seasonal variation. On the other hand, ‘WPI-Manufactured Products’, ‘WPI-Non-food Manufactured Products’ and ‘WPI – Non-food non-fuel’ have shown low seasonality (Table 4). 3.3 Changing Seasonality 3.3.1 Pattern in Seasonal Fluctuation over Last 10 Years Seasonal behavior of some indicators has witnessed variation over the past 10 years and the pattern of change was not symmetric across indicators. A regression based test3 indicates that seasonal fluctuation moderated in 41 series, 21 series exhibited increased volatility of seasonal component and remaining 22 series maintained broadly similar seasonal behavior over the years (Chart 7). Out of these series, seasonal fluctuation of monetary and banking series moderated or remained broadly unchanged. Among the IIP categories, seasonal variation increased for ‘consumer goods’ (durables and non-durables), and ‘electricity’. Among the core industries, similar pattern was observed in ‘natural gas production’, and ‘petroleum refinery production’. Among WPI items, seasonal variation of ‘food items’ increased significantly over this period. 3.3.2 Change in Seasonal Peak and Trough Months In respect of some of the indicators, the seasonal peak/trough months shifted in 2015-16 as compared with last 5 years’ average (2010-11 to 2014-15) although the shift was by only one month for majority of them (Table 3). Of the 84 series, simultaneous shift of peak and trough months was observed for 11 series, viz., ‘Narrow money’, ‘Time deposits’, ‘WPI- sugar’, ‘Cash in hand and Balances with the RBI (SCBs)’, ‘WPI- Cereals’, ‘WPI- Wheat’, ‘WPI- Fruits & Vegetables’, ‘WPI- Egg, Meat & Fish’, ‘WPI- Non-food articles’, ‘WPI– non-food non-fuel’ and ‘Steel production’. Out of 17 series under money and banking category, both seasonal peak and trough months shifted for 3 series while they remained unchanged for 9 series. Seasonal peak and trough both remained unchanged for 4 of the 26 WPI series, whereas shift in either peak (11 series) or trough (5 series) was observed for 16 series (Chart 8). The peak/trough months remained unaltered for all 3 CPI, 6 services sector and 3 external trade series. 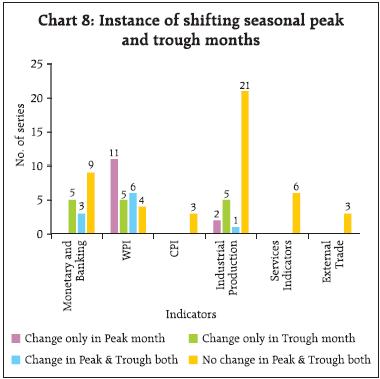 3.3.3 Seasonal Variation in the Latest Year Across the 84 series, seasonal variation in 2015-16 has remained broadly close to the previous five years’ average (Chart 9). Among the highly seasonal series, seasonal variation of ‘Coal production’ and ‘IIP – Fabricated metal products, except machinery & equipment’ declined in 2015-16 as compared to last five years average. 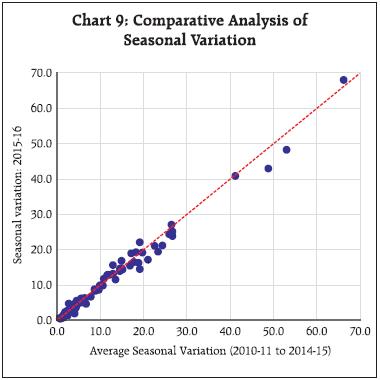
| Table 1: Average Monthly Seasonal Factors1 of Selected Economic Time Series | | Series Name | Apr | May | Jun | Jul | Aug | Sep | Oct | Nov | Dec | Jan | Feb | Mar | | 1 | 2 | 3 | 4 | 5 | 6 | 7 | 8 | 9 | 10 | 11 | 12 | 13 | | A.1.1 Broad Money (M3) | 101.4 | 101.0 | 100.1 | 100.3 | 99.8 | 99.5 | 99.7 | 99.4 | 99.1 | 99.4 | 99.7 | 100.7 | | A.1.1.1 Net Bank Credit to Government | 101.3 | 101.2 | 100.7 | 101.7 | 100.9 | 99.6 | 99.8 | 99.9 | 97.7 | 98.9 | 98.8 | 99.7 | | A.1.1.2 Bank Credit to Commercial Sector | 101.1 | 100.3 | 100.2 | 99.4 | 99.1 | 99.5 | 99.2 | 99.2 | 99.7 | 99.8 | 100.2 | 102.2 | | A.1.2 Narrow Money (M1) | 102.3 | 101.5 | 100.6 | 99.2 | 98.7 | 99.2 | 98.5 | 98.6 | 99.2 | 98.9 | 100.0 | 103.2 | | A.1.2.1 Currency with Public | 103.1 | 103.4 | 101.8 | 99.4 | 98.5 | 97.5 | 98.0 | 98.9 | 99.1 | 99.6 | 100.3 | 100.4 | | A.1.3 Reserve Money (RM) | 102.6 | 101.8 | 101.1 | 99.7 | 98.8 | 98.1 | 98.5 | 99.2 | 98.7 | 98.4 | 99.0 | 104.4 | | A.1.3.1 Currency in Circulation | 102.9 | 103.3 | 101.9 | 99.3 | 98.5 | 97.4 | 98.4 | 99.0 | 99.2 | 99.5 | 100.2 | 100.5 | | A.1.3.1.1 Notes in Circulation | 102.9 | 103.4 | 101.9 | 99.3 | 98.5 | 97.4 | 98.3 | 99.0 | 99.1 | 99.5 | 100.2 | 100.5 | | A.2.1 Aggregate Deposits (SCBs) | 101.2 | 100.6 | 99.8 | 100.5 | 100.1 | 99.8 | 100.0 | 99.5 | 99.0 | 99.4 | 99.6 | 100.6 | | A.2.1.1 Demand Deposits (SCBs) | 101.1 | 98.6 | 98.2 | 98.4 | 98.6 | 101.2 | 99.5 | 98.6 | 99.5 | 98.7 | 99.7 | 107.4 | | A.2.1.2 Time Deposits (SCBs) | 100.9 | 100.7 | 99.9 | 100.6 | 100.1 | 99.6 | 100.4 | 99.9 | 99.1 | 99.6 | 99.6 | 99.7 | | A.3.1 Cash in Hand and Balances with RBI (SCBs) | 102.5 | 99.3 | 100.4 | 101.3 | 101.1 | 101.2 | 99.5 | 100.9 | 99.3 | 97.3 | 98.5 | 99.4 | | A.3.2 Assets with the Banking System (SCBs) | 103.2 | 100.8 | 101.9 | 97.7 | 97.9 | 98.9 | 97.8 | 94.5 | 98.2 | 97.1 | 99.3 | 112.7 | | A.3.3 Bank Credit (SCBs) | 101.2 | 100.3 | 100.1 | 99.3 | 98.8 | 99.2 | 99.4 | 99.2 | 99.8 | 100.1 | 100.4 | 102.2 | | A.3.3.1 Loans, Cash, Credits and Overdrafts (SCBs) | 100.6 | 100.1 | 100.3 | 99.1 | 98.8 | 100.4 | 99.1 | 99.1 | 99.6 | 99.7 | 100.1 | 103.1 | | A.3.3.2 Non-Food Credit (SCBs) | 101.3 | 100.1 | 100.0 | 99.4 | 99.0 | 99.5 | 99.3 | 99.1 | 99.7 | 99.8 | 100.2 | 102.5 | | A.3.4 Investments (SCBs) | 100.5 | 100.5 | 100.0 | 101.1 | 101.8 | 100.8 | 100.8 | 100.3 | 98.6 | 99.0 | 99.1 | 97.6 | | B. WPI (Base: 2004-05=100) All Commodities | 100.0 | 100.0 | 100.1 | 100.6 | 100.7 | 100.7 | 100.5 | 100.2 | 99.5 | 99.5 | 99.0 | 99.1 | | B.1 WPI - Primary Articles | 99.5 | 99.5 | 100.3 | 101.2 | 101.9 | 101.6 | 101.3 | 101.2 | 99.2 | 99.0 | 97.8 | 97.6 | | B.1.1 WPI - Food Articles | 98.8 | 99.0 | 100.0 | 101.4 | 101.8 | 102.3 | 102.6 | 102.2 | 99.1 | 99.1 | 97.1 | 96.6 | | B.1.1.1 WPI - Food Grains (Cereals+Pulses) | 99.0 | 98.8 | 99.1 | 99.7 | 100.2 | 100.3 | 101.2 | 101.2 | 100.7 | 100.5 | 100.0 | 99.1 | | B.1.1.1.1 WPI - Cereals | 99.3 | 99.2 | 99.2 | 99.6 | 100.0 | 100.1 | 100.7 | 100.7 | 100.5 | 100.7 | 100.4 | 99.6 | | B.1.1.1.1.1 WPI - Wheat | 99.1 | 98.4 | 98.3 | 98.9 | 99.3 | 99.6 | 99.4 | 100.9 | 101.6 | 102.2 | 102.2 | 100.1 | | B.1.1.1.1.2 WPI - Rice | 98.9 | 99.1 | 99.4 | 100.1 | 100.6 | 100.9 | 101.4 | 101.1 | 100.2 | 99.8 | 99.6 | 98.9 | | B.1.1.1.2 WPI - Pulses | 97.9 | 97.8 | 98.2 | 100.4 | 101.0 | 101.8 | 102.8 | 102.9 | 101.6 | 100.0 | 98.5 | 97.2 | | B.1.1.2 WPI - Fruits & Vegetables | 96.9 | 98.3 | 100.9 | 105.3 | 107.5 | 107.6 | 107.6 | 105.5 | 94.9 | 95.5 | 89.9 | 89.8 | | B.1.1.3 WPI - Milk | 99.7 | 99.7 | 100.0 | 100.5 | 100.1 | 100.2 | 100.3 | 100.2 | 99.9 | 99.9 | 99.8 | 99.6 | | B.1.1.4 WPI - Egg, Meat and Fish | 98.8 | 100.1 | 100.4 | 100.8 | 100.4 | 100.5 | 99.5 | 99.4 | 100.1 | 100.6 | 100.4 | 99.6 | | B.1.1.4.1 WPI - Egg | 94.9 | 95.1 | 98.3 | 97.5 | 97.5 | 98.8 | 99.9 | 105.1 | 105.7 | 106.7 | 101.7 | 99.1 | | B.1.1.4.2 WPI - Meat | 99.1 | 99.8 | 101.0 | 100.7 | 100.2 | 99.4 | 99.0 | 99.4 | 99.8 | 100.9 | 100.1 | 100.2 | | B.1.1.4.3 WPI - Fish | 98.8 | 100.6 | 100.3 | 101.3 | 101.0 | 101.4 | 100.1 | 100.2 | 99.2 | 99.4 | 99.8 | 98.9 | | B.1.1.5 WPI - Protein Items (viz., Pulses, Milk, Egg, Meat and Fish) Group | 99.2 | 99.7 | 100.0 | 100.6 | 100.5 | 100.7 | 100.6 | 100.1 | 99.9 | 99.9 | 99.8 | 99.2 | | B.1.2 WPI - Non-Food Articles | 100.6 | 100.6 | 100.3 | 100.3 | 100.5 | 100.4 | 99.0 | 99.2 | 99.5 | 99.9 | 99.4 | 100.4 | | B.1.2.1 WPI - Fibres | 99.0 | 99.4 | 100.3 | 102.1 | 101.7 | 102.9 | 99.5 | 99.2 | 99.5 | 99.6 | 98.7 | 98.2 | | B.1.2.1.1 WPI - Raw Cotton | 98.8 | 99.4 | 100.6 | 103.0 | 102.9 | 104.0 | 99.2 | 98.9 | 98.7 | 99.0 | 98.0 | 97.6 | | B.1.2.2 WPI - Oil Seeds | 100.3 | 101.0 | 101.0 | 101.2 | 101.7 | 101.0 | 98.9 | 98.3 | 98.7 | 99.6 | 99.0 | 99.1 | | B.2 WPI - Manufactured Products | 100.3 | 100.4 | 100.2 | 100.2 | 100.2 | 100.1 | 100.0 | 99.7 | 99.6 | 99.8 | 99.8 | 99.8 | | B.2.1 WPI - Food Products | 99.7 | 99.7 | 99.6 | 100.2 | 100.4 | 100.5 | 100.4 | 100.2 | 100.0 | 100.1 | 99.8 | 99.2 | | B.2.1.1 WPI - Grain Mill Products | 99.2 | 98.4 | 98.6 | 99.2 | 99.4 | 99.9 | 100.5 | 101.0 | 100.7 | 101.3 | 101.2 | 100.5 | | B.2.1.2 WPI - Sugar | 99.2 | 98.6 | 98.0 | 98.9 | 100.1 | 101.2 | 101.4 | 101.5 | 101.3 | 101.0 | 99.7 | 99.3 | | B.2.1.3 WPI - Edible Oils | 99.9 | 100.3 | 100.2 | 100.4 | 100.7 | 100.3 | 99.5 | 99.5 | 100.1 | 100.1 | 99.7 | 99.4 | | B.3 WPI - Non Food Manufactured Products | 100.3 | 100.4 | 100.3 | 100.1 | 100.1 | 100.0 | 99.9 | 99.7 | 99.5 | 99.8 | 99.9 | 100.1 | | B.4 WPI - Non Food Non-Fuel | 100.4 | 100.6 | 100.5 | 100.2 | 100.2 | 100.1 | 99.9 | 99.6 | 99.4 | 99.5 | 99.7 | 100.0 | | C.1 Consumer Price Index for Industrial Workers (Base: 2001=100) | 99.1 | 99.3 | 99.6 | 100.8 | 100.8 | 100.7 | 101.1 | 101.0 | 100.0 | 99.7 | 99.2 | 98.8 | | C.2 Consumer Price Index for Agricultural Labourers (Base: 1986-87=100) | 98.9 | 99.0 | 99.5 | 100.2 | 100.7 | 100.9 | 101.2 | 101.1 | 100.4 | 99.8 | 99.3 | 98.9 | | C.3 Consumer Price Index for Rural Labourers (Base: 1986-87=100) | 98.9 | 99.1 | 99.5 | 100.2 | 100.7 | 100.9 | 101.1 | 101.1 | 100.4 | 99.8 | 99.4 | 98.9 |
| Table 1: Average Monthly Seasonal Factors1 of Selected Economic Time Series (Concld.) | | Series/Month | Apr | May | Jun | Jul | Aug | Sep | Oct | Nov | Dec | Jan | Feb | Mar | | 1 | 2 | 3 | 4 | 5 | 6 | 7 | 8 | 9 | 10 | 11 | 12 | 13 | | D. IIP (Base 2004-05 = 100) General Index | 96.8 | 98.6 | 98.1 | 98.2 | 95.7 | 97.3 | 99.0 | 98.0 | 104.2 | 104.5 | 99.7 | 109.9 | | D.1.1 IIP - Basic Goods Industries | 98.1 | 101.1 | 98.3 | 98.3 | 97.7 | 95.3 | 99.7 | 97.6 | 103.0 | 104.3 | 97.6 | 108.8 | | D.1.2 IIP - Intermediate Goods Industries | 97.0 | 100.6 | 99.3 | 101.3 | 99.9 | 98.1 | 99.2 | 97.8 | 102.4 | 101.4 | 97.1 | 106.0 | | D.1.3 IIP - Consumer Goods Industries | 99.5 | 98.3 | 97.3 | 97.2 | 92.3 | 94.9 | 96.0 | 95.5 | 105.8 | 108.7 | 105.3 | 109.2 | | D.1.3.1 IIP - Consumer Durable Goods Industries | 99.4 | 100.9 | 98.8 | 100.4 | 96.5 | 101.5 | 105.9 | 97.6 | 92.9 | 100.5 | 100.0 | 105.9 | | D.1.3.2 IIP - Consumer Non-Durable Goods Industries | 98.5 | 96.4 | 96.1 | 95.0 | 89.9 | 90.0 | 89.5 | 95.6 | 115.1 | 114.6 | 109.4 | 110.0 | | D.2.1 IIP - Mining | 97.5 | 100.1 | 95.7 | 93.3 | 91.9 | 90.5 | 98.4 | 100.0 | 106.6 | 108.1 | 101.7 | 116.5 | | D.2.2 IIP - Manufacturing | 96.3 | 97.9 | 97.9 | 98.4 | 95.8 | 98.0 | 98.7 | 97.8 | 104.4 | 104.4 | 100.1 | 110.1 | | D.2.2.1 IIP - Food products and beverages | 97.2 | 89.6 | 89.1 | 81.7 | 72.1 | 70.3 | 76.6 | 97.5 | 134.4 | 136.2 | 127.9 | 127.7 | | D.2.2.2 IIP - Textiles | 98.8 | 99.3 | 99.1 | 101.8 | 102.7 | 99.3 | 100.4 | 99.3 | 101.7 | 101.5 | 95.8 | 100.3 | | D.2.2.3 IIP - Wood and products of wood & cork except furniture; articles of straw & plating materials | 90.6 | 101.6 | 98.4 | 101.2 | 99.6 | 96.5 | 95.0 | 98.7 | 108.2 | 100.3 | 104.5 | 105.1 | | D.2.2.4 IIP - Paper and paper products | 96.9 | 101.7 | 98.4 | 102.1 | 101.2 | 100.2 | 100.5 | 98.4 | 99.9 | 99.5 | 95.9 | 105.4 | | D.2.2.5 IIP - Publishing, printing & reproduction of recorded media | 98.5 | 101.3 | 98.9 | 103.1 | 101.4 | 98.2 | 103.0 | 99.4 | 102.5 | 99.7 | 94.5 | 99.6 | | D.2.2.6 IIP - Coke, refined petroleum products & nuclear fuel | 94.9 | 99.1 | 100.1 | 101.2 | 100.6 | 95.9 | 100.7 | 98.2 | 102.4 | 104.1 | 96.7 | 106.3 | | D.2.2.7 IIP - Chemicals and chemical products | 96.6 | 100.8 | 102.0 | 102.6 | 102.2 | 101.2 | 100.3 | 99.3 | 101.6 | 99.5 | 93.8 | 100.1 | | D.2.2.8 IIP - Rubber and plastics products | 99.4 | 103.9 | 102.2 | 99.7 | 95.2 | 97.0 | 98.1 | 98.6 | 101.6 | 100.8 | 97.2 | 106.3 | | D.2.2.9 IIP - Other non-metallic mineral products | 101.4 | 101.8 | 98.5 | 99.3 | 94.2 | 94.2 | 100.0 | 94.2 | 102.4 | 103.8 | 99.0 | 111.0 | | D.2.2.10 IIP - Basic metals | 97.8 | 100.3 | 98.7 | 99.4 | 100.0 | 97.9 | 100.1 | 98.1 | 101.2 | 102.3 | 97.3 | 106.9 | | D.2.2.11 IIP - Fabricated metal products, except machinery & equipment | 84.2 | 91.1 | 96.7 | 95.6 | 96.8 | 102.7 | 95.7 | 98.3 | 105.1 | 100.9 | 101.7 | 131.3 | | D.2.2.12 IIP - Motor vehicles, trailers & semi-trailers | 97.3 | 97.1 | 90.3 | 98.6 | 97.9 | 98.9 | 101.2 | 100.7 | 92.2 | 105.2 | 105.6 | 114.4 | | D.2.2.13 IIP - Other transport equipment | 91.1 | 95.3 | 94.5 | 98.3 | 99.0 | 104.4 | 110.2 | 102.4 | 95.8 | 100.2 | 98.2 | 110.7 | | D.2.3 IIP - Electricity | 100.2 | 104.6 | 99.2 | 101.0 | 100.6 | 98.1 | 102.8 | 96.0 | 99.4 | 100.7 | 93.6 | 103.2 | | D.3 Cement Production | 104.9 | 104.0 | 99.6 | 97.3 | 90.6 | 91.9 | 98.5 | 91.6 | 101.9 | 106.1 | 101.1 | 112.6 | | D.4 Steel Production | 97.0 | 102.7 | 98.6 | 98.9 | 99.4 | 97.0 | 100.5 | 95.8 | 101.1 | 104.3 | 98.0 | 106.1 | | D.5 Coal Production | 90.7 | 93.0 | 88.5 | 84.8 | 84.4 | 83.0 | 97.7 | 103.7 | 113.3 | 117.1 | 110.3 | 134.0 | | D.6 Crude Oil Production | 98.8 | 100.8 | 98.9 | 101.3 | 101.4 | 98.3 | 102.3 | 99.5 | 102.4 | 101.3 | 92.5 | 102.4 | | D.7 Petroleum Refinery Production | 96.3 | 100.1 | 99.5 | 101.2 | 101.1 | 95.4 | 100.7 | 98.9 | 102.4 | 104.0 | 96.0 | 104.6 | | D.8 Fertiliser Production | 82.3 | 95.2 | 99.4 | 105.9 | 107.0 | 104.8 | 108.1 | 105.5 | 107.5 | 102.3 | 93.5 | 88.2 | | D.9 Natural Gas Production | 97.9 | 100.8 | 98.4 | 100.7 | 100.5 | 97.8 | 102.1 | 99.5 | 102.6 | 103.2 | 93.6 | 102.9 | | D.10 Production of Commercial Motor Vehicles | 94.1 | 94.5 | 90.0 | 97.0 | 98.4 | 100.4 | 99.6 | 101.2 | 95.1 | 106.3 | 105.2 | 117.2 | | E.1 Cargo handled at Major Ports | 99.7 | 103.6 | 96.1 | 98.5 | 97.9 | 92.8 | 98.7 | 99.3 | 102.6 | 104.8 | 96.4 | 108.8 | | E.2 Railway Freight Traffic | 97.5 | 100.8 | 96.5 | 97.9 | 95.4 | 93.4 | 98.5 | 98.3 | 104.0 | 106.6 | 98.1 | 112.9 | | E.3 Sales of Commercial Motor Vehicles | 85.0 | 90.0 | 96.3 | 93.8 | 95.5 | 106.6 | 99.6 | 95.4 | 99.2 | 104.4 | 104.3 | 128.3 | | E.4 Passenger flown (Km) - Domestic | 101.3 | 112.4 | 104.1 | 96.0 | 93.7 | 88.8 | 98.6 | 99.7 | 108.2 | 102.9 | 95.9 | 98.2 | | E.5 Passenger flown (Km) - International | 97.6 | 100.7 | 100.6 | 106.0 | 104.1 | 93.0 | 93.0 | 94.8 | 105.7 | 109.3 | 94.2 | 101.4 | | F.1 Exports | 97.4 | 100.3 | 100.1 | 100.1 | 98.0 | 101.8 | 98.0 | 93.1 | 101.6 | 99.9 | 95.9 | 113.4 | | F.2 Imports | 100.1 | 105.7 | 99.2 | 103.7 | 99.7 | 103.2 | 105.4 | 98.7 | 97.5 | 97.8 | 90.1 | 99.6 | | F.3 Non-Oil Non-Gold Imports | 96.9 | 104.6 | 102.0 | 102.4 | 99.4 | 101.7 | 105.2 | 102.0 | 102.3 | 99.4 | 88.8 | 95.7 | | 1 Seasonal factors: Deviation from 100 indicates presence of seasonality. For instance, seasonal factor of WPI- Fruits & vegetables increases during Oct(107.6) and decreases during Mar (89.8) indicating that fruits and vegetables exert price pressure in wholesale market during October and eases during March due to seasonal fluctuations. |
| Table 2: Range (Difference Between Peak and Trough) of Seasonal Factors | | Series/Year | 2006-07 | 2007-08 | 2008-09 | 2009-10 | 2010-11 | 2011-12 | 2012-13 | 2013-14 | 2014-15 | 2015-16 | Average Range | | 1 | 2 | 3 | 4 | 5 | 6 | 7 | 8 | 9 | 10 | 11 | 12 | | A.1.1 Broad Money (M3) | 3.3 | 3.2 | 3.0 | 2.7 | 2.4 | 2.1 | 2.0 | 1.9 | 1.8 | 1.7 | 2.4 | | A.1.1.1 Net Bank Credit to Government | 5.2 | 5.4 | 5.3 | 5.0 | 4.5 | 4.0 | 3.6 | 3.1 | 2.8 | 2.6 | 4.1 | | A.1.1.2 Bank Credit to Commercial Sector | 3.7 | 3.9 | 3.9 | 3.8 | 3.5 | 3.1 | 2.8 | 2.6 | 2.4 | 2.3 | 3.2 | | A.1.2 Narrow Money (M1) | 6.2 | 6.2 | 6.0 | 5.4 | 4.9 | 4.5 | 4.0 | 3.7 | 4.0 | 4.1 | 4.9 | | A.1.2.1 Currency with Public | 6.8 | 6.7 | 6.5 | 6.3 | 6.0 | 5.7 | 5.6 | 5.6 | 5.5 | 5.4 | 6.0 | | A.1.3 Reserve Money (RM) | 6.9 | 6.3 | 6.5 | 6.8 | 6.8 | 6.5 | 6.3 | 6.2 | 6.0 | 6.0 | 6.4 | | A.1.3.1 Currency in Circulation | 6.9 | 6.8 | 6.6 | 6.3 | 5.9 | 5.6 | 5.3 | 5.1 | 5.0 | 5.0 | 5.9 | | A.1.3.1.1 Notes in Circulation | 7.0 | 6.9 | 6.7 | 6.4 | 6.0 | 5.7 | 5.4 | 5.2 | 5.1 | 5.1 | 5.9 | | A.2.1 Aggregate Deposits (SCBs) | 3.2 | 3.1 | 2.9 | 2.6 | 2.3 | 1.9 | 1.7 | 1.6 | 1.4 | 1.3 | 2.2 | | A.2.1.1 Demand Deposits (SCBs) | 15.0 | 14.5 | 14.3 | 13.0 | 11.2 | 8.9 | 6.5 | 6.0 | 6.3 | 6.7 | 10.2 | | A.2.1.2 Time Deposits (SCBs) | 2.2 | 2.2 | 2.2 | 2.2 | 2.2 | 1.9 | 1.6 | 1.3 | 1.1 | 1.0 | 1.8 | | A.3.1 Cash in Hand and Balances with RBI (SCBs) | 12.7 | 11.2 | 9.8 | 7.7 | 5.7 | 4.6 | 3.5 | 4.0 | 4.2 | 4.2 | 6.8 | | A.3.2 Assets with the Banking System (SCBs) | 16.2 | 17.7 | 19.1 | 20.3 | 21.3 | 21.2 | 19.7 | 17.5 | 15.7 | 14.5 | 18.3 | | A.3.3 Bank Credit (SCBs) | 4.1 | 4.6 | 4.7 | 4.3 | 3.8 | 3.2 | 2.8 | 2.7 | 2.6 | 2.5 | 3.5 | | A.3.3.1 Loans, Cash, Credits and Overdrafts (SCBs) | 5.0 | 4.8 | 4.5 | 4.4 | 4.3 | 4.2 | 4.1 | 4.0 | 3.8 | 3.6 | 4.3 | | A.3.3.2 Non-Food Credit (SCBs) | 3.8 | 4.2 | 4.5 | 4.5 | 4.1 | 3.6 | 3.1 | 2.8 | 2.5 | 2.4 | 3.5 | | A.3.4 Investments (SCBs) | 3.8 | 4.1 | 4.5 | 4.7 | 4.8 | 4.6 | 4.4 | 4.1 | 3.8 | 3.5 | 4.2 | | B. WPI (Base 2004-05=100) All Commodities | 1.8 | 1.9 | 1.8 | 1.6 | 1.4 | 1.5 | 1.8 | 2.1 | 2.3 | 2.4 | 1.9 | | B.1 WPI - Primary Articles | 4.3 | 4.2 | 4.0 | 3.7 | 3.6 | 4.0 | 4.4 | 5.0 | 5.4 | 5.6 | 4.4 | | B.1.1 WPI - Food Articles | 5.7 | 5.9 | 6.1 | 6.2 | 6.2 | 6.2 | 6.5 | 6.6 | 6.5 | 6.4 | 6.2 | | B.1.1.1 WPI - Food Grains (Cereals+Pulses) | 2.2 | 2.4 | 2.4 | 2.3 | 2.3 | 2.5 | 2.6 | 2.6 | 2.6 | 2.7 | 2.5 | | B.1.1.1.1 WPI - Cereals | 1.8 | 1.8 | 1.8 | 1.7 | 1.7 | 1.7 | 1.8 | 1.8 | 1.7 | 1.7 | 1.8 | | B.1.1.1.1.1 WPI - Wheat | 4.4 | 4.1 | 3.8 | 3.5 | 3.4 | 3.7 | 4.1 | 4.2 | 4.4 | 4.7 | 4.0 | | B.1.1.1.1.2 WPI - Rice | 1.5 | 1.4 | 1.6 | 1.9 | 2.4 | 2.9 | 3.3 | 3.5 | 3.6 | 3.5 | 2.6 | | B.1.1.1.2 WPI - Pulses | 6.0 | 6.0 | 5.7 | 5.4 | 5.2 | 5.1 | 5.4 | 5.8 | 6.2 | 6.2 | 5.7 | | B.1.1.2 WPI - Fruits & Vegetables | 18.8 | 18.5 | 17.9 | 17.3 | 17.1 | 17.5 | 19.1 | 20.2 | 21.6 | 22.1 | 19.0 | | B.1.1.3 WPI - Milk | 0.7 | 0.5 | 0.4 | 0.6 | 1.0 | 1.3 | 1.5 | 1.5 | 1.4 | 1.3 | 1.0 | | B.1.1.4 WPI - Egg, Meat and Fish | 4.6 | 3.9 | 3.0 | 2.5 | 3.0 | 3.2 | 2.6 | 2.3 | 2.4 | 2.3 | 3.0 | | B.1.1.4.1 WPI - Egg | 11.4 | 10.4 | 9.6 | 9.3 | 10.1 | 11.7 | 13.2 | 14.3 | 15.1 | 15.7 | 12.1 | | B.1.1.4.2 WPI - Meat | 3.8 | 2.9 | 2.0 | 1.5 | 1.4 | 1.7 | 2.4 | 3.5 | 4.4 | 4.8 | 2.8 | | B.1.1.4.3 WPI - Fish | 7.6 | 5.9 | 4.8 | 3.8 | 4.4 | 4.7 | 4.4 | 3.5 | 2.9 | 2.9 | 4.5 | | B.1.1.5 WPI - Protein Items (viz., Pulses, Milk, Egg, Meat and Fish) Group | 1.9 | 1.9 | 2.0 | 2.2 | 2.4 | 2.5 | 2.3 | 1.9 | 1.6 | 1.4 | 2.0 | | B.1.2 WPI - Non-Food Articles | 2.7 | 2.8 | 2.4 | 2.7 | 3.0 | 3.0 | 2.7 | 1.9 | 1.4 | 1.3 | 2.4 | | B.1.2.1 WPI - Fibres | 5.2 | 5.5 | 5.3 | 4.9 | 4.4 | 4.3 | 4.4 | 4.5 | 4.3 | 4.0 | 4.7 | | B.1.2.1.1 WPI - Raw Cotton | 7.9 | 7.7 | 7.4 | 6.7 | 6.1 | 5.8 | 5.8 | 6.0 | 6.1 | 6.2 | 6.6 | | B.1.2.2 WPI - Oil Seeds | 3.1 | 3.0 | 3.2 | 3.4 | 3.7 | 3.9 | 4.0 | 4.1 | 4.4 | 4.5 | 3.7 | | B.2 WPI - Manufactured Products | 1.3 | 1.3 | 1.2 | 1.1 | 0.9 | 0.7 | 0.5 | 0.5 | 0.5 | 0.6 | 0.9 | | B.2.1 WPI - Food Products | 1.2 | 1.0 | 0.9 | 1.2 | 1.2 | 1.4 | 1.6 | 1.8 | 1.8 | 1.7 | 1.4 | | B.2.1.1 WPI - Grain Mill Products | 3.8 | 3.4 | 3.2 | 3.0 | 3.0 | 2.8 | 2.6 | 2.4 | 2.2 | 2.2 | 2.9 | | B.2.1.2 WPI - Sugar | 2.2 | 2.8 | 3.8 | 4.7 | 5.0 | 5.0 | 4.2 | 3.4 | 2.6 | 1.9 | 3.6 | | B.2.1.3 WPI - Edible Oils | 2.1 | 2.1 | 2.0 | 1.9 | 1.7 | 1.4 | 1.1 | 0.9 | 0.7 | 0.6 | 1.4 | | B.3 WPI - Non Food Manufactured Products | 1.1 | 1.1 | 1.2 | 1.1 | 1.0 | 0.9 | 0.7 | 0.6 | 0.5 | 0.5 | 0.9 | | B.4 WPI - Non Food Non-Fuel | 1.4 | 1.6 | 1.8 | 1.8 | 1.6 | 1.2 | 0.8 | 0.6 | 0.8 | 1.0 | 1.3 | | C.1 Consumer Price Index for Industrial Workers (2001=100) | 2.1 | 2.2 | 2.3 | 2.3 | 2.3 | 2.3 | 2.3 | 2.4 | 2.4 | 2.4 | 2.3 | | C.2 Consumer Price Index for Agricultural Labourers (Base: 1986-87=100) | 2.2 | 2.2 | 2.2 | 2.2 | 2.3 | 2.2 | 2.3 | 2.6 | 2.7 | 2.8 | 2.4 | | C.3 Consumer Price Index for Rural Labourers (Base: 1986-87=100) | 2.1 | 2.1 | 2.2 | 2.2 | 2.2 | 2.2 | 2.3 | 2.4 | 2.5 | 2.6 | 2.3 |
| Table 2: Range (Difference Between Peak and Trough) of Seasonal Factors (Concld.) | | Series/Year | 2006-07 | 2007-08 | 2008-09 | 2009-10 | 2010-11 | 2011-12 | 2012-13 | 2013-14 | 2014-15 | 2015-16 | Average Range | | 1 | 2 | 3 | 4 | 5 | 6 | 7 | 8 | 9 | 10 | 11 | 12 | | D. IIP (Base 2004-05 = 100) General Index | 14.1 | 13.8 | 14.1 | 14.4 | 14.5 | 14.7 | 14.6 | 14.4 | 14.1 | 14.0 | 14.3 | | D.1.1 IIP - Basic Goods Industries | 13.2 | 13.8 | 14.2 | 14.5 | 14.5 | 14.2 | 13.6 | 12.9 | 12.1 | 11.6 | 13.5 | | D.1.2 IIP - Intermediate Goods Industries | 10.1 | 10.0 | 9.7 | 9.3 | 9.0 | 8.8 | 8.6 | 8.6 | 8.5 | 8.4 | 9.1 | | D.1.3 IIP - Consumer Goods Industries | 15.3 | 14.7 | 14.9 | 15.4 | 16.2 | 17.5 | 18.6 | 19.3 | 19.4 | 19.3 | 17.1 | | D.1.3.1 IIP - Consumer Durable Goods Industries | 13.0 | 11.9 | 10.1 | 10.4 | 11.7 | 13.9 | 15.4 | 16.5 | 16.8 | 16.9 | 13.7 | | D.1.3.1 IIP - Consumer Non-Durable Goods Industries | 23.2 | 23.8 | 24.6 | 25.1 | 25.8 | 26.0 | 26.5 | 26.8 | 27.1 | 27.1 | 25.6 | | D.2.1 IIP - Mining | 23.9 | 25.0 | 25.8 | 26.4 | 26.8 | 27.1 | 27.0 | 26.5 | 25.7 | 25.2 | 25.9 | | D.2.2 IIP - Manufacturing | 14.7 | 14.3 | 13.8 | 14.1 | 14.5 | 15.0 | 15.1 | 15.1 | 14.9 | 14.8 | 14.6 | | D.2.2.1 IIP - Food products and beverages* | 67.6 | 66.5 | 65.4 | 64.7 | 64.1 | 64.9 | 66.3 | 67.5 | 68.1 | 68.0 | 66.3 | | D.2.2.2 IIP - Textiles* | 7.8 | 7.6 | 7.5 | 7.4 | 7.6 | 7.5 | 7.0 | 6.1 | 5.3 | 4.7 | 6.8 | | D.2.2.3 IIP - Wood and products of wood & cork except furniture; articles of straw & plating materials* | 21.0 | 20.3 | 19.6 | 18.8 | 18.3 | 17.6 | 16.8 | 15.8 | 15.6 | 15.5 | 17.9 | | D.2.2.4 IIP - Paper and paper products* | 11.1 | 11.0 | 10.6 | 10.1 | 9.6 | 9.3 | 9.0 | 8.7 | 8.4 | 8.4 | 9.6 | | D.2.2.5 IIP - Publishing, printing & reproduction of recorded media* | 8.6 | 8.5 | 8.5 | 8.5 | 8.6 | 8.6 | 8.6 | 8.6 | 8.7 | 8.8 | 8.6 | | D.2.2.6 IIP - Coke, refined petroleum products & nuclear fuel* | 11.0 | 10.7 | 10.9 | 11.0 | 11.0 | 11.1 | 11.5 | 11.8 | 12.2 | 12.8 | 11.4 | | D.2.2.7 IIP - Chemicals and chemical products* | 10.0 | 10.4 | 10.4 | 10.2 | 9.4 | 8.6 | 8.5 | 8.7 | 8.9 | 8.6 | 9.4 | | D.2.2.8 IIP - Rubber and plastics products* | 9.0 | 9.3 | 9.7 | 10.3 | 11.0 | 11.8 | 12.2 | 12.5 | 12.6 | 12.9 | 11.1 | | D.2.2.9 IIP - Other non-metallic mineral products* | 16.4 | 16.7 | 17.2 | 17.7 | 18.0 | 18.2 | 17.9 | 17.5 | 16.9 | 16.5 | 17.3 | | D.2.2.10 IIP - Basic metals* | 10.8 | 10.7 | 10.5 | 10.1 | 10.4 | 10.4 | 9.8 | 9.0 | 8.5 | 8.7 | 9.9 | | D.2.2.11 IIP - Fabricated metal products, except machinery & equipment* | 42.1 | 44.5 | 47.3 | 50.1 | 51.6 | 51.3 | 49.4 | 47.0 | 44.7 | 43.0 | 47.1 | | D.2.2.12 IIP - Motor vehicles, trailers & semi-trailers* | 26.2 | 26.2 | 26.3 | 26.4 | 26.0 | 24.8 | 23.3 | 21.9 | 20.5 | 19.5 | 24.1 | | D.2.2.13 IIP - Other transport equipment* | 23.7 | 22.8 | 21.2 | 20.5 | 20.2 | 20.0 | 19.6 | 19.5 | 19.2 | 19.2 | 20.6 | | D.2.3 IIP - Electricity | 9.8 | 10.3 | 10.6 | 11.1 | 10.9 | 10.9 | 11.6 | 12.3 | 12.8 | 13.0 | 11.3 | | D.3 Cement Production | 21.2 | 21.4 | 21.9 | 22.4 | 22.7 | 23.2 | 22.8 | 22.3 | 21.6 | 21.1 | 22.1 | | D.4 Steel Production | 11.6 | 10.6 | 10.2 | 10.7 | 10.8 | 10.8 | 10.7 | 10.6 | 11.0 | 11.8 | 10.9 | | D.5 Coal Production | 46.3 | 49.0 | 50.6 | 52.3 | 54.2 | 55.3 | 54.5 | 51.9 | 49.2 | 48.3 | 51.1 | | D.6 Crude Oil Production | 10.0 | 10.0 | 9.9 | 10.2 | 10.5 | 10.6 | 10.4 | 10.2 | 9.9 | 10.0 | 10.2 | | D.7 Petroleum Refinery Production | 8.8 | 8.6 | 8.1 | 8.7 | 9.8 | 10.7 | 11.1 | 10.8 | 10.4 | 9.8 | 9.7 | | D.8 Fertiliser Production* | 27.0 | 26.4 | 26.0 | 25.8 | 26.1 | 26.1 | 26.1 | 25.8 | 25.2 | 24.4 | 25.9 | | D.9 Natural Gas Production* | 9.8 | 9.8 | 9.8 | 9.7 | 9.7 | 9.8 | 9.9 | 9.9 | 9.9 | 9.9 | 9.8 | | D.10 Production of Commercial Motor Vehicles | 28.7 | 28.7 | 29.0 | 29.4 | 29.0 | 27.7 | 26.2 | 25.6 | 24.7 | 23.9 | 27.3 | | E.1 Cargo handled at Major Ports | 18.2 | 17.8 | 17.3 | 16.7 | 16.1 | 15.4 | 14.9 | 14.5 | 14.4 | 14.4 | 16.0 | | E.2 Railway Freight Traffic | 21.2 | 21.5 | 21.3 | 21.0 | 20.4 | 19.8 | 18.9 | 17.9 | 17.0 | 16.3 | 19.5 | | E.3 Sales of Commercial Motor Vehicles | 50.4 | 47.6 | 45.2 | 43.3 | 41.9 | 41.0 | 40.8 | 41.1 | 41.1 | 40.9 | 43.3 | | E.4 Passenger flown (Km) - Domestic | 21.1 | 22.7 | 23.8 | 25.3 | 25.8 | 25.8 | 24.6 | 23.3 | 22.0 | 21.2 | 23.6 | | E.5 Passenger flown (Km) - International | 18.3 | 16.6 | 17.1 | 16.7 | 14.7 | 15.8 | 17.3 | 18.6 | 19.0 | 19.0 | 17.3 | | F.1 Exports | 22.0 | 20.0 | 19.6 | 20.0 | 21.4 | 22.3 | 22.0 | 20.5 | 18.7 | 17.2 | 20.4 | | F.2 Imports | 22.6 | 22.1 | 20.4 | 17.3 | 14.7 | 13.1 | 12.1 | 12.1 | 12.5 | 13.2 | 16.0 | | F.3 Non-Oil Non-Gold Imports | 23.9 | 25.0 | 24.2 | 20.8 | 17.5 | 14.7 | 12.6 | 13.4 | 14.4 | 14.7 | 18.1 | | * Seasonal adjustment for these series is based on 10 years data depending on availability. Guidelines of both, Office of National Statistics (ONS), UK, and US Census Bureau, however, suggest using more than ten years data for estimating stable monthly seasonal factors. |
| Table 3: Change in seasonal variation in 2015-16 vis-à-vis previous 5-years (2010-11 to 2014-15) | | Name of Variable | 2015-16 | Average Range* | Change | Name of Variable | 2015-16 | Average Range* | Change | | 1 | 2 | 3 | 4 | 1 | 2 | 3 | 4 | | A.1.1 Broad Money (M3) | 1.7 | 2.0 | -0.3 | C.1 Consumer Price Index for Industrial Workers (Base: 2001=100) | 2.4 | 2.3 | 0.1 | | A.1.1.1 Net Bank Credit to Government | 2.6 | 3.6 | -1.0 | C.2 Consumer Price Index for Agricultural Labourers (Base: 1986-87=100) | 2.8 | 2.4 | 0.4 | | A.1.1.2 Bank Credit to Commercial Sector | 2.3 | 2.9 | -0.6 | C.3 Consumer Price Index for Rural Labourers (Base: 1986-87=100) | 2.6 | 2.3 | 0.3 | | A.1.2 Narrow Money (M1) | 4.1 | 4.2 | -0.1 | D.IIP (Base: 2004-05=100) General Index | 14.0 | 14.5 | -0.5 | | A.1.2.1 Currency with Public | 5.4 | 5.7 | -0.2 | D.1.1 IIP - Basic Goods Industries | 11.6 | 13.5 | -1.9 | | A.1.3 Reserve Money (RM) | 6.0 | 6.4 | -0.3 | D.1.2 IIP - Intermediate Goods Industries | 8.4 | 8.7 | -0.3 | | A.1.3.1 Currency in Circulation | 5.0 | 5.4 | -0.4 | D.1.3 IIP - Consumer Goods Industries | 19.3 | 18.2 | 1.1 | | A.1.3.1.1 Notes in Circulation | 5.1 | 5.5 | -0.4 | D.1.3.1 IIP - Consumer Durable Goods Industries | 16.9 | 14.9 | 2.0 | | A.2.1 Aggregate Deposits (SCBs) | 1.3 | 1.8 | -0.5 | D.1.3.2 IIP - Consumer Non-Durable Goods Industries | 27.1 | 26.4 | 0.7 | | A.2.1.1 Demand Deposits (SCBs) | 6.7 | 7.8 | -1.1 | D.2.1 IIP - Mining | 25.2 | 26.6 | -1.5 | | A.2.1.2 Time Deposits (SCBs) | 1.0 | 1.6 | -0.6 | D.2.2 IIP - Manufacturing | 14.8 | 14.9 | -0.1 | | A.3.1 Cash in Hand and Balances with RBI (SCBs) | 4.2 | 4.4 | -0.1 | D.2.2.1 IIP - Food products and beverages | 68.0 | 66.2 | 1.8 | | A.3.2 Assets with the Banking System (SCBs) | 14.5 | 19.1 | -4.6 | D.2.2.2 IIP - Textiles | 4.7 | 6.7 | -2.0 | | A.3.3 Bank Credit (SCBs) | 2.5 | 3.0 | -0.5 | D.2.2.3 IIP - Wood and products of wood & cork except furniture; articles of straw & plating materials | 15.5 | 16.8 | -1.3 | | A.3.3.1 Loans, Cash, Credits and Overdrafts (SCBs) | 3.6 | 4.1 | -0.4 | D.2.2.4 IIP - Paper and paper products | 8.4 | 9.0 | -0.5 | | A.3.3.2 Non-Food Credit (SCBs) | 2.4 | 3.2 | -0.8 | D.2.2.5 IIP - Publishing, printing & reproduction of recorded media | 8.8 | 8.6 | 0.2 | | A.3.4 Investments (SCBs) | 3.5 | 4.3 | -0.8 | D.2.2.6 IIP - Coke, refined petroleum products & nuclear fuel | 12.8 | 11.5 | 1.2 | | B. WPI (BASE 2004-05=100) All Commodities | 2.4 | 1.8 | 0.6 | D.2.2.7 IIP - Chemicals and chemical products | 8.6 | 8.8 | -0.2 | | B.1 WPI - Primary Article | 5.6 | 4.5 | 1.1 | D.2.2.8 IIP - Rubber and plastics products | 12.9 | 12.0 | 0.9 | | B.1.1 WPI - Food Articles | 6.4 | 6.4 | 0.0 | D.2.2.9 IIP - Other non-metallic mineral products | 16.5 | 17.7 | -1.2 | | B.1.1.1 WPI - Food Grains (Cereals+Pulses) | 2.7 | 2.5 | 0.1 | D.2.2.10 IIP - Basic metals | 8.7 | 9.6 | -0.9 | | B.1.1.1.1 WPI - Cereals | 1.7 | 1.8 | 0.0 | D.2.2.11 IIP - Fabricated metal products, except machinery & equipment | 43.0 | 48.8 | -5.8 | | B.1.1.1.1.1 WPI - Wheat | 4.7 | 4.0 | 0.7 | D.2.2.12 IIP - Motor vehicles, trailers & semi-trailers | 19.5 | 23.3 | -3.8 | | B.1.1.1.1.2 WPI - Rice | 3.5 | 3.1 | 0.3 | D.2.2.13 IIP - Other transport equipment | 19.2 | 19.7 | -0.5 | | B.1.1.1.2 WPI - Pulses | 6.2 | 5.5 | 0.7 | D.2.3 IIP - Electricity | 13.0 | 11.7 | 1.3 | | B.1.1.2 WPI - Fruits & Vegetables | 22.1 | 19.1 | 3.0 | D.3 Cement Production | 21.1 | 22.5 | -1.4 | | B.1.1.3 WPI - Milk | 1.3 | 1.4 | -0.1 | D.4 Steel Production | 11.8 | 10.8 | 1.0 | | B.1.1.4 WPI - Egg, Meat and Fish | 2.3 | 2.7 | -0.4 | D.5 Coal Production | 48.3 | 53.0 | -4.7 | | B.1.1.4.1 WPI - Egg | 15.7 | 12.9 | 2.8 | D.6 Crude Oil Production | 10.0 | 10.3 | -0.3 | | B.1.1.4.2 WPI - Meat | 4.8 | 2.7 | 2.1 | D.7 Petroleum Refinery Production | 9.8 | 10.6 | -0.7 | | B.1.1.4.3 WPI - Fish | 2.9 | 4.0 | -1.1 | D.8 Fertiliser Production | 24.4 | 25.9 | -1.4 | | B.1.1.5 WPI - Protein Items (viz., Pulses, Milk, Egg, Meat and Fish) | 1.4 | 2.1 | -0.7 | D.9 Natural Gas Production | 9.9 | 9.8 | 0.1 | | B.1.2 WPI - Non-Food Articles | 1.3 | 2.4 | -1.0 | D.10 Production of Commercial Motor Vehicles | 23.9 | 26.6 | -2.8 | | B.1.2.1 WPI - Fibres | 4.0 | 4.4 | -0.4 | E.1 Cargo handled at Major Ports | 14.4 | 15.1 | -0.7 | | B.1.2.1.1 WPI - Raw Cotton | 6.2 | 6.0 | 0.2 | E.2 Railway Freight Traffic | 16.3 | 18.8 | -2.5 | | B.1.2.2 WPI - Oil Seeds | 4.5 | 4.0 | 0.5 | E.3 Sales of Commercial Motor Vehicles | 40.9 | 41.1 | -0.3 | | B.2 WPI - Manufactured Products | 0.6 | 0.6 | -0.1 | E.4 Passenger flown (Km) - Domestic | 21.2 | 24.3 | -3.1 | | B.2.1 WPI - Food Products | 1.7 | 1.5 | 0.2 | E.5 Passenger flown (Km) - International | 19.0 | 17.1 | 1.9 | | B.2.1.1 WPI - Grain Mill Products | 2.2 | 2.6 | -0.4 | F.1 Exports | 17.2 | 21.0 | -3.8 | | B.2.1.2 WPI - Sugar | 1.9 | 4.0 | -2.1 | F.2 Imports | 13.2 | 12.9 | 0.3 | | B.2.1.3 WPI - Edible Oils | 0.6 | 1.1 | -0.5 | F.3 Non-oil Non-Gold Imports | 14.7 | 14.5 | 0.2 | | B.3 WPI - Non Food Manufactured Products | 0.5 | 0.7 | -0.2 | | | | | | B.4 WPI - Non Food Non-Fuel | 1.0 | 1.0 | 0.0 | | | | | | *Average Range of Monthly Seasonal Factors for the last 5-years (2010-11 to 2014-15). |
| Table 4: List of Top-Twenty and Bottom-Twenty Series based on Average Range of Monthly Seasonal Factors during Last Five Years (2011-12 to 2015-16) and corresponding Peak and Trough Months | | Name of Top-Twenty Series | Average Range | Peak Month | Trough Month | Name of Bottom-Twenty Series | Average Range | Peak Month | Trough Month | | 1 | 2 | 3 | 4 | 5 | 6 | 7 | 8 | | D.2.2.1 IIP - Food products and beverages | 67.0 | Jan | Sep | A.1.1.2 Bank Credit to Commercial Sector | 2.6 | Mar | Sep | | D.5 Coal Production | 51.8 | Mar | Sep | B.1.1.1 WPI - Food Grains (Cereals+Pulses) | 2.6 | Oct | May | | D.2.2.11 IIP - Fabricated metal products, except machinery & equipment | 47.1 | Mar | Apr | B.1.1.4 WPI - Egg, Meat and Fish | 2.6 | Feb | Apr | | E.3 Sales of Commercial Motor Vehicles | 40.9 | Mar | Apr | C.2 Consumer Price Index for Agricultural Labourers (Base: 1986-87=100) | 2.5 | Oct | Mar | | D.1.3.2 IIP - Consumer Non-Durable Goods Industries | 26.7 | Dec | Oct | B.2.1.1 WPI - Grain Mill Products | 2.5 | Jan | May | | D.2.1 IIP - Mining | 26.3 | Mar | Sep | C.3 Consumer Price Index for Rural Labourers (Base: 1986-87=100) | 2.4 | Oct | Mar | | D.10 Production of Commercial Motor Vehicles | 25.6 | Mar | Jun | C.1 Consumer Price Index for Industrial Workers (Base: 2001=100) | 2.4 | Oct | Mar | | D.8 Fertiliser Production | 25.5 | Oct | Apr | B.1.2 WPI - Non-Food Articles | 2.1 | Apr | Oct | | E.4 Passenger flown (Km) - Domestic | 23.4 | May | Sep | B. WPI (Base: 2004-05=100) All Commodities | 2.0 | Sep | Feb | | D.3 Cement Production | 22.2 | Mar | Nov | B.1.1.5 WPI - Protein Items (viz., Pulses, Milk, Egg, Meat and Fish) Group | 1.9 | Sep | Apr | | D.2.2.12 IIP - Motor vehicles, trailers & semi-trailers | 22.0 | Mar | Jun | A.1.1 Broad Money (M3) | 1.9 | Apr | Sep | | F.1 Exports | 20.1 | Mar | Nov | B.1.1.1.1 WPI - Cereals | 1.8 | Oct | May | | B.1.1.2 WPI - Fruits & Vegetables | 20.1 | Sep | Mar | B.2.1 WPI - Food Products | 1.6 | Oct | Mar | | D.2.2.13 IIP - Other transport equipment | 19.5 | Mar | Apr | A.2.1 Aggregate Deposits (SCBs) | 1.6 | Apr | Sep | | D.1.3 IIP - Consumer Goods Industries | 18.8 | Mar | Aug | B.1.1.3 WPI - Milk | 1.4 | Jul | Apr | | E.2 Railway Freight Traffic | 18.0 | Mar | Sep | A.2.1.2 Time Deposits (SCBs) | 1.4 | Apr | Sep | | E.5 Passenger flown (Km) - International | 17.9 | Jan | Sep | B.2.1.3 WPI - Edible Oils | 0.9 | Aug | Oct | | A.3.2 Assets with the Banking System (SCBs) | 17.7 | Mar | Nov | B.4 WPI - Non Food Non-Fuel | 0.9 | May | Dec | | D.2.2.9 IIP - Other non-metallic mineral products | 17.4 | Mar | Nov | B.3 WPI - Non Food Manufactured Products | 0.7 | Apr | Dec | | D.2.2.3 IIP - Wood and products of wood & cork except furniture; articles of straw & plating materials | 16.2 | Dec | Apr | B.2 WPI - Manufactured Products | 0.6 | May | Dec |
* Prepared in the Modeling and Forecasting Division of the Department of Statistics and Information Management, Reserve Bank of India. 1 The previous article in the series was published in September 2015 issue of the Reserve Bank of India, Bulletin. 2 http://www.census.gov/srd/www/x13as/ @Trading-day effects occur when a series is affected by the differing day-of-the- week compositions of the same calendar month in different years. 3 Seasonal fluctuation has been regressed over time and the significance of the estimated time coefficient along with sign of the coefficient has been checked. |