This article, based on the Union Budget 2016-17 presented to the Parliament on February 29, 2016, analyses the key features of the Budget and makes an assessment of the likely fiscal situation in 2016-17. The Budget was presented against a backdrop of deceleration in global growth, turbulent financial markets and shrinking global trade. In this milieu, the Budget has factored in the challenges arising from the global slowdown and the looming fiscal burden from implementation of pay commission/one rank one pension (OROP) by setting its priorities on transforming India through a nine pillar-pronged strategy while accelerating structural reforms and placing the economy on a higher growth trajectory. Union Budget 2016-17: Highlights • Budgeted targets for the revenue deficit (RD) and gross fiscal deficit (GFD) for 2015-16 were met through a combination of higher tax and non-tax revenue and lower non-plan capital expenditure. • The commitment to fiscal consolidation is set to lower the GFD by 0.4 percentage points of GDP in 2016-17 (BE) marking a stepped-up pace of fiscal adjustment and imparting credibility to the achievement of the target of 3.0 per cent for 2017- 18 under the amended FRBM rules. • The growth in revenue expenditure is set to accelerate in 2016-17, reflecting provisions made for implementation of the seventh central pay commission (CPC VII) and one rank one pension (OROP) in defence services. Central government’s expenditure on pensions is budgeted to grow by 28.9 per cent as against 2.3 per cent in 2015-16 (RE). • In continuation of the process of subsidy reforms, expenditure on major subsidies is estimated to reduce to 1.5 per cent of GDP in 2016-17 from 1.8 per cent of GDP in 2015-16 (RE). • Growth of capital expenditure is budgeted to decelerate sharply to 3.9 per cent in 2016-17 with capital outlay (excluding defence) estimated to grow at a modest rate of 2.3 per cent. • Notwithstanding the shortfall in achieving the targets set in the past, including in 2015-16 (about 64 per cent), aggregate disinvestment receipts are budgeted to grow by 123.2 per cent in 2016-17. • The Union Budget 2016-17 strives to balance growth-stimulating investment thrust and structural reforms with more empowering federalism. Rationalisation of duties and tax structuring, the introduction of the goods and services tax (GST), better targeting of subsidies and robust efforts to step up disinvestment hold the key to enriching the quality and sustainability of central finances. The major policy initiatives proposed in the Budget are highlighted in Box 1. I. Fiscal Performance in 2015-16 (Revised Estimates) Revised estimates meet fiscal targets without compromising expenditure Revised estimates (RE) show that the budgeted targets of RD and GFD as per cent of GDP for 2015-16 were met through a combination of higher tax and non-tax revenue and lower non-plan capital expenditure. As proportion to GDP, RD at 2.5 per cent was 0.3 percentage points lower than the Budget estimate, while GFD adhered to the budgeted target of 3.9 per cent of GDP (Chart 1). This reduction in RD, despite maintaining the revenue expenditure around the budgeted target, was achieved through higher than budgeted tax and non-tax revenues. Box 1: Union Budget 2016-17- Policy Initiatives The nine pillars of development strategy announced in the Budget are: (i) Agriculture and Farmers’ Welfare with focus on doubling farmers’ income in five years; (ii) Rural Sector with emphasis on rural employment and infrastructure; (iii) Social Sector including Healthcare to cover all under welfare and health services; (iv) Education, Skills and Job Creation to make India a knowledge based and productive society; (v) Infrastructure and Investment to enhance efficiency and quality of life; (vi) Financial Sector Reforms to bring transparency and stability; (vii) Governance and Ease of Doing Business to enable the people to realise their full potential; (viii) Fiscal Discipline - prudent management of government finances and delivery of benefits to the needy; and (ix) Tax Reforms to reduce compliance burden with faith in the citizenry. The nine different pillars can be categorized under three broad areas as follows: I. Fiscal Discipline The fiscal deficit target in RE 2015-16 and BE 2016-17 have been retained at 3.9 per cent and 3.5 per cent of GDP, respectively; (ii) Plan-Non-Plan classification will be done away with from fiscal 2017-18 to give greater focus to Revenue and Capital classification of government expenditure; (iii) quality of government expenditure to improve with every new scheme being sanctioned by government to have a sunset date and outcome review; (iv) the working of the FRBM Act to be reviewed; (v) incentivise domestic value addition to help Make in India; (vi) additional resource mobilization for agriculture, rural economy and clean environment; and (vii) simplification and rationalization of taxation. II. Structural Reforms The major structural reform measures inter alia include (i) provision of ₹ 150 billion towards interest subvention for farmers; (ii) improving market access for farmers through a Unified Agricultural Marketing eplatform; (iii) digital literacy mission scheme to be launched for rural India; (iv) introduction of a new health protection scheme to provide health cover up to ₹ One lakh per family; (v) setting up a National Board for Skill Development Certification; (vi) ₹ 150 billion to be raised by NHAI through bonds; (vii) augment investment in nuclear power generation; (viii) NITI Aayog to identify the Public Sector Enterprises (PSEs) for strategic sale; (ix) 100 per cent FDI will be allowed through FIPB route in marketing of food products produced and manufactured in India; (x) bill will be introduced for targeted delivery of subsidies, benefits and services by using the Aadhar framework; (xi) DBT to be introduced on pilot basis for fertilizer in a few districts across the country; and (xii) Price Stabilisation Fund will be provided with a corpus of ₹ 9 billion to support market interventions. III. Financial Sector Reforms (i) The RBI Act 1934 would be amended to provide statutory basis for a Monetary Policy Framework and a Monetary Policy Committee; (ii) ₹ 250 billion to be allocated towards recapitalisation of public sector banks (PSBs); (iii) Bank Board Bureau will be operationalized during 2016-17 and a roadmap for consolidation of PSBs will be spelt out; (iv) bill on code on resolution of financial firms will be introduced; (v) necessary amendments in the SARFAESI Act 2002 to be made to enable the sponsor of an ARC to hold up to 100 per cent stake in the ARC and permit non-institutional investors to invest in Securitization Receipts; (vi) new derivative products will be developed by SEBI in the Commodity Derivatives market; (vii) RBI to facilitate retail participation in the primary and secondary markets through stock exchanges and access to NDS-OM trading platform to improve greater retail participation in government securities; (viii) SEBI Act 1992 will be amended to provide for more members and benches of the securities appellate tribunal; and (ix) general insurance companies owned by the government will be listed in the stock exchanges. 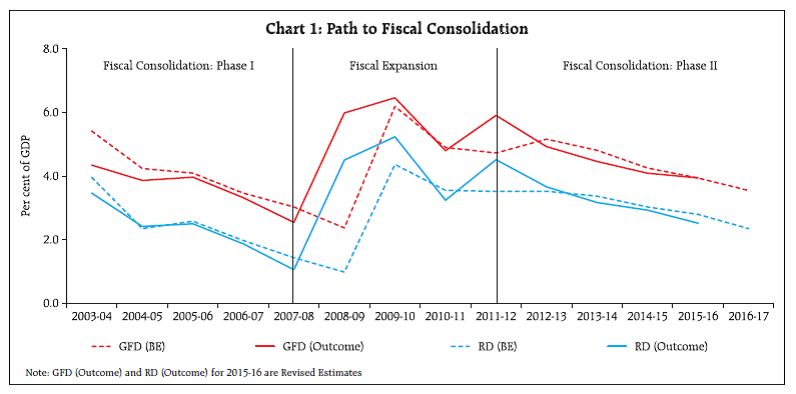 Both gross and net tax collections were marginally higher than their budgeted amounts on account of 8.6 per cent increase in indirect tax collections over the Budget estimate, notwithstanding the shortfall in direct tax revenues (Chart 2a). Within indirect taxes, revenues from Union excise duty were 23.6 per cent higher than budgeted and 49.6 per cent higher than in 2014-15 on account of additional revenue mobilisation (ARM) measures like frequent duty revisions on petrol and diesel. Illustratively, resources raised through ARM constituted around 15 per cent of indirect tax collections during 2015-16 as compared with about 5 per cent during 2014-15. As a result, the buoyancy of indirect taxes was significantly higher than in the previous year (Chart 2b). Non-tax revenue exceeded the budgetary targets by 16.6 per cent due to higher receipts from dividends and profits and improved earnings from spectrum auction. As a result, total non-debt receipts were marginally higher than budgeted despite 63.6 per cent shortfall in disinvestment proceeds. Realisation of the budgeted target for non-debt receipts allowed plan expenditure to exceed the budgeted target by 2.6 per cent. Non-plan expenditure was marginally lower than budgeted amount (by 0.3 per cent), with the non-plan capital expenditure bearing the brunt of adjustment. 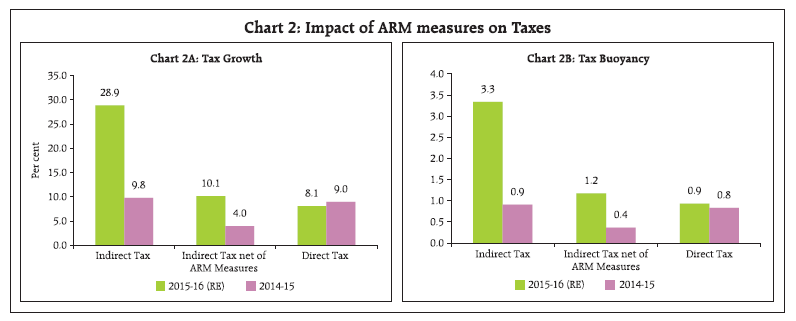 II. Budget Estimates for 2016-17 Committed to fiscal consolidation with a focus on revenue mobilisation The Budget estimates for 2016-17 depict commitment of the government to continue the process of fiscal consolidation with all key deficit indicators (relative to GDP) set to decline. The RD and GFD are budgeted to decline from 2015-16 (RE) by 0.2 percentage point and 0.4 percentage point, respectively, to 2.3 per cent and 3.5 per cent of GDP, respectively, in 2016-17 (BE) (Statement 1). The effective revenue deficit1 is estimated at 1.2 per cent of GDP – an improvement of 0.3 per cent of GDP over 2015-16 (RE). The expected reduction in GFD reflects the combined impact of an estimated increase in non-debt receipts, while making room for enhanced budgetary allocation for implementation of Seventh Pay Commission’s recommendations and OROP scheme. In accordance with the amended FRBM targets in 2015, a GFD of 3.0 per cent is projected to be achieved from 2017-18 onwards.2 II.1 Non-debt receipts Non-debt receipts to accelerate Non-debt receipts are estimated to grow by 15.5 per cent in 2016-17, reflecting robust growth in tax revenues, spectrum proceeds, dividends, and disinvestment receipts (Table 1). | Table 1: Fiscal Position of the Central Government | | | As Percentages to GDP | Growth Rate (Per cent) | | 2014-15 | 2015-16 (RE) | 2016-17 (BE) | 2014-15 | 2015-16 (RE) | 2016-17 (BE) | | 1 | 2 | 3 | 4 | 5 | 6 | 7 | | Receipts | | | | | | | | Revenue Receipts | 8.8 | 8.9 | 9.1 | 8.5 | 9.5 | 14.2 | | (i) Tax Revenue (Net) | 7.2 | 7.0 | 7.0 | 10.8 | 4.9 | 11.2 | | (ii) Non-Tax Revenue | 1.6 | 1.9 | 2.1 | -0.5 | 30.7 | 24.9 | | Non Debt Capital Receipts | 0.4 | 0.3 | 0.4 | 23.0 | -14.1 | 51.8 | | of which: Disinvestment receipts | 0.3 | 0.2 | 0.4 | 28.5 | -32.9 | 123.2 | | Expenditure | | | | | | | | Revenue Expenditure | 11.7 | 11.4 | 11.5 | 6.9 | 5.5 | 11.8 | | Capital Expenditure | 1.6 | 1.8 | 1.6 | 4.8 | 20.9 | 3.9 | | Total Expenditure | 13.3 | 13.2 | 13.1 | 6.7 | 7.3 | 10.8 | | Non Plan | 9.6 | 9.6 | 9.5 | 8.6 | 8.9 | 9.2 | | of which: | | | | | | | | 1. Interest Payments | 3.2 | 3.3 | 3.3 | 7.5 | 10.0 | 11.3 | | 2. Grants to States | 0.6 | 0.8 | 0.8 | 27.4 | 40.3 | 9.4 | | 3. Subsidies | 2.1 | 1.9 | 1.7 | 1.4 | -0.2 | -2.9 | | Plan | 3.7 | 3.5 | 3.7 | 2.1 | 3.1 | 15.3 | | 1. Central Plan | 1.5 | 1.9 | 2.0 | -43.7 | 36.1 | 18.0 | | 2. Central Assistance for state and UT plans | 2.2 | 1.6 | 1.6 | 140 | -20.2 | 11.9 | II.1.a Tax revenue Gross and net tax revenues are budgeted to grow by 11.7 per cent and 11.2 per cent, respectively, in 2016-17 although, as proportion to GDP, their respective shares are unchanged from the previous year. Direct and indirect taxes are budgeted to grow by 12.6 per cent and 10.8 per cent, respectively. Consequently, implicit buoyancy in direct taxes is higher while that in indirect taxes is lower than the realised level of last year reflective of the high base of indirect taxes realised in 2015-16 on account of ARM measures (Table 2). The tax measures announced in the Budget demonstrate the government’s intent on revenue side corrections by broadening the tax base for direct taxes and minimizing exemptions in a regime of moderate tax rates. II.1.b Non-Tax Revenue Non-tax revenues, which have experienced high growth in the last few years due to higher dividend payments from public sector enterprises (PSEs), PSU banks, the Reserve Bank of India and spectrum allocation charges, are budgeted to grow by 24.9 per cent in 2016-17 as against 30.7 per cent last year. Total dividends and profits from PSEs (including PSU banks) and surplus transferred by RBI to government are budgeted to grow by 4.7 per cent in 2016-17. Net receipts from communication services are budgeted at ₹ 990 billion in anticipation of revenue collections from spectrum auctions, licence fees and one time spectrum charges. The licenses issued 20 years ago are likely to come up for renewal in 2016-17. II.1.c Non-debt Capital Receipts Disinvestment proceeds are budgeted at ₹ 565 billion in 2016-17 of which resources to the tune of ₹ 205 billion are estimated to flow from strategic disinvestments3. Notwithstanding the shortfall in achieving the targets in the past, receipts from disinvestment are estimated to grow by 123.2 per cent in 2016-17. In view of this, non-debt capital receipts are estimated to grow by 51.8 per cent during the year. II.2 Total Expenditure Growth in expenditure to accelerate in 2016-17 Total expenditure of the central government is budgeted to grow by 10.8 per cent in 2016-17 as against 7.3 per cent in 2015-16 (RE) although it is 2.9 per cent higher than the medium term expenditure framework (MTEF) statement raising issues related to fiscal marksmanship (Box 2). The focus of the Budget is on enhancing expenditure in priority areas viz., farm and rural sector, social sector, infrastructure, employment generation and recapitalization of public sector banks. The Budget has identified the limited scope for further expenditure rationalization in view of higher committed components and persistent expenditure rationalization exercises carried out over the last few years. | Table 2 : Tax Buoyancy | | | Average Tax Buoyancy
(2008-09 to 2015-16) | Post Crisis Tax Buoyancy (2010-11 to 2015-16) | 2015-16
(Revised Estimates) | Budgeted Tax Buoyancy for 2016-17 | | 1 | 2 | 3 | 4 | 5 | | Gross Tax Revenue | 0.92 | 1.17 | 2.00 | 1.06 | | Corporation Tax | 0.81 | 0.78 | 0.65 | 0.82 | | Income Tax | 0.95 | 1.15 | 1.45 | 1.64 | | Customs Duty | 0.71 | 1.18 | 1.32 | 0.89 | | Union Excise Duty | 1.10 | 1.68 | 5.74 | 1.10 | | Service Tax | 1.55 | 1.88 | 2.90 | 0.91 | Box 2: Budget estimates vis-à-vis the MTEF Statement The Medium Term Expenditure Framework (MTEF) Statement, a FRBM document, was laid before the Parliament in August 2015. It presented a medium-term perspective on fiscal indicators and expenditure categories. A comparison of the Budget estimates with the MTEF reveals that pension expenditure is budgeted to be significantly higher than the MTEF, resulting in a cut back in other areas viz., capital expenditure, interest payments and fertilizer and petroleum subsidies (Table). | Table: Deviation in Budget Estimate from MTEF Statement | | (₹ Billion) | | Expenditure Items | 2016-17 | Difference | | Budget Estimate | Projection by MTEF | Amount | % | | 1 | 2 | 3 | 4 | 5 | | Revenue Expenditure | 17310.4 | 16604.8 | 705.7 | 4.2 | | of which | | | | | | (i) Interest | 4926.7 | 4960.0 | -33.3 | -0.7 | | (ii) Pension | 1233.7 | 1026.4 | 207.3 | 20.2 | | (iii) Major Subsidies | 2317.9 | 2390.0 | -72.1 | -3.0 | | a. Fertiliser | 700.0 | 750.0 | -50.0 | -6.7 | | b. Food | 1348.4 | 1320.0 | 28.4 | 2.2 | | c. Petroleum | 269.5 | 320.0 | -50.5 | -15.8 | | Capital Expenditure | 2470.2 | 2609.7 | -139.5 | -5.3 | | Total Expenditure | 19780.6 | 19214.4 | 566.2 | 2.9 | II.2.a Revenue Expenditure Revenue expenditure is estimated to grow by 11.8 per cent in 2016-17 reflecting the provisions made for implementation of CPC VII and OROP in defence services. Central government’s expenditure on pension is budgeted to grow by 28.9 per cent as against 2.3 per cent in 2015-16 (RE); in terms of GDP, expenditure on pension works out to 0.8 per cent in 2016-17 as compared with 0.7 per cent in 2015-16 (RE). In continuation of the process of subsidy reforms, expenditure on major subsidies viz., food, fuel and fertilizer is estimated to reduce to 1.5 per cent of GDP in 2016-17 from 1.8 per cent of GDP in 2015-16 (RE) (Table 3). The government is on track to further rationalize subsidy expenditure through various initiatives such as Direct Benefit Transfer (DBT), reform in LPG subsidies as well as in the fertilizer sector through the New Urea Policy. Given the anticipated expansion and full implementation of the National Food Security Act (NFSA) across all states, it is necessary to undertake reforms in order to increase efficiency of procurement and distribution system. | Table 3: Subsidies | | (₹ Billion) | | Items | 2014-15(Actual) | 2015-16 (BE) | 2015-16 (RE) | 2016-17 (BE) | | Amount | Per cent to GDP | Amount | Per cent to GDP | Amount | Per cent to GDP | Amount | Per cent to GDP | | 1 | 2 | 3 | 4 | 5 | 6 | 7 | 8 | 9 | | Total Subsidies | 2,583 | 2.1 | 2,438 | 1.7 | 2,578 | 1.9 | 2,504 | 1.7 | | i. Food | 1,177 | 0.9 | 1,244 | 0.9 | 1,394 | 1.0 | 1,348 | 0.9 | | ii. Fertiliser | 711 | 0.6 | 730 | 0.5 | 724 | 0.5 | 700 | 0.5 | | iii. Petroleum | 603 | 0.5 | 300 | 0.2 | 300 | 0.2 | 269 | 0.2 | | iv. Interest subsidy | 76 | 0.1 | 149 | 0.1 | 138 | 0.1 | 155 | 0.1 | | v. Other subsidies | 16 | 0.0 | 15 | 0.0 | 21 | 0.0 | 31 | 0.0 | II.2.b Capital Expenditure The growth in capital expenditure is budgeted to decelerate sharply to 3.9 per cent in 2016-17 with capital outlay (excluding defence) estimated to grow at a modest rate of 2.3 per cent (Chart 3). This is partly due to a base effect since non-defence capital outlay grew by 51.7 per cent in 2015-16 (RE) over 2014-15. As proportion to GDP, capital expenditure is estimated to decline to 1.6 per cent from 1.8 per cent in 2015-16 (RE). Capital expenditure on major infrastructure is estimated to grow by only 3.0 per cent in 2016-17 (BE). While capital expenditure on ‘roads and bridges’ is budgeted lower at ₹ 147.2 billion in 2016-17, revenue expenditure on the same has more than doubled to ₹ 549.4 billion. In line with the recapitalization path outlined by the government under the Indradhanush plan4, the Budget has allocated ₹ 250 billion for recapitalization of the PSBs. The Budget has also allowed additional extra budgetary resources of ₹ 313 billion to be mobilized by NHAI, PFC, REC, IERDA, NABARD and Inland Water Authority by raising bonds from the market. 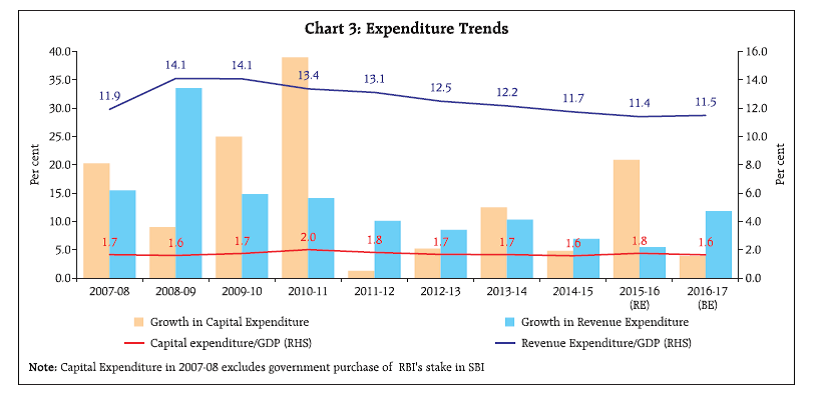 III. Resource Transfers to States States’ share in central taxes is budgeted to increase by 13 per cent in 2016-17 (BE) over and above a 50 per cent increase in 2015-16 (RE), pursuant to the recommendations by the Fourteenth Finance Commission for higher devolution of taxes5 (Table 4). Gross and net transfers, as ratios to GDP, are budgeted at 6.2 per cent and 6.1 per cent, respectively. Based on the recommendations of Sub-Group of Chief Ministers constituted under NITI Aayog, the government has decided that the funding of the core schemes6 will be retained as per the existing sharing pattern. The sharing pattern of the core schemes which form part of the National Development Agenda will be at 60:40 except for 8 North-Eastern and 3 Himalayan States for whom it has been kept at 90:10. The non-core schemes have been kept in the optional category with a sharing pattern of 50:50. | Table 4: Gross and Net Transfers from Centre to States | | (₹ billion) | | Items | 2014-15 | 2015-16 (BE) | 2015-16 (RE) | 2016-17 (BE) | | 1 | 2 | 3 | 4 | 5 | | 1. States' share in Central Taxes | 3,378.1 | 5,239.6 | 5,061.9 | 5,703.4 | | 2. Non-Plan Grants & Loans | 772.0 | 1,086.3 | 1,083.1 | 1,184.4 | | 3. Central Assistance for State & UT (with Legislature) Plans* | 2,708.3 | 2,196.5 | 2,161.1 | 2,419.0 | | 4. Total Grants & Loans (2+3) | 3,480.3 | 3,282.8 | 3,244.2 | 3,603.4 | | Grants | 3,360.2 | 3,157.0 | 3,118.4 | 3,477.6 | | Loans | 120.1 | 125.8 | 125.8 | 125.8 | | 5. Less-Recovery of Loans & Advances | 106.6 | 92.7 | 90.9 | 94.7 | | 6. Net Resources transferred to State and UT Governments (1+4-5) | 6,751.8 | 8,429.6 | 8,215.2 | 9,212.0 | | Gross Transfers / GDP (per cent) | 5.5 | 6.0 | 6.1 | 6.2 | | Net Transfers / GDP (per cent) | 5.4 | 6.0 | 6.1 | 6.1 | * With effect from 2014-15, funds for centrally sponsored schemes are routed through the state budgets as part of central assistance to state plans.
Note: The data on resource transfer from Centre to the states as presented in the Union Budget may vary from those in the state budgets. States, generally, tend to overestimate grants in aid from the Centre while underestimating the amount of shareable central taxes. | IV. Market Borrowings and Liabilities The Budget has estimated that out of the total borrowing requirements of ₹ 5,339 billion, net market borrowings (dated securities and 364-day treasury bills) would finance 79.6 per cent of GFD in 2016-17 as against 84.4 per cent in 2015-16 (RE) (Table 5). | Table 5: Financing Pattern of Gross Fiscal Deficit | | (₹ Billion) | | Items | 2014-15 (Actual) | 2015-16 (RE) | 2016-17 (BE) | | 1 | 2 | 3 | 4 | | Gross Fiscal Deficit | 5,107 | 5,351 | 5,339 | | | (100.0) | (100.0) | (100.0) | | Financed by | | | | | Net Market Borrowings* | 4,576.2 | 4,514.9 | 4,251.8 | | | (89.6) | (84.4) | (79.6) | | Other treasury bills | 30 | 578 | 166 | | | (0.6) | (10.8) | (3.1) | | Securities Issued against Small Savings (net) | 322 | 534 | 221 | | | (6.3) | (10.0) | (4.1) | | External Assistance | 129 | 115 | 191 | | | (2.5) | (2.1) | (3.6) | | State Provident Fund | 119 | 110 | 120 | | | (2.3) | (2.1) | (2.2) | | NSSF | -180 | -127 | 0 | | | -(3.5) | -(2.4) | (0.0) | | Reserve Fund | 51 | -5 | -80 | | | (1.0) | -(0.1) | -(1.5) | | Deposits and Advances | 275 | 304 | 240 | | | (5.4) | (5.7) | (4.5) | | Draw Down of Cash Balances | 778 | -221 | 132 | | | (15.2) | -(4.1) | (2.5) | | Others | -994 | -453 | 97 | | | -(19.5) | -(8.5) | (1.8) | *Includes Dated Securities and 364-day Treasury Bills taking into account the net impact of switching off securities.
Note: Figures in parenthesis represent percentages to GFD. | Interest payments to net tax revenue to remain unchanged in 2016-17 Reflecting the fiscal consolidation efforts, total liabilities-GDP ratio of the Central government is budgeted to decline to 49.4 per cent in 2016-17 from 50.8 per cent in 2015-16 (RE). Interest payments as a ratio to net tax revenue are budgeted to remain at the same level of 46.7 per cent as in the previous year (Chart 4). V. Overall Assessment The Union Budget for 2016-17 emphasizes on reviving rural demand for a more balanced and inclusive approach to growth. Given the constraints and the macroeconomic environment, the Budget 2016-17 reflects the strategy of boosting the economy while adhering to the path of fiscal consolidation. On structural reforms, the intent of the Budget announcements has been to encourage entrepreneurship through incentives, cutting red tape and building the necessary infrastructure. The Budget includes measures to ease doing business, including opening up road transport to the private sector, allowing greater FDI, and providing tax incentives for manufacturing start-ups, among others. 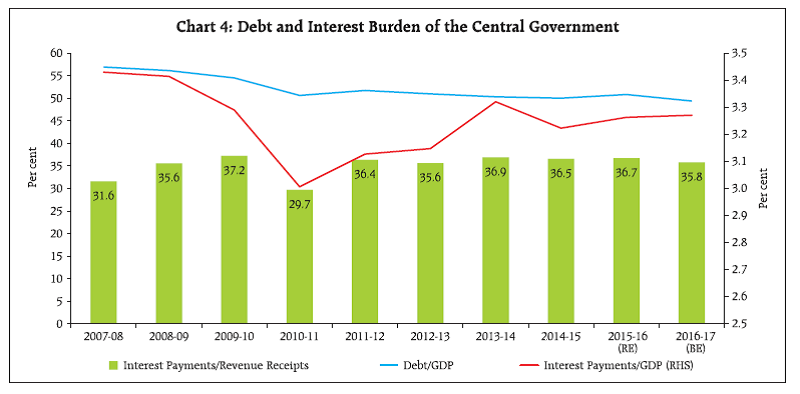 By adhering to the fiscal targets for 2015-16, the Budget has given a credibility boost to its stated goals of fiscal consolidation. All deficit indicators are projected to be at their lowest since the global financial crisis of 2008 which would help in anchoring inflation expectations and facilitate monetary policy transmission. The increase in the gross tax revenues includes the impact of additional resource mobilization measures taken by the government on direct and indirect taxes as well as rationalization of certain tax exemptions. The estimated increase in non-tax revenues factors in higher receipts through spectrum auction and dividends receipts. The reliance on disinvestment receipts, however, continues to be high, despite poor marksmanship in attaining the target in earlier years. Relying on disinvestment and spectrum sales more than tax revenues, however, implies a smaller drag on growth. The revenue component of total expenditure of the Centre is estimated to increase at a higher rate than capital expenditure in 2016-17. Even while accommodating the substantial increase in the revenue component of the Centre’s expenditure due to pay and pension revision and OROP, efforts have been made to boost capital expenditure in 2016-17. Finally, the Budget proposes to constitute a Committee to review the implementation of the FRBM Act, while reiterating its commitment to fiscal consolidation. Although both the central and state governments have made significant gains from implementation of FRBM, there is a gathering belief that a fiscal deficit range as opposed to a single target may be more appropriate in providing the necessary policy space to the government to deal with evolving situations. | Statement 1: Budget at a Glance | | (₹ billion) | | Items | 2014-15 (Accounts) | 2015-16 (Budget Estimates) | 2015-16 (Revised Estimates) | 2016-17 (Budget Estimates) | Variation in per cent | | Col.4 over Col. 2 | Col. 5 over Col.4 | | 1 | 2 | 3 | 4 | 5 | 6 | 7 | | 1. Revenue Receipts (i+ii) | 11,014.7 | 11,415.8 | 12,060.8 | 13,770.2 | 9.5 | 14.2 | | i) Tax Revenue (Net to Centre) | 9,036.2 | 9,198.4 | 9,475.1 | 10,541.0 | 4.9 | 11.2 | | ii) Non-tax Revenue | 1,978.6 | 2,217.3 | 2,585.8 | 3,229.2 | 30.7 | 24.9 | | of which: | | | | | | | | Interest Receipts | 238.0 | 236.0 | 231.4 | 296.2 | -2.8 | 28.0 | | 2. Capital Receipts | 5,622.0 | 6,359.0 | 5,793.1 | 6,010.4 | 3.0 | 3.8 | | of which: | | | | | | | | i) Market Borrowings * | 4,576.17 | 4,645.31 | 4,514.89 | 4,251.81 | -1.3 | -5.8 | | ii) Recoveries of Loans | 137.4 | 107.5 | 189.1 | 106.3 | 37.6 | -43.8 | | iii) Miscellaneous Capital Receipts | 377.4 | 695.0 | 253.1 | 565.0 | -32.9 | 123.2 | | 3. Total Receipts (1+2) | 16,636.7 | 17,774.8 | 17,853.9 | 19,780.6 | 7.3 | 10.8 | | 4. Revenue Expenditure (i + ii) | 14,669.9 | 15,360.5 | 15,476.7 | 17,310.4 | 5.5 | 11.8 | | i) Non-Plan | 11,093.9 | 12,060.3 | 12,126.7 | 13,274.1 | 9.3 | 9.5 | | ii) Plan | 3,576.0 | 3,300.2 | 3,350.0 | 4,036.3 | -6.3 | 20.5 | | 5. Capital Expenditure (i + ii) | 1,966.8 | 2,414.3 | 2,377.2 | 2,470.2 | 20.9 | 3.9 | | i) Non-Plan | 916.4 | 1,061.7 | 955.3 | 1,006.4 | 4.2 | 5.4 | | ii) Plan | 1,050.5 | 1,352.6 | 1,421.9 | 1,463.8 | 35.4 | 2.9 | | 6. Total Non-Plan Expenditure (4i + 5i) | 12,010.3 | 13,122.0 | 13,081.9 | 14,280.5 | 8.9 | 9.2 | | of which: | | | | | | | | i) Interest Payments | 4,024.4 | 4,561.5 | 4,426.2 | 4,926.7 | 10.0 | 11.3 | | ii) Defence | 2,186.9 | 2,467.3 | 2,246.4 | 2,491.0 | 2.7 | 10.9 | | iii) Major Subsidies | 2,490.2 | 2,273.9 | 2,418.6 | 2,317.8 | -2.9 | -4.2 | | 7. Total Plan Expenditure (4ii + 5ii) | 4,626.4 | 4,652.8 | 4,772.0 | 5,500.1 | 3.1 | 15.3 | | 8. Total Expenditure (6+7=4+5) | 16,636.7 | 17,774.8 | 17,853.9 | 19,780.6 | 7.3 | 10.8 | | 9. Revenue Deficit (4-1) | 3,655.2 | 3,944.7 | 3,415.9 | 3,540.2 | -6.5 | 3.6 | | | (2.9) | (2.8) | (2.5) | (2.3) | | | | 10. Effective Revenue Deficit | 2,347.6 | 2,839.2 | 2,095.9 | 1,871.8 | -10.7 | -10.7 | | | (1.9) | (2.0) | (1.5) | (1.2) | | | | 11. Gross Fiscal Deficit (8-(1+2ii+2iii)) | 5,107.3 | 5,556.5 | 5,350.9 | 5,339.0 | 4.8 | -0.2 | | | (4.1) | (3.9) | (3.9) | (3.5) | | | | 12. Gross Primary Deficit (11-6i) | 1,082.8 | 995.0 | 924.7 | 412.3 | -14.6 | -55.4 | | | (0.9) | (0.7) | (0.7) | (0.3) | | | Notes : 1) Capital Receipts are net of repayments.
2) *Includes Dated Securities and 364-day Treasury Bills, taking into account the net impact of switching off of securities.
3) Figures in parenthesis are as per cent of GDP
Source : Budget documents of the Government of India, 2016-17 |
|