This article presents an analysis of composition and ownership pattern of outstanding deposits with scheduled commercial banks (including regional rural banks) during 2007-2015. The data on ownership pattern of deposits as estimated from annual sample survey for the period from 2007-10 is used along with the annual census survey data as collected from-March 2012 to 20151. The analysis brings out broad trends across type of deposit accounts, institutional sectors, population groups and bank groups over the period. Introduction The annual survey on Composition and Ownership Pattern of Bank Deposits with Scheduled Commercial Banks (SCBs) including Regional Rural Banks (RRBs) as on March 31, 2015, was conducted by the Reserve Bank. The branch-wise data were collected, according to type of deposits (viz., current, savings and term deposits), and institutional categories of depositors (i.e., households, government, non-financial private corporate, financial, and foreign) under this survey. The aggregated data so collected under the survey were published on the Bank’s website under ‘data release’ (https://rbi.org.in/scripts/BS_PressReleaseDisplay.aspx?prid=35943) in January 2015. 2. This article presents a brief review of the trends and pattern as observed from the above data along with the prevailing economic environment. Composition of aggregate deposits according to type of deposit accounts and ownership categories, are discussed first. Subsequently, the pattern in ownership of deposits across various population groups is analysed. Institutional preference for specified bankgroups, if any, has also been looked into. State-wise patterns in bank deposits as on March 31, 2015 are presented in the final section. Share of term deposits in total deposits continued to rise 3. In the backdrop of decelerating growth in nominal GDP, the growth in total deposits continued to decline during 2014-15 (Table 1). In tandem, growth in term deposits as well as savings deposits also decelerated. However, term deposits continued to maintain its’ dominant share constituting around two-third of total deposits followed by savings deposits having around one-fourth share of total deposits. Despite reduction in term deposits’ growth rates during 2014-15, the share of term deposits in total deposits continued to show marginal rise (Chart 1). Deceleration in growth in savings deposits during 2014-15 was much sharper, thereby reducing its share in total deposits by 1.2 percentage points. Lower income growth together with higher inflation in the last few years might have led to shift away from savings deposits and may also cause deceleration in overall deposits growth. Households’ deposits grew at a relatively higher rate than total deposits 4. Except non-financial private corporate sector, growth in deposits of all sectors during 2014-15 was lower than that in the preceding year (Table 2). Non-financial private corporate sector recorded positive growth in bank deposits during 2014-15 after declining in the preceding two years. 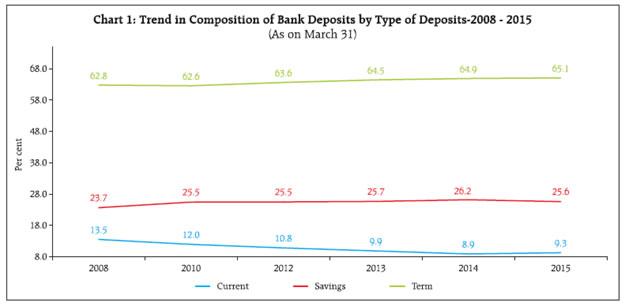
| Table 1: Trends in Deposits According to Type of Account | | (Amount outstanding in ₹ Billion; Growth in per cent) | | Account Type/As on March 31 | 2007 | 2008 | 2009 | 2010 | 2012 | 2013 | 2014 | 2015 | | Current deposits | 3,357 | 4,492 | 4,865 | 5,788 | 6,950 | 7,060 | 7,231 | 8,347 | | | (17.8) | (33.8) | (8.3) | (19.0) | (9.6) | (1.6) | (2.4) | (15.4) | | Savings deposits | 6,709 | 7,858 | 9,396 | 12,312 | 16,356 | 18,344 | 21,323 | 22,972 | | | (17.5) | (17.1) | (19.6) | (31.0) | (15.3) | (12.2) | (16.2) | (7.7) | | Term deposits | 16,933 | 20,836 | 26,136 | 30,263 | 40,803 | 46,063 | 52,757 | 58,408 | | | (29.8) | (23.0) | (25.4) | (15.8) | (16.1) | (12.9) | (14.5) | (10.7) | | Total deposits(**) | 26,999 | 33,186 | 40,397 | 48,364 | 64,110 | 71,466 | 81,310 | 89,727 | | | (24.9) | (22.9) | (21.7) | (19.7) | (15.1) | (11.5) | (13.8) | (10.4) | | Memo items (in %): | | | | | | | | | | Term (>1 Yr.) Deposit Rate | 7.50-9.00 | 8.25-9.00 | 7.75-8.75 | 6.00-7.50 | 8.50-9.25 | 7.50-9.00 | 8.00-9.25 | 8.00-8.75 | | Growth in Nominal GDP | 16.3 | 16.1 | 12.9 | 15.1 | 15.7 | 13.1 | 13.6 | 10.5 | | Growth in IIP | 12.9 | 15.5 | 2.5 | 5.3 | 2.9 | 1.1 | -0.1 | 2.8 | | CPI Inflation (Rural+Urban) | | | | | | 10.2 | 9.5 | 5.9 | | CPI Inflation (Industrial Workers) | 5.0 | 6.2 | 9.1 | 12.4 | 8.4 | 10.4 | 9.7 | 6.3 | | Growth in BSE 100 | 42.5 | 39.2 | -26.0 | -26.2 | -7.5 | 5.0 | 8.3 | 34.2 | | Growth in Gold Prices | 33.9 | 8.2 | 29.0 | 22.2 | 33.8 | 17.3 | -3.2 | -6.1 | ‘**’: Deposits include inter-bank deposits.
Note: 1. Figures in brackets represent the annual growth rates.
2. Prices of gold are in INR and are of Mumbai.
3. March 2011 estimates based on stratified sampling method were not released, the growth rates for 2012 for all the items are compounded annual growth rates over 2010.
4. The term deposit rates are as collected from the major banks (Source: Weekly Statistical Supplement, RBI).
5. GDP is as measured at current market prices. | 5. Households’2 deposits grew by 11.0 per cent as compared to overall deposits’ growth at 10.4 per cent. In total increase of ₹8,417 billion in total deposits during 2014-15, ₹3,731 billion (44.3 per cent) were contributed by households. This combined with a net decline in deposits of financial sector, led to households’ share in total deposits crossing 60 per cent as on March 31, 2015. Nonetheless, contribution of households in incremental deposits in 2015 remained lower in comparison with the earlier years. During 2014-15, while banks’ term deposits rates were quite competitive to provide real positive returns against prevailing inflation and negative returns provided by gold, these were far lower than the return from stock markets (other investment opportunity available to households). Within households’ sector, individuals3 were the single major constituent comprising around 82 per cent. (For detailed data, refer the RBI website (http://www.rbi.org.in/)). | Table 2: Total Deposits by Major Institutional Sectors | | (Amounts in ₹ Billion; Growth in Per cent) | | Major Institutional Sectors | Mar-07 | Mar-08 | Mar-09 | Mar-10 | Mar-12 | Mar-13 | Mar-14 | Mar-15 | | I. Government Sector | 3,907 | 4,478 | 5,652 | 6,551 | 9,361 | 9,912 | 11,402 | 12,900 | | | (25.2) | (14.6) | (26.2) | (15.9) | (19.5) | (5.9) | (15.0) | (13.1) | | Of which, Public Sector Corporations | 1,238 | 1,314 | 1,879 | 1,879 | 3,017 | 2,726 | 3,735 | 3,719 | | | (19.6) | (6.2) | (43.0) | (0.0) | (26.7) | (-9.6) | (37.0) | (-0.4) | | II. Private Corporate Sector (Non-Financial) | 3,035 | 4,322 | 5,867 | 7,137 | 9,384 | 8,875 | 8,065 | 9076 | | | (39.1) | (42.4) | (35.7) | (21.6) | (14.7) | (-5.4) | (-9.1) | (12.5) | | III. Financial Sector | 2,825 | 3,429 | 3,580 | 4,820 | 6,019 | 7150 | 7,928 | 7,361 | | | (34.6) | (21.4) | (4.4) | (34.7) | (11.7) | (18.8) | (10.9) | (-7.2) | | Of which, Banks | 1,123 | 1,191 | 1,578 | 2,348 | 2,652 | 2,939 | 3,736 | 3,384 | | | (44.7) | (6.1) | (32.5) | (48.8) | (6.3) | (10.8) | (27.1) | (-9.4) | | Other Financial Institutions | 1,181 | 1,306 | 1,085 | 1,346 | 1,548 | 1,662 | 2,136 | 1,918 | | | (28.1) | (10.6) | (-16.9) | (24.0) | (7.2) | (7.4) | (28.5) | (-10.2) | | Other Financial Companies | 521 | 932 | 916 | 1,127 | 1,819 | 2,549 | 2,056 | 2,060 | | | (30.2) | (79.0) | (-1.7) | (23.0) | (27.1) | (40.1) | (-19.3) | (0.2) | | IV. Household Sector | 15,497 | 19,280 | 23,552 | 28,049 | 37,249 | 42,568 | 48,567 | 53,914 | | | (22.6) | (24.4) | (22.2) | (19.1) | (15.2) | (14.3) | (14.1) | (11.0) | | Of which, Individuals (including Hindu undivided Families) | 12,018 | 14,954 | 18,732 | 21,843 | 28,660 | 33,314 | 40,468 | 44,199 | | | (18.5) | (24.4) | (25.3) | (16.6) | (14.5) | (16.2) | (21.5) | (9.2) | | V. Foreign Sector | 1,736 | 1,677 | 1,747 | 1,807 | 2,097 | 2,960 | 5,348 | 6,475 | | | (10.8) | (-3.4) | (4.2) | (3.4) | (7.7) | (41.2) | (80.7) | (21.1) | | Of which, Non-Residents | 1,494 | 1,395 | 1,558 | 1,605 | 1,951 | 2,811 | 5,013 | 5,807 | | | (7.6) | (-6.7) | (11.7) | (3.0) | (10.2) | (44.1) | (78.3) | (15.8) | | Total Deposits | 26,999 | 33,186 | 40,397 | 48,364 | 64,110 | 71,466 | 81,310 | 89,727 | | | (24.9) | (22.9) | (21.7) | (19.7) | (15.1) | (11.5) | (13.8) | (10.4) | | Note: Figures in brackets represent the annual growth rates. The estimates for March 2011 were not released. Therefore, the growth rates for 2012 are the compounded annual growth rates (CAGR) over 2010. | 6. After households, government sector was the second largest contributor in total deposits constituting 14.4 per cent of total deposits as on March 31, 2015 followed by non-financial private corporate sector, financial sector, and foreign sector (Chart 2). Households has the largest shares across all types of deposits; Term deposits constituted major part of total deposits across all institutional sectors 7. The contribution of various institutional sectors in different types of deposits indicated that the households sector, which is the largest contributor in total deposits outstanding, also held the largest shares across all three types of deposits, viz., current, savings and term deposits as on March 31, 2015 (Table 3). Over 80 per cent of the savings deposits, more than 50 per cent of the term deposits and over 45 per cent of the current deposits are held by the households. The non-financial private corporate sector was the second largest contributor in the current deposits, whereas the government sector was the second largest contributor in savings and term deposits. Further, term deposits formed maximum portion of total deposits across all institutional sectors with share of 70 - 85 per cent except households (57.5 per cent). 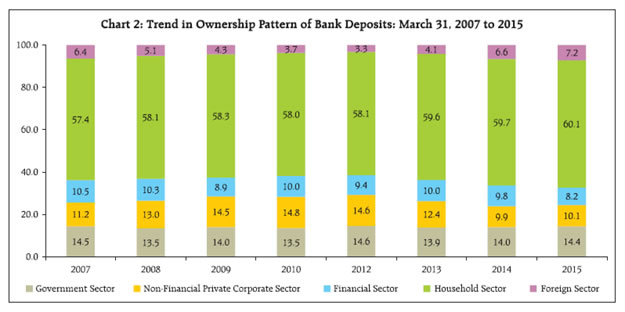
| Table 3: Institutional Ownership of Various Types of Deposits | | (Per cent) | | Sector of the Economy/ Types of Deposits | Current | Savings | Term | Total | | 2014 | 2015 | 2014 | 2015 | 2014 | 2015 | 2014 | 2015 | | I. Government Sector | {9.6} | {9.6} | {19.4} | {20.1} | {70.9} | {70.3} | {100.0} | {100.0} | | | (15.2) | (14.8) | (10.4) | (11.3) | (15.3) | (15.5) | (14.0) | (14.4) | | II. Non-Financial Private Corporate Sector | {24.7} | {23.0} | {1.6} | {1.8} | {73.7} | {75.2} | {100.0} | {100.0} | | | (27.6) | (25.0) | (0.6) | (0.7) | (11.3) | (11.7) | (9.9) | (10.1) | | III. Financial Sector | {10.8} | {13.3} | {0.9} | {1.3} | {88.3} | {85.4} | {100.0} | {100.0} | | | (11.8) | (11.8) | (0.3) | (0.4) | (13.3) | (10.8) | (9.8) | (8.2) | | IV. Household Sector | {6.3} | {7.1} | {36.7} | {35.4} | {57.0} | {57.5} | {100.0} | {100.0} | | | (42.1) | (46.1) | (83.6) | (83.1) | (52.5) | (53.0) | (59.7) | (60.1) | | V. Foreign Sector | {4.5} | {3.0} | {20.2} | {16.0} | {75.4} | {81.0} | {100.0} | {100.0} | | | (3.3) | (2.3) | (5.1) | (4.5) | (7.6) | (9.0) | (6.6) | (7.2) | | Total Deposits | {8.9} | {9.3} | {26.2} | {25.6} | {64.9} | {65.1} | {100.0} | {100.0} | | | (100.0) | (100.0) | (100.0) | (100.0) | (100.0) | (100.0) | (100.0) | (100.0) | | Note: Figures in curly brackets represent sector-wise composition of deposits in terms of types, whereas the same in parentheses represent types of deposit-wise composition in terms of sectors. | Current and Savings Accounts constitute more than 40 per cent of households’ deposits 8. Composition of various institutional sectors in terms of types of deposits accounts maintained by them, shows that term deposits constituted a major part of total deposits for all institutional sectors over the period 2008-2015 (Table 4). Savings deposits was the second major constituent in all sectors except for non-financial private corporate and financial sectors, wherein current deposits was the second most important part with savings deposits having a negligible share. 9. Households are keeping around 43 per cent of their total deposits in current and savings accounts (CASA) (having lower interest rates), and constitute a quite stable and cheaper source of funds for banks. While government sector keeps around 30 per cent of their total deposits in CASA form, non-financial private corporate sector keeps 25 per cent in CASA. More than half of the total deposits are held by metropolitan branches 10. The distribution of deposits across the population groups4 indicated that more than half of the total deposits are held by the metropolitan branches, but their share has been declining since 2010 (Table 5). It may be noted that growth in deposits raised by rural, urban, and metropolitan branches during 2014-15 was lower as compared to the previous year while it is higher for semi-urban branches. | Table 4: Composition of Deposits by Various Institutional Sectors | | (Per cent) | Year
(As on March 31) | Deposit Type/ Sector | Government Sector | Private Corporate Sector
(Non-Financial) | Financial Sector | Household Sector | Foreign Sector | Total | | 2008 | Current | 14.8 | 25.8 | 21.4 | 9.5 | 9.2 | 13.5 | | Savings | 14.0 | 0.8 | 1.2 | 34.8 | 26.5 | 23.7 | | Term | 71.2 | 73.4 | 77.5 | 55.7 | 64.3 | 62.8 | | Total | 100.0 | 100.0 | 100.0 | 100.0 | 100.0 | 100.0 | | 2010 | Current | 14.1 | 26.8 | 9.6 | 8.5 | 6.5 | 12.0 | | Savings | 16.1 | 1.0 | 1.0 | 37.4 | 36.2 | 25.5 | | Term | 69.8 | 72.2 | 89.4 | 54.2 | 57.3 | 62.6 | | Total | 100.0 | 100.0 | 100.0 | 100.0 | 100.0 | 100.0 | | 2012 | Current | 12.1 | 22.0 | 12.3 | 7.8 | 6.1 | 10.8 | | Savings | 18.7 | 3.0 | 1.4 | 36.3 | 33.0 | 25.5 | | Term | 69.2 | 75.0 | 86.2 | 55.9 | 60.8 | 63.6 | | Total | 100.0 | 100.0 | 100.0 | 100.0 | 100.0 | 100.0 | | 2013 | Current | 12.1 | 22.9 | 11.7 | 6.8 | 3.8 | 9.9 | | Savings | 18.1 | 2.2 | 1.1 | 36.5 | 24.5 | 25.7 | | Term | 69.8 | 74.9 | 87.2 | 56.7 | 71.7 | 64.5 | | Total | 100.0 | 100.0 | 100.0 | 100.0 | 100.0 | 100.0 | | 2014 | Current | 9.6 | 24.7 | 10.8 | 6.3 | 4.5 | 8.9 | | Savings | 19.4 | 1.6 | 0.9 | 36.7 | 20.2 | 26.2 | | Term | 70.9 | 73.7 | 88.3 | 57.0 | 75.4 | 64.9 | | Total | 100.0 | 100.0 | 100.0 | 100.0 | 100.0 | 100.0 | | 2015 | Current | 9.6 | 23.0 | 13.3 | 7.1 | 3.0 | 9.3 | | Savings | 20.1 | 1.8 | 1.3 | 35.4 | 16.0 | 25.6 | | Term | 70.3 | 75.2 | 85.4 | 57.5 | 81.0 | 65.1 | | Total | 100.0 | 100.0 | 100.0 | 100.0 | 100.0 | 100.0 |
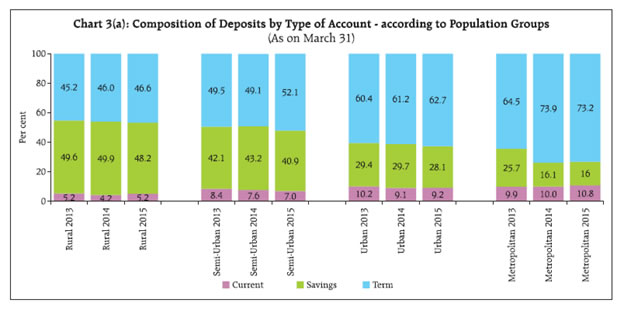
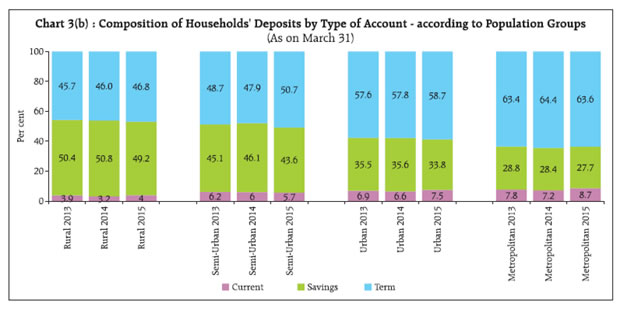
| Table 5: Distribution of Deposits Across Population Groups | | (Amounts in ₹ Billion; Growth Rate and Share in Per cent) | | Population Group/Year (as on March 31) | 2007 | 2008 | 2009 | 2010 | 2012 | 2013 | 2014 | 2015 | | Rural | Amount | 2,585 | 3,010 | 3,151 | 4,270 | 5,780 | 6,757 | 7,917 | 8,900 | | (Growth Rate) | (10.8) | (16.4) | (4.7) | (35.5) | (16.3) | (16.9) | (17.2) | (12.4) | | {Share} | {9.6} | {9.1} | {7.8} | {8.8} | {9.0} | {9.5} | {9.7} | {9.9} | | Semi-urban | Amount | 3,653 | 4,328 | 5,488 | 6,307 | 8,664 | 10,132 | 11,604 | 13,367 | | (Growth Rate) | (18.8) | (18.5) | (26.8) | (14.9) | (17.2) | (16.9) | (14.5) | (15.2) | | {Share} | {13.5} | {13.0} | {13.6} | {13.0} | {13.5} | {14.2} | {14.3} | {14.9} | | Urban | Amount | 5,526 | 6,829 | 8,926 | 9,833 | 13,248 | 15,388 | 17,640 | 20,041 | | (Growth Rate) | (20.8) | (23.6) | (30.7) | (10.2) | (16.1) | (16.2) | (14.6) | (13.6) | | {Share} | {20.5} | {20.6} | {22.1} | {20.3} | {20.7} | {21.5} | {21.7} | {22.3} | | Metropolitan | Amount | 15,235 | 19,020 | 22,832 | 27,954 | 36,417 | 39,189 | 44,148 | 47,420 | | (Growth Rate) | (31.0) | (24.8) | (20.0) | (22.4) | (14.1) | (7.6) | (12.7) | (7.4) | | {Share} | {56.4} | {57.3} | {56.5} | {57.8} | {56.8} | {54.8} | {54.3} | {52.8} | | All India | Amount | 26,999 | 33,186 | 40,397 | 48,364 | 64,110 | 71,466 | 81,310 | 89,727 | | (Growth Rate) | (24.9) | (22.9) | (21.7) | (19.7) | (15.1) | (11.5) | (13.8) | (10.4) | | {Share} | {100.0} | {100.0} | {100.0} | {100.0} | {100.0} | {100.0} | {100.0} | {100.0} | | Note: The growth rates for 2012 are the compounded annual growth rates (CAGR) over 2010. | Households’ contributed maximum deposits across all population groups 11. Households continued to remain the major owner of bank deposits across all population groups in 2015. The share of households in total deposits held by rural branches was 89.1 per cent followed by 76.2 per cent by semi-urban branches, 66.5 per cent by urban branches and 47.4 per cent by metropolitan branches. In the metropolitan area, other notable contributing sectors were government sector (16.3 per cent), non-financial private corporate sector (15.5 per cent) and financial sector (12.5 per cent) (For detailed data, refer RBI website (http://www.rbi.org.in/)). Share of savings deposits was the highest in total deposits held by rural branches 12. It is seen that deposit composition is generally shifting towards higher interest bearing term-deposits in all the population groups but more so, in the urban/ metropolitan centres (Chart 3(a)). However, savings deposits’ share in total deposits was the largest in rural centres. Similar pattern is observed in composition of households’ deposits across population groups (Chart 3(b)). Public sector banks continued to dominate 13. With wider network of branches, public sector banks (consisting of SBI & its' associates and nationalised banks including IDBI Bank and Bhartiya Mahila Bank) continued to have the largest share of total deposits, which hovered in the range of 70 - 75 per cent between 2007 and 2015 (Table 6). Domestic private sector banks held 18 - 21 per cent of deposits while the share of foreign banks remained at 4 - 6 per cent in 2007-2015. The RRBs contributed at around 3 per cent of total deposits in the same period. 14. Distribution of deposits according to type was quite similar to earlier years among SBI and its associates, nationalised banks and private sector banks, where the term deposits had the largest share followed by savings deposits (Chart 4). In case of foreign banks, term deposits constituted more than two-third of the total deposits followed by current deposits (around one-fourth). In case of RRBs, savings deposits accounted for nearly half of the total deposits followed by the term deposits (more than two-fifth), which is in consistent with composition of rural deposits (Chart 3(a)). | Table 6: Bank Group wise Distribution of Total Deposits | | (Amounts in ₹ Billion; Growth and Share in Per cent) | | Bank Group/Year (as on March 31) | 2007 | 2008 | 2009 | 2010 | 2012 | 2013 | 2014 | 2015 | | State Bank of India and its' Associates | Amount | 6,071 | 7,513 | 10,020 | 10,531 | 13,598 | 15,562 | 17,417 | 19,546 | | Growth Rate | (20.3) | (23.8) | (33.4) | (5.1) | (13.6) | (14.4) | (11.9) | (12.2) | | Share | {22.5} | {22.6} | {24.8} | {21.8} | {21.2} | {21.8} | {21.4} | {21.8} | | Nationalised Banks | Amount | 12,843 | 15,845 | 19,116 | 25,406 | 34,233 | 37,540 | 42,818 | 46,105 | | Growth Rate | (24.0) | (23.4) | (20.6) | (32.9) | (16.1) | (9.7) | (14.1) | (7.7) | | Share | {47.6} | {47.7} | {47.3} | {52.5} | {53.4} | {52.5} | {52.7} | {51.4} | | Regional Rural Banks | Amount | 817 | 961 | 1,186 | 1,474 | 1,839 | 2,064 | 2,343 | 2,661 | | Growth Rate | (7.0) | (17.6) | (23.5) | (24.2) | (11.7) | (12.2) | (13.5) | (13.6) | | Share | {3.0} | {2.9} | {2.9} | {3.0} | {2.9} | {2.9} | {2.9} | {3.0} | | Private Sector Banks | Amount | 5,725 | 6,960 | 8,167 | 8,550 | 11,650 | 13,465 | 15,252 | 17,834 | | Growth Rate | (33.6) | (21.6) | (17.3) | (4.7) | (16.7) | (15.6) | (13.3) | (16.9) | | Share | {21.2} | {21.0} | {20.2} | {17.7} | {18.2} | {18.8} | {18.8} | {19.9} | | Foreign Banks | Amount | 1,543 | 1,908 | 1,907 | 2,403 | 2,780 | 2,836 | 3,480 | 3,582 | | Growth Rate | (32.7) | (23.7) | (0.0) | (26.0) | (7.6) | (2.0) | (22.7) | (2.9) | | Share | {5.7} | {5.7} | {4.7} | {5.0} | {4.3} | {4.0} | {4.3} | {4.0} | | All Scheduled Commercial Banks | Amount | 26,999 | 33,186 | 40,397 | 48,364 | 64,110 | 71,466 | 81,310 | 89,727 | | Growth Rate | (24.9) | (22.9) | (21.7) | (19.7) | (15.1) | (11.5) | (13.8) | (10.4) | | Share | {100.0} | {100.0} | {100.0} | {100.0} | {100.0} | {100.0} | {100.0} | {100.0} | | Note: Private sector banks include old as well as new private sector banks.The growth rates for 2012 are compounded annual growth rates (CAGR) over 2010. |
 15. As on March 31, 2015, households accounted for the highest share in total deposits in all the bank groups except for the foreign banks’ group, where the non-financial private corporate sector held the largest share of deposits (Table 7). In foreign banks, foreign sector was the second largest contributor of total deposits. 16. Choice of bank groups by various institutional categories appeared to be based on their business rules as well as the comfort level they derive from such banks. Around 90 per cent of the Government deposits were with the public sector banks. Around two-third of financial sector deposits were with the nationalised banks followed by around one-fifth being held with private sector banks. Around 56 per cent deposits of non-financial private corporate sector were held with the public sector banks, while 44 per cent deposits were held with the private sector banks and the foreign banks. More than three-fourth of the household deposits, especially of individuals (largest constituent of household sector) were with the public sector banks, perhaps on account of wider network of these banks across the country (Table 7). Large share of deposits contributed by a few states5 17. The composition of deposits as on March 31, 2015 across different States/Union Territories (UTs) showed higher concentration in seven states viz. Maharashtra, Delhi, Uttar Pradesh, Karnataka, West Bengal, Tamil Nadu, and Gujarat. These states accounted for 66.2 per cent of total deposits and 62.1 per cent of total households’ deposits. Maharashtra alone contributed nearly one-fourth of the total deposits. 18. Households maintained dominant contribution in total bank deposits, but with varying degree, among different regions. The overall households’ share in total deposits in the central region was the highest at 71.9 per cent (with the constituent states/union territories having the share in the range between 62 and 77 per cent), followed by the eastern region at 70.7 per cent (with the constituents having the share ranging between 61 to 75 per cent) and north-eastern region at 70.1 per cent (share varying between 64 to 80 per cent). The share of households in total deposits was lower in the northern region (63.9 per cent), the southern region (59.8 per cent) and in western region (47.7 per cent). In these regions, non-financial private corporate sector, government sector and other sectors also have a significant share. 19. Of the total deposits by non-financial private corporates, 58.6 per cent was concentrated in three states, namely, Maharashtra (33.8 per cent), Delhi (13.6 per cent), and Karnataka (11.3 per cent). Maharashtra constituted around 64 per cent of total deposits by financial sector, mainly due to concentration of financial business in Mumbai. Moreover, Maharashtra and Delhi together contributed 39 per cent of total Government deposits. In the total foreign sector deposits raised by the SCBs, Maharashtra contributed 34.0 per cent followed by Kerala (17.0 per cent), Delhi (9.2 per cent), Gujarat (7.0 per cent), and Karnataka (6.5 per cent). | Table 7: Bank Group Wise Pattern of Ownership of Deposits – March 31, 2015 | | (Amounts in ₹ Billion; Share in Per cent) | | Bank Group/Sector of the Economy | State Bank of India & its' Associates | Nationalised Banks | Regional Rural Banks | Private Sector Banks | Foreign Banks | All Scheduled Commercial Banks | | I. Government Sector | 3,439 | 8,123 | 180 | 877 | 280 | 12,900 | | {17.6} | {17.6} | {6.8} | {4.9} | {7.8} | {14.4} | | (26.7) | (63.0) | (1.4) | (6.8) | (2.2) | (100) | | II. Private Corporate Sector (Non-Financial) | 1,704 | 3,342 | 13 | 2,656 | 1,361 | 9,076 | | {8.7} | {7.2} | {0.5} | {14.9} | {38.0} | {10.1} | | (18.8) | (36.8) | (0.1) | (29.3) | (15.0) | (100) | | III. Financial Sector | 296 | 4,913 | 29 | 1,593 | 530 | 7,361 | | {1.5} | {10.7} | {1.1} | {8.9} | {14.8} | {8.2} | | (4.0) | (66.7) | (0.4) | (21.6) | (7.2) | (100) | | IV. Household Sector | 12,628 | 28,364 | 2,433 | 9,957 | 533 | 53,914 | | {64.6} | {61.5} | {91.4} | {55.8} | {14.9} | {60.1} | | (23.4) | (52.6) | (4.5) | (18.5) | (1.0) | (100) | | V. Foreign Sector | 1,478 | 1,363 | 6 | 2,750 | 879 | 6,475 | | {7.6} | {3.0} | {0.2} | {15.4} | {24.5} | {7.2} | | (22.8) | (21.0) | (0.1) | (42.5) | (13.6) | (100) | | Total Deposits | 19,546 | 46,105 | 2,661 | 17,834 | 3,582 | 89,727 | | {100} | {100} | {100} | {100} | {100} | {100} | | (21.8) | (51.4) | (3.0) | (19.9) | (4.0) | (100) | Note: 1. Figures in curly brackets represent composition of deposits of a bank group across institutional sectors.
2. Figures in parentheses represent composition of deposits kept by an institutional sector across bank groups. |
|