The aggregated sales of the private (non-financial) corporate business sector contracted during H1:2015-16. The contraction was primarily on account of the manufacturing sector which is predominated by the fall in crude oil prices. The Iron & Steel and the Textile industries have also recorded significant contraction in sales. Half yearly statement of asset and liabilities indicated a rising tail risk in corporate leverage. Number of companies that are either highly leveraged or have reported negative net worth increased as on September 2015 and a rise in the indebtedness of such companies was also observed. On the positive side, falling raw-material and power and fuel expenses boosted EBITDA (Earnings before Interest, Tax, Depreciation and Amoritisation) growth (Y-o-Y) and margin. EBITDA margin reached a high level previously observed during 2010-11 indicating a revival of profitability. The machinery industry within the manufacturing sector and the IT sector showed an improvement in sales growth. An analysis of the performance of listed non-financial private corporates over the quarters reveals that the slowdown in the aggregate sales growth (Y-o-Y) observed during Q1:2014-15 and Q2:2014-15 worsened into a contraction during Q1:2015-16 and Q2:2015-16. EBITDA margin remained high at around 15 per cent in both the quarters of the first half, while net profit margin improved. The article analyses the performance of the private (non-financial) corporate business sector during the first half (April- September) of 2015-16, based on earnings results of 2,846 listed companies. Other important financial statements have also been referred. This article incorporates the NIC 2008 industry classification and provides a brief analysis by sectors and major industry groups. It also captures the trend in sales, expenditure and profit margins of the private corporate sector over a longer horizon. Detailed quarterly data has been made available periodically in the website of the Reserve Bank of India (Q2:2015-16 data has been released on 3rd December 2015). 1. Contracting sales growth but improved profit margins 1.1. Sales of 2,846 listed companies of the private corporate sector contracted during H1: 2015-16. Over a longer horizon, since H1:2012-13, aggregate sales growth recorded a declining trend barring H1: 2014-15 wherein a minor increase was observed (Table 2, Chart 1). Expenditure in the first half of 2015-16 contracted due to contracting cost of raw materials and lower growth in staff costs. Power and fuel expenses also showed a sharp decline as fallout of the global slide in oil prices. 1.2. EBITDA or operating profits and EBIT (Earnings before Interest and Tax) showed substantial positive growth at the aggregate level from the levels recorded in H2:2014-15. Net profits showed a minor contraction in the current half year at -0.7 per cent (Y-o-Y) as against -21.0 per cent observed in H2:2014-15 mainly on account of lower tax provisions offsetting the higher interest growth. Other income recorded a steep decline of -4.9 per cent in relation to an increase of 0.5 per cent posted for H2:2014-15. 1.3. EBITDA and Net Profit margins recorded improvement over previous six successive half years indicating a revival in profitability. 1.4. Excluding the Petroleum product industry group, aggregate sales growth (Y-o-Y) indicated continued slowdown since H1:2014-15. Profitability, as measured by EBITDA margins increased from 14.0 per cent in H2:2014-15 to 15.4 per cent in H1:2015-16 and was the maximum since H1:2012-13 2. Increase in tail risk 2.1. Corporate leverage in terms of debt-equity ratio, at the aggregate, remained mostly unchanged as at end September 2015 compared with its position at end September 2014. However, total debt of highly leveraged companies, either with negative net worth or debt-equity ratio greater than 300, continued to increase from ₹2,410 billion as at end September 2014 to ₹2,896 billion at end September 2015. The percentage of overall debt held by above set of companies in the debt held by the NGNF companies covered increased from end September 2014 (22.1 per cent) to end September 2015 (24.5 per cent) indicating a rise in upside risk in corporate leverage. The total number of companies in the above group (number of companies either with negative net worth or debt-equity ratio greater than 300 per cent) also increased over three previous half years indicating an increase in tail risk in corporate leverage. 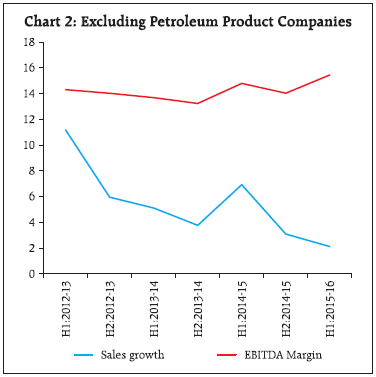
| Table 1: Performance of the Listed Non-Government Non-Financial Companies | | No. of companies | H1: 2015-16 | H2: 2014-15 | H1: 2014-15* | | Items | Amount (₹ billion) | Y-o-Y Growth @ in Per cent | | 2,846 | 2,585 | 2,965 | | 1 | 2 | 3 | 4 | | Sales | 15301 | -3.5 | -2.3 | 5.8 | | Value of Production | 15303 | -4.1 | -2.2 | 6.0 | | Expenditure | 12967 | -5.8 | -2.8 | 5.0 | | CRM ** | 6219 | -15.7 | -11.1 | 7.0 | | Staff Cost | 1381 | 9.8 | 12.8 | 8.2 | | Power & fuel | 566 | -3.2 | 0.5 | 8.7 | | Operating Profits (EBITDA) | 2336 | 6.8 | 2.0 | 12.6 | | Other Income@@ | 458 | -4.9 | 0.5 | 14.0 | | Depreciation | 611 | 4.1 | 3.6 | 6.4 | | Gross Profits (EBIT) | 2182 | 4.8 | 1.2 | 14.8 | | Interest | 679 | 9.3 | 6.9 | 1.4 | | Earnings before tax (EBT)^ | 1527 | 1.4 | -11.1 | 31.1 | | Tax provision | 433 | 7.3 | 21.3 | 27.2 | | Net Profits^ | 1095 | -0.7 | -21.0 | 32.6 | | Paid-up Capital | 1380 | 4.4 | 3.3 | 2.3 | * : Published in February 2015 issue of the RBI Bulletin.
@ : Growth rates calculated on the basis of common set of companies during any period.
** : CRM : Consumption of Raw Materials.
@@ : Includes forex gain while forex losses are included in Expenditure.
^ : Adjusted for non-operating surplus/deficit. |
| Table 2: Important Performance Parameters | | Period | No. of Companies | Sales Growth (Y-o-Y) | Expenditure Growth (Y-o-Y) | EBITDA Growth (Y-o-Y) | Net Profit Growth ( Y-o-Y) | EBITDA Margin (Per cent) | Net Profit Margin (Per cent) | | 1 | 2 | 3 | 4 | 5 | 6 | 7 | | H1:2012-13 | 2,832 | 12.3 | 13.6 | 4.9 | 4.3 | 13.1 | 6.4 | | H2:2012-13 | 2,912 | 6.8 | 5.8 | 8.0 | 11.9 | 13.2 | 6.5 | | H1:2013-14 | 2,731 | 5.4 | 5.6 | -0.8 | -14.9 | 12.5 | 5.2 | | H2:2013-14 | 2,864 | 4.7 | 4.8 | 1.6 | -4.9 | 12.3 | 5.1 | | H1:2014-15 | 2,965 | 5.8 | 5.0 | 12.6 | 32.6 | 13.7 | 6.8 | | H2:2014-15 | 2,585 | -2.3 | -2.8 | 2.0 | -21.0 | 13.6 | 5.1 | | H2:2015-16 | 2,846 | -3.5 | -5.8 | 6.8 | -0.7 | 15.3 | 7.2 | 3. EBITDA Margins improved across size groups 3.1. Large companies (annualised sales more than ₹10 billion) which showed some resilience in terms of Y-o-Y sales growth till H1:2014-15 started to contract since the second half of 2014-15 (Table 4). This coincided with falling crude oil prices since the second quarter of 2014-15, as all major companies in the Petroleum Products industry belong to the group of large companies. Medium and small sized companies also continued to contract in sales. | Table 3: NGNF Listed Companies: Tail Risk in Corporate Leverage (per cent) | | Leverage | Number of Companies (as percentage of total companies) | Share of Debt to Total Debt | | Sep’14 | Mar’15 | Sep’15 | Sep’14 | Mar’15 | Sep’15 | | Negative Net worth or DER>=2 | 18.4 | 19.0 | 19.4 | 31.8 | 33.8 | 30.5 | | Negative Net worth or DER>=3 | 13.6 | 14.2 | 15.3 | 22.9 | 23.0 | 24.9 |
| Table 4: Size class - wise important performance parameters | | Size Classes | Large | Medium | Small | | Annualised sales more than ₹10 billion | Annualised sales between ₹1 billion and ₹10 billion | Annualised sales less than ₹1 billion | | Period | Growth Rate (Y-o-Y) (%) | Margins (%) | Growth Rate (Y-o-Y) (%) | Margins (%) | Growth Rate (Y-o-Y) (%) | Margins (%) | | Sales | EBITDA | Net Profit | EBITDA | Net Profit | Sales | EBITDA | Net Profit | EBITDA | Net Profit | Sales | EBITDA | Net Profit | EBITDA | Net Profit | | 1 | 2 | 3 | 4 | 5 | 6 | 7 | 8 | 9 | 10 | 11 | 12 | 13 | 14 | 15 | | H1:2012-13 | 14.6 | 5.9 | 7.8 | 13.4 | 7.0 | 3.8 | 0.6 | -27.1 | 11.9 | 3.5 | -21.5 | -19.1 | $ | 6.9 | -4.0 | | H2:2012-13 | 9.2 | 10.9 | 22.9 | 13.9 | 7.8 | -2.7 | -10.5 | -86.6 | 10.2 | 0.5 | -24.3 | -119.3 | $ | -0.3 | -15.0 | | H1:2013-14 | 6.6 | 1.6 | -11.4 | 13.0 | 5.9 | 1.1 | -14.1 | -40.8 | 10.2 | 2.1 | -19.3 | -56.9 | $ | 4.2 | -7.7 | | H2:2013-14 | 6.4 | 7.4 | 4.1 | 13.4 | 6.7 | -1.7 | -38.5 | $ | 6.3 | -2.6 | -25.8 | $ | $ | -5.9 | -25.0 | | H1:2014-15 | 7.5 | 13.2 | 31.4 | 14.4 | 7.9 | -0.8 | 5.6 | 52.1 | 9.5 | 1.0 | -24.3 | 33.1 | $ | 4.9 | -12.2 | | H2:2014-15 | -1.7 | 2.8 | -16.5 | 14.7 | 6.6 | -5.4 | -2.9 | $ | 7.4 | -3.3 | -15.0 | $ | $ | -2.6 | -23.9 | | H1:2015-16 | -3.1 | 8.1 | 0.1 | 16.2 | 8.5 | -3.5 | -0.7 | $ | 9.3 | -0.5 | -23.6 | -70.9 | $ | 2.5 | -16.0 | 3.2. Despite contracting sales, EBITDA margin improved across all of the size groups in H1:2015-16 over H2:2014-15. It stood at the highest level since H1:2012-13 for the large companies. 3.3. Net profit margins improved for the large companies, while the extent of losses as a percentage of sales lowered in H1:2015-16 for the medium and small companies. 3.4. Interest coverage ratio (EBIT/Interest Expenses) hovered around 3.8 to 3.9 for large companies during the period of H1:2012-13 to H1:2015-16 (Chart 3). For medium and small companies it slid to very low levels with an average of 1.2 for medium companies and only 0.1 for small companies in H1:2015-16. 3.5. Solvency ratio as measured by [(Net Profit + depreciation)/ Average borrowings*100] improved across size groups during H1:2015-16, while leverage and cost of borrowings remained at similar levels as seen in H1:2014-15. The debt to EBITDA ratio showed a significant improvement for the small companies. 4. Margins maintained across sectors 4.1. The sales of the manufacturing sector was impacted by the petroleum products companies having a share of 15 per cent in the sales of the manufacturing sector. The Y-o-Y contraction in the price of crude oil in turn, was responsible for poor sales of the petroleum product companies. The services (other than IT) sector recorded improvement in sales growth in the second half of 2014-15 and moderated subsequently in H1:2015-16. Despite moderation, the services (other than IT) recorded better sales growth in the last two half years as compared to that in H2:2013-14 and H1:2014-15. The IT sector whose performance widely fluctuated between 2012-13 and 2014-15 has shown signs of improvement in H1:2015-16. | Table 5: Sector- wise important performance parameters | | Sector | Manufacturing | Services (other than IT) | IT | | Period | Growth Rate (Y-o-Y) (%) | Margins (%) | Growth Rate (Y-o-Y) (%) | Margins (%) | Growth Rate (Y-o-Y) (%) | Margins (%) | | Sales | EBITDA | Net Profit | EBITDA | Net Profit | Sales | EBITDA | Net Profit | EBITDA | Net Profit | Sales | EBITDA | Net Profit | EBITDA | Net Profit | | 1 | 2 | 3 | 4 | 5 | 6 | 7 | 8 | 9 | 10 | 11 | 12 | 13 | 14 | 15 | | H1:2012-13 | 11.8 | 3.5 | 3 | 11.5 | 5.6 | 10.4 | 8.0 | 38.3 | 17.1 | 4.9 | 20.6 | 25.8 | 21.9 | 25.8 | 19.8 | | H2:2012-13 | 6.5 | 5.9 | 1.5 | 11.4 | 5.1 | 10.7 | 0.6 | -45.8 | 16.8 | 2.9 | 7.2 | 7.1 | -3.4 | 25.4 | 18.7 | | H1:2013-14 | 4.2 | -3.6 | -15.3 | 10.6 | 4.5 | 8.0 | -5.2 | -31.3 | 16.6 | 3.9 | 19.1 | 21.8 | 14.9 | 27.6 | 20.3 | | H2:2013-14 | 4.7 | 1.8 | -7.9 | 10.8 | 4.5 | 3.0 | -19.3 | -86.9 | 13.0 | 0.4 | 21.1 | 33.1 | 33.5 | 28.1 | 21.2 | | H1:2014-15 | 5.6 | 12.1 | 32.1 | 11.4 | 5.4 | 4.0 | 17.3 | 99.3 | 18.6 | 8.2 | 11.4 | 11.8 | 26.7 | 27.5 | 22.9 | | H2:2014-15 | -4.7 | -1.4 | -32.1 | 11.6 | 3.8 | 11.1 | 49.7 | $ | 18.4 | 5.8 | 8.2 | 3.4 | -3.6 | 26.9 | 19.7 | | H1:2015-16 | -6.4 | 7.6 | -0.5 | 13.3 | 6.0 | 7.0 | 19.1 | -19.6 | 19.9 | 5.7 | 10.9 | 6.1 | 15.1 | 27.0 | 24.3 | 4.2. EBITDA growth (Y-o-Y) improved remarkably for the manufacturing sector during H1:2015-16 against a contraction observed during the previous half year. Notwithstanding the contraction in sales growth the sector recorded the highest EBITDA margin of 13.3 per cent since H1:2012-13. The non-IT services sector also showed the highest EBITDA margin in last seven half years, despite a moderation in EBITDA growth. The IT sector recorded a comparatively low Y-o-Y growth in EBITDA in the last two half years. EBITDA margin for the IT sector was maintained at a similar level for the last two half years. 4.3. Net profits recorded a good Y-o-Y growth for the IT sector resulting in the highest net profit margin in the entire seven half years under consideration. Leverage ratio (debt to equity or total assets) showed a slight decline in the manufacturing sector (Table 6). Lower contraction in net profits for the manufacturing sector led to an improvement in the solvency ratio in H1:2015-16 as compared to H2:2014-15. Net profits contracted significantly for the services (other than IT) sector, lowering the solvency ratio for H1:2015-16. | Table 6: Financial Ratios (Assets and Liabilities)-Sector-wise | | | Manufacturing | Services (other than IT) | IT | All | | Number of Companies | 1,596 | 424 | 138 | 2,368 | | Debt-equity (in per cent) | | H1:2014-15 | 60.2 | 57.8 | 7.7 | 56.7 | | H2:2014-15 | 62.0 | 56.8 | 8.2 | 57.7 | | H1:2015-16 | 57.9 | 66.9 | 7.8 | 56.8 | | Debt to Total Asset (in per cent) | | H1:2014-15 | 27.2 | 27.0 | 5.6 | 26.4 | | H2:2014-15 | 27.7 | 26.4 | 5.6 | 26.6 | | H1:2015-16 | 26.6 | 29.7 | 5.7 | 26.6 | | Debt to EBITDA (in number of times) | | H1:2014-15 | 4.3 | 4.9 | 0.4 | 4.2 | | H2:2014-15 | 5.5 | 5.0 | 0.4 | 5.0 | | H1:2015-16 | 4.3 | 5.7 | 0.4 | 4.4 | | Current Ratio (in per cent) | | H1:2014-15 | 122.4 | 113.9 | 302.3 | 127.0 | | H2:2014-15 | 119.9 | 114.6 | 248.0 | 125.4 | | H1:2015-16 | 119.1 | 108.8 | 298.2 | 124.9 | | Quick Ratio (in per cent) | | H1:2014-15 | 80.3 | 88.1 | 301.2 | 92.7 | | H2:2014-15 | 79.9 | 90.2 | 246.4 | 92.0 | | H1:2015-16 | 80.1 | 84.4 | 296.2 | 92.1 | | Net Profit to Average* Total Assets (in per cent) | | H1:2014-15 | 2.8 | 0.6 | 9.6 | 2.6 | | H2:2014-15 | 1.6 | 1.3 | 9.2 | 1.9 | | H1:2015-16 | 2.6 | 1.3 | 10.8 | 2.6 | | Solvency ratio (in per cent) | | H1:2014-15 | 15.1 | 6.1 | 165.8 | 13.8 | | H2:2014-15 | 10.9 | 12.2 | 182.9 | 12.1 | | H1:2015-16 | 14.4 | 11.5 | 209.4 | 14.5 | | Interest Coverage Ratio (in number of times) | | H1:2014-15 | 4.0 | 2.8 | 47.7 | 3.7 | | H2:2014-15 | 2.9 | 2.7 | 43.5 | 3.1 | | H1:2015-16 | 3.9 | 2.4 | 55.3 | 3.6 | | Cost of borrowings (in per cent) | | H1:2014-15 | 9.4 | 11.2 | 11.2 | 10.0 | | H2:2014-15 | 9.4 | 9.5 | 10.1 | 10.1 | | H1:2015-16 | 9.3 | 10.1 | 8.9 | 10.3 | | *: Average is based on outstanding opening and closing position of the half year. | 5. EBITDA margins increased across industries despite low / declining sales growth 5.1. In the basic goods sector, sales growth of cement industries decelerated to 2.8 per cent in H1:2015-16 (Chart 4) presumably due to slow down in the construction and real estate sector. EBITDA margin also moderated slightly and remained range-bound for the industry. The Iron & Steel industry posted a contraction in sales by 11.2 per cent (Chart 5) in H1: 2015-16 due to fall in international steel prices.
5.2. In the consumer goods sector, motor vehicles industry witnessed a decrease in sales growth. EBITDA margin recorded an improvement in H1:2015-16 compared to H2:2014-15. In the pharmaceuticals and medicine industry, an increase in sales growth (12.5 per cent) was observed together with an improvement in EBITDA margin (Chart 7). The textile industry showed contraction in sales by 2.8 per cent and since H2:2014-15 remained at the lowest level observed over the previous five half years (Chart 8).
5.3. In the capital goods sector Machinery industry recorded noticeable increase in sales growth in H1:2015-16 after successive moderation in both halves of 2014-15 (Chart 9). EBITDA margin also recorded an increase. 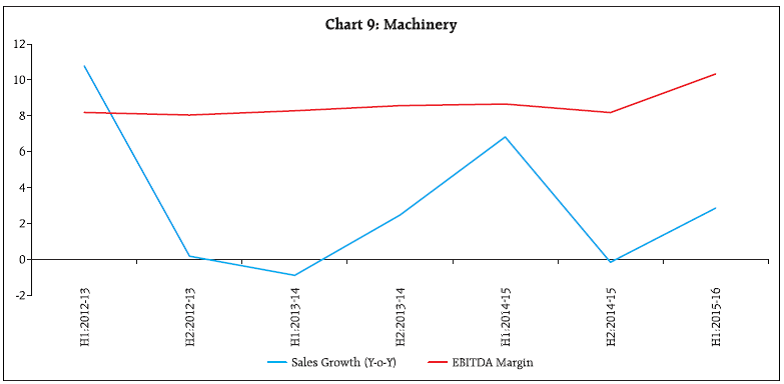
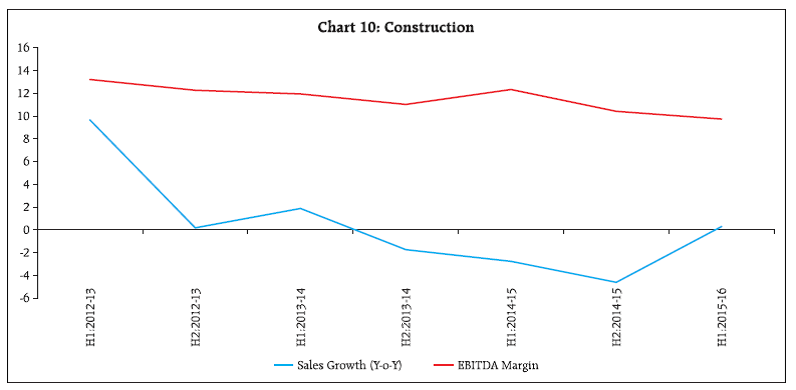
| Table 7: Important Performance Parameters of Select Industries | | Industry | Period | Large | Medium | Small | All Companies | | Sales | EBITDA | Net Profit | Sales | EBITDA | Net Profit | Sales | EBITDA | Net Profit | Sales | EBITDA | Net Profit | | Growth (Y-o-Y) | Margin (Per cent) | Margin (Per cent) | Growth (Y-o-Y) | Margin (Per cent) | Margin (Per cent) | Growth (Y-o-Y) | Margin (Per cent) | Margin (Per cent) | Growth (Y-o-Y) | Margin (Per cent) | Margin (Per cent) | | 1 | 2 | 3 | 4 | 5 | 6 | 7 | 8 | 9 | 10 | 11 | 12 | | Cement | H1:2014-15 | 14.2 | 15.3 | 7.0 | 15.0 | 9.6 | 8.9 | 0.5 | 7.3 | -5.6 | 14.2 | 14.9 | 7.1 | | | H2:2014-15 | 5.6 | 15.2 | 6.3 | 10.6 | 10.9 | 4.9 | -3.0 | 18.0 | 4.3 | 5.9 | 14.9 | 6.2 | | | H1:2015-16 | 2.2 | 14.5 | 4.9 | 10.7 | 11.5 | 2.9 | -6.8 | 11.8 | -0.3 | 2.8 | 14.2 | 4.7 | | Iron & Steel | H1:2014-15 | 10.9 | 18.1 | 5.5 | 0.6 | 4.9 | -4.0 | -32.9 | -2.6 | -26.7 | 9.1 | 16.5 | 4.2 | | | H2:2014-15 | -1.2 | 13.6 | -0.5 | -8.5 | 3.0 | -8.3 | -9.8 | 2.1 | -9.6 | -2.1 | 12.4 | -1.4 | | | H1:2015-16 | -9.7 | 13.4 | 0.7 | -17.9 | 2.8 | -11.4 | -36.7 | 1.3 | -9.9 | -11.2 | 11.9 | -0.9 | | Motor Vehicles | H1:2014-15 | 10.8 | 10.8 | 4.8 | 7.0 | 9.5 | 0.6 | -34.6 | -3.2 | -2.8 | 10.1 | 10.6 | 4.4 | | | H2:2014-15 | 14.1 | 10.6 | 3.2 | -3.5 | 3.8 | -5.3 | -52.0 | -19.3 | -17.0 | 12.0 | 9.9 | 2.5 | | | H1:2015-16 | 12.1 | 13.4 | 7.0 | -1.6 | 8.7 | -0.7 | -44.7 | -86.2 | $ | 10.6 | 12.7 | 5.8 | | Pharmaceuticals | H1:2014-15 | 13.6 | 23.3 | 22.8 | -1.9 | 12.2 | 9.0 | -5.8 | 7.5 | -18.2 | 9.9 | 20.9 | 19.4 | | | H2:2014-15 | 9.5 | 18.5 | 8.2 | -7.1 | 11.6 | -3.7 | -8.6 | 4.8 | -5.3 | 6.0 | 17.1 | 6.0 | | | H1:2015-16 | 16.1 | 25.9 | 16.7 | -2.7 | 15.2 | 4.1 | -12.2 | 1.1 | -8.1 | 12.5 | 24.0 | 14.6 | | Textiles | H1:2014-15 | 8.0 | 13.9 | 3.3 | -1.3 | 6.8 | -1.7 | -12.4 | 4.4 | -10.2 | 4.0 | 11.2 | 1.2 | | | H2:2014-15 | 2.3 | 15.4 | 3.5 | -11.6 | 2.3 | -5.9 | -13.1 | -1.4 | -15.9 | -3.2 | 10.7 | -0.1 | | | H1:2015-16 | 2.6 | 14.8 | 5.5 | -4.2 | 8.2 | 0.0 | -47.8 | -3.6 | -29.8 | -2.8 | 11.8 | 2.4 | | Machinery* | H1:2014-15 | 7.9 | 8.8 | 4.5 | 2.5 | 8.1 | 0.1 | -2.9 | 7.2 | -6.4 | 6.8 | 8.7 | 3.6 | | | H2:2014-15 | -0.1 | 8.1 | 0.4 | 1.9 | 9.2 | 2.7 | -17.8 | 4.1 | -6.8 | -0.2 | 8.2 | 0.6 | | | H1:2015-16 | 3.3 | 10.6 | 5.9 | 3.0 | 9.5 | 2.5 | -15.3 | 4.9 | -5.0 | 2.9 | 10.3 | 5.2 | | Construction | H1:2014-15 | -1.4 | 12.3 | 1.7 | -8.5 | 12.1 | -3.1 | -19.7 | 14.3 | 2.9 | -2.8 | 12.3 | 1.1 | | | H2:2014-15 | -3.6 | 10.9 | 1.9 | -10.7 | 6.7 | -12.2 | -22.0 | 2.4 | -13.8 | -4.6 | 10.4 | 0.3 | | | H1:2015-16 | 2.5 | 9.4 | -0.4 | -14.3 | 12.7 | -3.8 | -17.5 | 10.5 | -1.0 | 0.3 | 9.7 | -0.7 | | *: Includes Machinery & Machine Tools and Electrical Machinery and Apparatus. | 5.4. Construction industry reversed the trend of three successive half yearly contraction in sales. However, the EBITDA margin moderated to 9.7 per cent in H1:2015-16 from 10.4 per cent in H2:2014-15, unlike the general trend of low sales growth with improved profitability observed in other industries. 6. On a quarterly basis, sales growth decelerated, profit margin improved 6.1. An analysis of the performance of listed non-financial private corporates over the quarters reveal that downturn in the aggregate sales growth (Y-O-Y) observed during Q1:2014-15 and Q2:2014-15 continued and contracted further during Q1:2015-16 and Q2:2015-16 (Table 8). With a contraction in the cost of raw materials since Q3:2014-15 and power & fuel expenses since Q4:2014-15, overall expenditure contracted sharper than sales for three consecutive quarters. This aided in boosting the growth in EBITDA and revived profitability of the companies. EBITDA growth improved in Q2:2015-16 significantly as compared to that in the previous quarter. EBITDA margins remained around a five-year high level of 15.2-15.3 per cent during the first two quarters of 2015-16. | Table 8 :Performance of Select Companies over the Quarters | | Indicator | 2014-15 | 2015-16 | | Q1 | Q2 | Q1 | Q2 | | 1 | 2 | 3 | 4 | | No. of Companies | 2,755 | 2,863 | 2,723 | 2,711 | | | Growth (Y-o-Y) Per cent | | Sales | 7.1 | 4.2 | -2.4 | -4.6 | | Expenditure | 6.1 | 3.6 | -3.5 | -7.8 | | Operating Profits (EBITDA) | 16.5 | 8.3 | 3.7 | 8.9 | | Other Income | -2.8 | 26.1 | 1.8 | -5.8 | | Depreciation | 8.0 | 3.5 | 3.6 | 4.0 | | Gross Profits (EBIT) | 14.7 | 14.1 | 3.4 | 6.5 | | Interest | 1.4 | -0.6 | 9.5 | 8.4 | | Net Profits | 27.3 | 25.6 | -9.5 | 9.9 | | | Ratio Per cent | | EBITDA to Sales | 14.1 | 13.2 | 15.2 | 15.3 | | EBIT to Sales | 12.9 | 13.0 | 14.0 | 14.6 | | Net Profit to Sales | 6.7 | 6.6 | 6.7 | 7.7 | | Interest to Sales | 3.8 | 4.0 | 4.5 | 4.4 | | Interest Burden | 29.2 | 31.0 | 31.9 | 30.3 | | Interest Coverage(times) | 3.4 | 3.2 | 3.1 | 3.3 | 6.2. Y-O-Y growth in interest expenses started to escalate since Q3:2014-15 and showed considerable rise in Q1 and Q2 of 2015-16 as compared with the first two quarters of 2014-15. But it remained at a lower level than that earlier observed during 2012-13 and 2013-14. Interest coverage ratio (EBIT/interest expenses) was almost at the similar level, improving marginally in Q2 as compared with Q1:2015-16. Net profit margin stood at a 18 quarter high level of 7.7 per cent in Q2:2015-16.
Annex Explanatory Notes 1. To compute the growth rates in any period, a common set of companies for the current and previous period is considered. 2. Sector and Industry wise figures may vary slightly from earlier data released, as the industry classification system has been updated broadly following the National Industrial Classification (NIC 2008). 3. The manufacturing sector consists of industries like ‘Iron and Steel’, ‘Cement and Cement Products’, ‘Machinery and Machine Tools’, ‘Motor Vehicles’, etc. This does not include ‘Agriculture and Related Activities’ and ‘Mining & Quarrying’ industries. The services (non-IT) sector includes ‘Real Estate’, ‘Wholesale and Retail Trade’, ‘Hotel and Restaurants’, etc. This does not include ‘Construction’ and ‘Electricity and Gas - Supply’ industries. 4. FOREX gain and loss are reported on net basis by companies and included in the net profit calculation. While net FOREX loss is considered as a part of the expenditure and thus included in EBITDA, net FOREX gain is considered as a part of other income and included in EBIT. 5. Other income includes various regular incomes like rents, dividends, royalties etc. and does not include extra-ordinary income/expenses. 6. Extra-ordinary income/expenses are included in EBT and net profit. As the name suggests, these income/ expenses can be very large for some of the companies in a particular quarter. 7. Some companies report interest on net basis. However, some companies include the interest expenses on gross basis, where, interest received is reported in other income. 8. ‘$’ (across all tables) indicates that the ratio / growth rate is not calculated as denominator is negative or negligible. Glossary of Terms | EBITDA | - | Operating Profits / Earnings before Interest, Tax, Depreciation & Amortization | - | Sales + Change in Stock – Expenditure | | EBIT | - | Gross Profits/Earnings before Interest & Tax | - | EBITDA+ Other Income – Depreciation & Amortisation | | EBT | - | Earnings before Tax | - | EBIT – Interest Payment +Extra-ordinary income/expenses | | Net Profit | - | | - | EBT – Tax | | Interest Burden | - | | - | Interest Payment / EBIT*100 | | Interest Coverage | - | | - | EBIT/Interest Payment | | Debt | - | | - | Short Term Borrowings + Long Term Borrowings | | Current Ratio | - | | - | Current Assets / Current Liabilities*100 | | Quick Ratio | - | | - | (Current Assets – Inventories) / Current Liabilities*100 | | Solvency Ratio | - | | - | (Net Profit + depreciation)/ Average borrowings*100 |
|