Shri Bhatt and distinguished participants, I am deeply
honoured to be invited to deliver the valedictory address at the High Powered
Macroeconomic Workshop organised by the State Bank of India. I am particularly
gratified that this Workshop has become a reality, since its genesis is in the
extremely useful discussions that we in the Reserve Bank of India had with the
Indian Banks’ Association as part of pre-Annual Policy consultations held
in April this year.
The success of any monetary policy formulation is
dependent on successful communication between the central bank and all market
participants. The effectiveness of communication would be greatly enhanced
if there is deeper understanding among participants of all the reasoning and the
process that goes behind policy making. So we greatly value this initiative
that you have taken.
On July 31, we set out our first quarter review
of the annual policy and you are all aware of the response of financial markets
and the banking and financial system to our announcement. Today, I propose
to move away from the minutiae of the policy review and share with you my thoughts
on the underlying macroeconomics and the unfolding of expectations for the period
ahead.
I propose to structure my address by beginning with an overview
of domestic and global macroeconomic developments that conditioned our assessment
and response on July 31. My approach will be to compare the current situation
with that prevailing in April 2007 i.e., at the time of the Annual Policy Statement,
in order to highlight the changes that have taken place within the Indian economy
but more perceptibly, in the international environment. Against this backdrop,
I will try to set out the key elements of our assessment of underlying developments,
the complexities and the challenges. Finally, I will draw upon the rationale emerging
from this assessment to explain the stance of the first quarter review.
I. Overview of Macroeconomic Developments – Then and Now
You will all recall that the Annual Policy Statement of April 2007 was
formulated at a time when the Indian economy was seen to be facing the intensification
of demand pressures which, coupled with supply constraints, were showing up in
inflation (as measured by the Wholesale Price Index (WPI)), ruling above 6 per
cent through the preceding quarter (January-March, 2007). Consumer price
inflation was even higher. There was also expectation internationally at
that time that the global economy was moderating after unusually high growth in
the last few years. However, some volatility had been observed in international
financial markets and there was some expectation of repricing of risks, and its
potential effects on financial markets. Overall, while prospects for growth
continued to be favourable, monetary authorities around the world were showing
an inclination to be watchful about risks to price and financial stability.
By late July, while the evolution of macroeconomic and financial developments
was broadly on track, with some upward revisions about growth prospects, there
are some incipient shifts taking place in sentiment, liquidity and market conditions,
particularly in the presence of some volatility in financial markets. Policy
responses of central banks across the world have acquired a tone of increased
caution. (a) Domestic Developments
In February 2007 i.e., prior to the Annual Policy Statement,
the CSO had placed real GDP growth at 9.2 per cent in 2006-07. By the time
of the first quarter review, the CSO had revised this estimate to 9.4 per cent,
indicative of the improvement in aggregate supply conditions, but also pointing
to the firming up of demand pressures. In the first quarter of 2007-08, some supply
conditions seem to have improved. The arrival of the rabi harvest,
a satisfactory south-west monsoon so far and a slow catch-up in kharif sowing
provides grounds for optimism regarding agricultural performance this year.
Activity in the industrial and services sectors has continued apace, though there
seems to have been some moderation in specific sectors. In the disposition
of aggregate demand, however, there appear to be signs of some shifts underway.
Although the demand for consumer non-durables has picked up, the coincident high
growth in capital goods and non-oil imports, secondary effects on intermediate
goods and stretched capacity utilisation together suggest that investment demand
could be intensifying. There seems to be a general optimism about India’s
growth prospects in projections made by various agencies; some agencies have taken
the lead in initiating upward revisions (Table 1).
Table
1: Projections of Real GDP for India by various Agencies: 2007-08 |
(Per
cent) | Agency | Overall
Growth | Agriculture | Industry | Services | Month
of
Projection | 1 | 2 | 3 | 4 | 5 | 6 |
ABN Amro | 7.6 | – | – | – | March
2007 | Asian Development
Bank | 8.0 | – | – | – | March
2007 | Confederation
of Indian Industry (CII) | 8.5 | 3.0 | 9.3 | 9.9 | April
2007 | | 9.2 | 3.0 | 9.4 | 11.2 | July
2007 | Centre for Monitoring
the Indian Economy (CMIE) | 8.5 | – | – | – | June
2007 | Citigroup | 9.3 | 3.0 | 10.3 | 10.9 | April
2007 | CRISIL | 7.9-8.4 | 3.0 | 8.4-9.1 | 9.3-9.9 | March/ |
| | | | | June
2007 | Economic Advisory
Council to the Prime Minister | 9.0 | 2.5 | 10.6 | 10.4 | July
2007 | ICRA | 8.5 | – | – | – | April
2007 | Indicus Analytics | 8.4 | 3.0 | 7.9 | 9.7 | April
2007 | International
Monetary Fund | 8.4*
9.0* | – | – | – | April
2007
July 2007 | JP
Morgan | 8.0 | – | – | – | March
2007 | Organisation
for Economic Cooperation
and Development (OECD) | 8.5 | – | – | – | May
2007 | National Council
for Applied
Economic Research (NCAER) | 8.3 | 2.6 | 8.7 | 9.9 | April
2007 | Reserve Bank
of India | 8.5 | – | – | – | April 2007/
July 2007
| Median Projection
(Q1 Review) |
8.5 | Median
Projection (Annual Policy Statement |
8.4 | –
: Not Available.
* : Calendar Year. | Within this overall picture
of the real economy, headwinds to growth seem to be reshaping the outlook. While
corporate performance continues to be buoyant as assessed in April, there is some
deceleration in corporate sales and profitability growth on a year-on-year basis
as also increases in input and staff costs. There is some indication of
a turn in business sentiment with the optimism reflected in various surveys conducted
at the time of the Annual Policy Statement having been moderated by rising cost
expectations, strained capacities and the impact of recent exchange rate movements,
particularly in IT, commercial vehicles, auto parts and cement.
The key monetary
and banking aggregates are exhibiting somewhat perging profiles. Money supply
is running well above the indicative path given in the Annual Policy Statement
in April, driven up by the expansion in reserve money and high growth in deposits.
With banks having launched aggressive mobilisation strategies, presumably in response
to the high credit demand of the last few years, there has been high growth in
aggregate deposits in the banking system. Consequent to the lagged and cumulative
effects of monetary measures taken since September 2004, there has been some slackening
of non-food credit growth. Banks SLR portfolios (at 28.7 per cent of NDTL on July
6) have increased. This will help them to mitigate balance sheet risks and
also allow for better liquidity management. The deceleration in credit demand
has been localised in the commercial real estate, housing and retail segments.
On the other hand, the pick up in bank credit to agriculture and industry is favourable
to sustaining the growth momentum (Table 2).
Table 2: Deployment of Non-food Bank Credit |
(Amount in Rupees crore) |
Sector/Industry |
Outstanding as on
May
25, 2007 |
Year-on-Year Variation |
|
May 26, 2006 |
May 25, 2007 |
|
Absolute |
Per cent |
Absolute |
Per cent |
1 |
2 |
3 |
4 |
5 |
6 |
Non-food Gross Bank Credit (1 to 4) |
17,52,349 |
3,10,316 |
32.2 |
3,65,814 |
26.4 |
1. |
Agriculture and Allied Activities |
2,22,042 |
42,122 |
35.0 |
54,038 |
32.2 |
2. |
Industry (Small, Medium and Large) |
6,76,440 |
98,947 |
26.4 |
1,41,280 |
26.4 |
|
Small Scale Industries |
1,15,884 |
14,863 |
20.3 |
26,387 |
29.5 |
3. |
Personal Loans |
4,55,439 |
– |
– |
87,944 |
23.9 |
|
Housing |
2,30,751 |
– |
– |
41,066 |
21.6 |
|
Advances against Fixed Deposits |
39,092 |
6,076 |
22.9 |
6,237 |
19.0 |
|
Credit Cards |
14,221 |
– |
– |
4,411 |
45.0 |
|
Education |
15,438 |
– |
– |
4,903 |
46.5 |
|
Consumer Durables |
8,831 |
-1,103 |
-13.3 |
1,661 |
23.2 |
4. |
Services |
3,98,428 |
– |
– |
82,551 |
26.1 |
|
Transport Operators |
25,321 |
– |
– |
7,922 |
45.5 |
|
Professional and other Services |
24,834 |
– |
– |
8,999 |
56.8 |
|
Trade |
1,05,536 |
– |
– |
23,319 |
28.4 |
|
Real Estate Loans |
46,295 |
– |
– |
19,010 |
69.7 |
|
Non-Banking Financial Companies |
44,425 |
11,564 |
64.0 |
12,401 |
38.7 |
– : Not available.
Note:
1. Data are provisional and relate to select scheduled commercial banks.
2. Owing to change in classification of sectors/industries and coverage of banks, data for 2006
onwards are not comparable with the earlier periods.
Source : Reserve Bank of India. |
The combination of
rising deposit growth and moderation of non-food credit growth is contributing
to the prevalence of excess liquidity conditions in the financial markets.
With the imposition of a ceiling of Rs.3,000 crore on daily LAF reverse
repos since March 5, 2007, the summary measure of the liquidity overhang, i.e.,
the sum of LAF, MSS and outstanding cash balances of the government, did not fully
capture the counterpart liquidity shifts in the market during this period
as the net position in the LAF presents only a partial picture. A large
part of the liquidity that would have otherwise been absorbed under the LAF is
currently showing up in excess CRR balances and in banks’ investments in
money market mutual funds. On the other hand, the transfer of funds from
the Government to the Reserve Bank on account of the sale of the Reserve Bank’s
stake in the State Bank of India has had the indirect effect of impounding market
liquidity on a temporary basis. Thus, new factors have been impinging the assessment
of liquidity in recent weeks, which has been reflected in the behaviour of overnight
market rates and in the Reserve Bank’s liquidity management operations (Table
3).
Table 3: Reserve Bank's Liquidity Management Operations |
(Rupees crore) |
Item |
2006-07 |
2006-07 |
2007-08 |
(April-
March) |
Q1 |
Q2 |
Q3 |
Q4 |
April |
May |
June |
1 |
2 |
3 |
4 |
5 |
6 |
7 |
8 |
9 |
A. |
Drivers of Liquidity (1 to 5) |
61,739 |
36,247 |
-16,896 |
-25,641 |
68,028 |
34,179 |
12,797 |
N.A. |
|
1. |
RBI’s net Purchases from |
|
|
|
|
|
|
|
|
|
|
Authorised Dealers |
1,18,994 |
21,545 |
0 |
22,461 |
74,988 |
8,835 |
5,779 |
N.A. |
|
2. |
Currency with the Public |
-70,352 |
-19,648 |
-1,270 |
-27,033 |
-22,400 |
-19,953 |
-1,007 |
8,498 |
|
3. |
Surplus Cash Balances of the |
|
|
|
|
|
|
|
|
|
|
Centre with the Reserve Bank* |
-1,164 |
40,207 |
-26,199 |
-30,761 |
15,590 |
49,992 |
0 |
0 |
|
4. |
WMA/Overdraft to the Centre |
0 |
0 |
0 |
0 |
0 |
980 |
6,773 |
7,406 |
|
5. |
Others (residual) |
14,260 |
-5,856 |
10,574 |
9,693 |
-150 |
-5,676 |
1,252 |
N.A. |
B. |
Management of Liquidity (6 to 9) |
-24,257 |
-39,003 |
32,026 |
31,625 |
-48,905 |
-39,879 |
-24,451 |
10,387 |
|
6. |
Liquidity Impact of LAF Repos |
36,435 |
-35,315 |
40,650 |
33,600 |
-2,500 |
-19,189 |
-5,306 |
4,205 |
|
7. |
Liquidity Impact of OMO (Net)@ |
720 |
545 |
145 |
25 |
5 |
10 |
0 |
0 |
|
8. |
Liquidity Impact of MSS |
-33,912 |
-4,233 |
-8,769 |
4,750 |
-25,660 |
-12,950 |
-11,395 |
6,182 |
|
9. |
First Round Liquidity Impact |
|
|
|
|
|
|
|
|
|
|
due to CRR change |
-27,500 |
0 |
0 |
-6,750 |
-20,750 |
-7,750 |
-7,750 |
0 |
C. |
Bank Reserves (A+B) # |
37,482 |
-2,756 |
15,130 |
5,984 |
19,123 |
-5,700 |
-11,654 |
15,047 |
N.A. : Not available.
(+) : Indicates injection of liquidity into the banking system.
(-) : Indicates absorption of liquidity from the banking system.
* : Excludes minimum cash balances with the Reserve Bank in case of surplus.
# : Includes vault cash with banks and adjusted for first round liquidity impact due to CRR change.
@ : Adjusted for Consolidated Sinking Funds (CSF) and including private placement.
Note: For end-March, data pertain to March 31: for all other months, data pertain to last Friday. |
In the financial markets, the shifts in liquidity flows between the first quarter
of 2007-08 and the preceding quarter have imparted considerable volatility.
Overnight rates have been close to zero for a prolonged period of time (Chart
1). These have been caused by the cumulative impact of the unwinding
of government cash balances, excess capital flows, and high deposit growth.
In the Government securities market, there is reasonable stability but the yield
curve seems to be indicating that excess liquidity conditions in the short term
segment was beginning to effect longer term yields. The forex market is
experiencing continuous upward pressures on the spot exchange rate and forward
premia have declined across maturities. Chart
1: Liquidity Adjustment Facility and the Call Rate 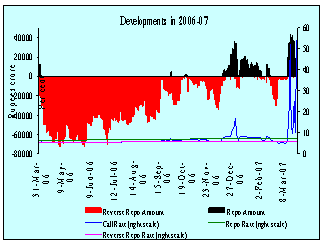 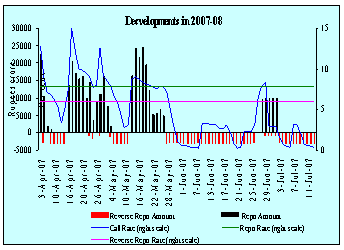
The
most important change between April and now is in inflation conditions.
It may be recalled that in January 2007, the resolve of monetary policy was stated
as returning inflation to within the policy tolerance threshold on a priority
basis. Against the backdrop of the spike in WPI inflation in January and
the persistence in the hardening of consumer prices, this stance was reinforced
in April. The combination of monetary, fiscal and supply management measures appears
to have had a salutary effect on inflation expectations and from end-May there
has been a distinct easing of inflation in terms of the headline. Yet, inflation
pressures appear to be ruling firmly. Excluding the decline in energy prices
since February, WPI inflation continues to be above 6 per cent. Excluding
food and energy prices, inflation would still be above the headline. Inflation
in terms of consumer prices is still in the range of 5.7-7.8 per cent. Besides,
global prices of key food grains such as wheat and rice, and of oilseeds and livestock
products are at historically elevated levels, igniting international concern on
the effect of these prices on overall inflation. With food having a higher
weight in price indices in developing countries, this development is of particular
concern to countries such as ours. International crude prices are high and
volatile with expectations that they would remain at these levels through 2007.
These factors would have a definite bearing on the manner in which the inflation
outlook in India evolves over the months to come. Inflation concerns remain
with us and thus our vigil on inflation must continue. There are no grounds for
complacency on this account.
The balance of payments outlook remains
strong and resilient between April and now. A sharper than expected increase in
non-oil imports has resulted in a widening of the merchandise trade deficit in
the early months of 2007-08. The key difference between expectations and outlook
relating to the external sector is the magnitude of capital inflows received so
far. In reflection, the foreign exchange reserves have gone up by nearly US $
23 billion during April-July 20, which is already nearly half of the entire reserve
accretion during the year 2006-07. By current indications, managing capital flows
and consequently, liquidity will be the main challenge facing monetary policy
in 2007-08.
(b) Global Developments
The key change in the global outlook between April and July is the upward revision
by the IMF in global growth forecasts for 2007 and 2008 from 4.9 per cent to 5.2
per cent. This upward revision is expected to be shared by all major mature
economies, barring the US, as well as the emerging market economies (EMEs), particularly
China and India. In the EMEs which are progressively increasing their contribution
to global growth, the prospects are strong but embedded with risks of overheating,
volatile crude prices, leveraged international financial markets and persisting
global imbalances. In China, in particular, there have been rising concerns,
as stated by their highest authorities, that the growth process could have the
potential of becoming unstable and unsustainable. Inflation concerns have become
renewed on the back of the flare up of crude prices alongside elevated levels
of food and metal prices (Table 4).
Table 4: International Commodity Prices |
Commodity |
Unit |
2004 |
Index |
Variation (per cent) |
2004 |
2005 |
2006 |
2007 |
June 2007/
March 2007 |
June 2007/
June 2006 |
January-
June |
March |
June |
1 |
2 |
3 |
4 |
5 |
6 |
7 |
8 |
9 |
10 |
11 |
Coal |
$/mt |
53.0 |
100 |
90 |
93 |
105 |
105 |
114 |
9.0 |
15.3 |
Crude oil (Average) |
$/bbl |
37.7 |
100 |
142 |
170 |
163 |
161 |
181 |
12.5 |
-0.1 |
Palm oil |
$/mt |
471.3 |
100 |
90 |
102 |
146 |
132 |
171 |
29.7 |
84.7 |
Soybean oil |
$/mt |
616.0 |
100 |
88 |
97 |
122 |
117 |
135 |
15.7 |
38.3 |
Soybeans |
$/mt |
306.5 |
100 |
90 |
88 |
107 |
105 |
118 |
12.1 |
35.2 |
Rice |
$/mt |
237.7 |
100 |
120 |
128 |
133 |
134 |
136 |
1.4 |
3.5 |
Wheat |
$/mt |
156.9 |
100 |
97 |
122 |
129 |
127 |
142 |
12.0 |
14.2 |
Sugar |
c/kg |
15.8 |
100 |
138 |
206 |
140 |
146 |
130 |
-11.0 |
-39.7 |
Cotton A Index |
c/kg |
136.6 |
100 |
89 |
93 |
93 |
94 |
94 |
0.0 |
5.9 |
Aluminium |
$/mt |
1716.0 |
100 |
111 |
150 |
162 |
161 |
156 |
-3.1 |
8.1 |
Copper |
$/mt |
2866.0 |
100 |
128 |
235 |
237 |
225 |
261 |
15.8 |
3.8 |
Gold |
$/toz |
409.2 |
100 |
109 |
148 |
161 |
160 |
160 |
0.1 |
10.0 |
Silver |
c/toz |
669.0 |
100 |
110 |
173 |
199 |
197 |
196 |
-0.2 |
22.0 |
Steel cold-rolled coil/sheet |
$/mt |
607.1 |
100 |
121 |
114 |
107 |
107 |
107 |
0.0 |
0.0 |
Steel hot-rolled coil/sheet |
$/mt |
502.5 |
100 |
126 |
119 |
109 |
109 |
109 |
0.0 |
-4.3 |
Tin |
c/kg |
851.3 |
100 |
87 |
103 |
158 |
163 |
166 |
1.5 |
78.6 |
Zinc |
c/kg |
104.8 |
100 |
132 |
313 |
340 |
312 |
344 |
10.1 |
11.7 |
$ : US dollar. c: US cent. bbl: barrel. mt: metric tonne. kg: Kilogram. toz: troy oz.
Source: Based on World Bank's actual commodity price data.
The year 2004 has been taken as the base to better exhibit price trends over the relevant period. |
Global financial markets,
which faced major episodes of turbulence in May-June, 2006 and again in February
2007, seem to be experiencing heightened volatility again in July due to the fall
in confidence related to the adverse developments in the US subprime mortgage
market transmitted to other segments through the highly leveraged activities of
hedge funds and private equity funds. Even as financial markets are repricing
risks, there continues to be a compression of risk spreads and an ever widening
search for returns, interrupted by sporadic flights to safety. While there
seem to be signs of some abatement in the carry trade, there are persisting uncertainties
and EMEs, in particular, need to be on guard against the manner in which carry
trades unfold. Perhaps, the most volatile segments have been currency and
equity markets with increasing linkages and potential vulnerability to contagion
effects.
In response to these developments, several monetary authorities
have continued to display a readiness to tighten monetary policy further in reinforcement
of their stance in April. Central banks in EMEs have supported the withdrawal
of monetary accommodation with successive increases in cash reserve requirements
and in the application of non-monetary measures. In India and China, in
particular, the use of cash reserve requirements has been more frequent than in
other EMEs (Table 5).
Table 5 : Cash Reserve Ratio
(per cent) |
China |
India |
Effective |
CRR |
Effective |
CRR |
Sept-21,2003 |
7.00 |
Jun-14,2003 |
4.50 |
April-25,2004 |
7.50 |
Sep-18,2004 |
4.75 |
July-5,2006 |
8.00 |
Oct-2,2004 |
5.00 |
Aug-15,2006 |
8.50 |
Dec-23,2006 |
5.25 |
Nov-15,2006 |
9.00 |
Jan-6,2007 |
5.50 |
Jan-15,2007 |
9.50 |
Feb-17,2007 |
5.75 |
Feb-25,2007 |
10.00 |
March-3,2007 |
6.00 |
April-15,2007 |
10.50 |
April-14,20007 |
6.25 |
May-15,2007 |
11.00 |
April-28,2007 |
6.50 |
June-5,2007 |
11.50 |
Aug-4, 2007 |
7.00 |
Aug-15,2007 |
12.00 |
|
|
Thus, central banks across the world remain hawkish with respect to
inflation and prepared to act against any signs of instability developing.
Where they have paused, as in the US, they have done so on the back of sustained
prior action. The outlook on inflation continues to drive the response of
central banks (Table 6).
Table
6: Key Macroeconomic Indicators: Emerging Markets |
(Per cent) |
Country | Consumer
Price
Inflation | Current
Account
Balance
(per cent to GDP) | Real
Effective
Exchange Rate (REER) | Central
Govt. Fiscal
Balance
(per cent of GDP) | Real
Policy
Rate | Real
GDP
Growth | June
2006 | June
2007 | 2005 | 2006 | June
2006 | June
2007 | 2005 | 2006 | July
2006 | July
2007 | 2005 | 2006 |
1 | 2 | 3 | 4 | 5 | 6 | 7 | 8 | 9 | 10 | 11 | 12 | 13 |
Brazil | 4.0 | 3.7 | 1.6 | 1.3 | 6.8 | 13.7 | -3.4 | -3.2 | 10.8 | 7.8 | 2.9 | 3.7 |
China | 1.5 | 4.4 | 7.2 | 9.1 | 1.6 | 4.7 | -1.3 | -0.7 | 4.9 | 2.4 | 10.4 | 11.1 |
| | | | | | | (17.9) | (17.3) | | | | |
India
| 6.3 | 5.7 | -1.1 | -1.1 | -4.8 | 12.0 | -4.1 | -3.5 | 0.3 | 2.1 | 9.0 | 9.4 |
| (5.2) | (4.3) | (-6.4) | (-7.1) | | | (63.9) | (63.4) | (2.3) | (3.3) | | |
Indonesia | 15.5 | 5.8 | 0.1 | 2.7 | 14.6 | 6.1 | -0.5 | -1.0 | -3.0 | 2.5 | 5.7 | 5.5 |
| | | | | | | (46.5) | (40.9) | | | | |
Israel | 3.5 | -0.7 | 2.9 | 5.2 | -0.8 | -0.8 | -2.9 | -2.7 | 2.9 | 4.2 | 5.2 | 5.1 |
Korea | 2.4 | 2.5 | 1.9 | 0.7 | 5.2 | 0.9 | 1.9 | 1.8 | 2.0 | 2.3 | 4.2 | 5.0 |
| | | | | | | (29.5) | (32.2) | | | | |
Philippines | 6.7 | 2.3 | 2.0 | 2.9 | 7.5 | 14.3 | -2.7 | -1.0 | 1.1 | 3.7 | 5.0 | 5.4 |
Russia | 9.1 | 8.5 | 10.9 | 9.8 | 10.0 | 4.6 | 7.5 | 7.5 | 2.2 | 1.5 | 6.4 | 6.7 |
South Africa | 3.9 | 6.9
* | -3.8 | -6.4 | -3.0 | -2.1 | -- | -- | 2.5 | 2.6 | 5.1 | 5.0 |
Thailand | 5.9 | 1.9 | -4.5 | 1.6 | 9.6 | 8.9 | 0.2 | 0.1 | 0.6 | 1.4 | 4.5 | 5.0 |
| | | | | | | (26.1) | (27.3) | | | | |
*: May.
Note :
1. For India, data pertain to fiscal years 2005-06 and
2006-07.
2. Consumer price inflation data are on a year-on-year basis.
Data for India are for CPI-Industrial Workers.
3. Real policy rate is
the policy rate less year-on-year consumer price inflation. For India, repo
rate is used.
4. Figures in parentheses in columns (2) and (3) refer to wholesale
price inflation.
5. Figures in parentheses in columns (4) and (5) refer to
trade balance/GDP ratio.
6. Data on fiscal balance for Korea and Israel
pertain to general government balance.
7. Figures in parentheses in columns
(8) and (9) refer to central government debt/GDP ratio.
For China, data
refer to public sector debt.
8. Figures in parentheses in columns (10) and
(11) for India are based on wholesale price inflation.
9. Data on REER refer
to year-on-year variation in broad indices (CPI-based) compiled by the
Bank
for International Settlements.
A positive figure indicates appreciation
while a negative figure indicates depreciation.
For India, data are
based on movements in 6-currency indices.
Source: International Monetary Fund,
Asian Development Bank.
Bank for International Settlements, World Bank
and official websites of respective central banks. | One
key issue that many of the key Emerging Market Economies (EMEs) are facing is
the issue of excess forex flows, both because of a current account surplus in
most cases, and additional capital flows. In this regard, the key difference between
India and most of these economies is the existence of a current account deficit,
though modest, along with a significant merchandise trade deficit which is now
in excess of 7 per cent of GDP. Most of these countries, along with us, have experienced
significant real exchange rate appreciation over the last year or two. So the
practice of monetary management has encountered significant complexity in a number
of EMEs. We are not alone. We may note that we have so far been managing
this complexity relatively successfully within the context of high economic growth,
high credit growth, a reasonable degree of price stability and most importantly
maintenance of financial stability. The quality of bank balance sheets has been
improving on a continuous basis, and we are hopeful that they will reach international
best practice soon. It is interesting to observe that, just like us, many
of these countries have been using the whole range of monetary instruments, including
direct sterilisation through issuance of government or central bank bonds, increases
in reserve requirements, and different means of capital account management to
manage the monetary impact of excess forex flows. The overall problem of the capital
flows, both from the point of view of the monetary management of EMEs and reverse
capital flows to industrialised countries, is now receiving worldwide attention.
The Committee of Global Financial System (CGFS) under the aegis of BIS has also
appointed a Working Group to look into these complex issues.
II.
Macroeconomics of Policy Assessment Domestic macroeconomic prospects
are currently seen to be broadly favourable, with the pace of growth being maintained
and the inflation outlook softer. As already stated, however, the attendant risks
from global developments relating to food, commodity, and energy prices remain
and will have to be monitored carefully, and acted upon as necessary. In
an overall perspective, the main objective of policy as set out in April, is to
manage the transition to higher growth with price and financial stability. The
key issues for the conduct of monetary policy in the context of this objective
are a continuing emphasis on price stability and well anchored inflation expectations.
This will involve managing liquidity in the presence of the pressures from high
deposit growth, shifts in government cash balances and continuing capital flows.
The flux in global financial markets is a clear and present danger to stability
for which policy makers and all stake holders have to be well prepared. Exchange
rate movements have become amplified by these developments. Going forward,
it will be necessary to reinforce the commitment to financial stability alongside
the containment of inflation so as to support growth. The Reserve Bank's
Annual Policy statement had announced the initiation of further development of
financial markets, such as the work related to currency futures, interest rate
futures and credit default swaps. Our annual publication, Report on Currency
and Finance has, this year, paid particular attention to the overall development
of financial markets in some detail. The key element of our approach is
the maintenance of financial stability, along with the continuous development
of markets.
Against this backdrop and a careful assessment of the balance
of risks, the projection of real GDP growth for 2007-08 has been retained around
at 8.5 per cent as in the Annual Policy Statement. A key assumption is that
agriculture will post a return to trend growth and the momentum will be maintained
in industry and services. While the outlook for inflation remains unchanged, the
policy priority in the first quarter review is to hold headline inflation within
5 per cent in 2007-08 and within 4.0 - 4.5 per cent over the medium term.
While money supply and aggregate deposits are currently high, moderating the growth
of these key aggregates has assumed policy priority. Early indications suggest
that the balance of payments position is strong, that the current account deficit
will be managed within sustainable limits but the uncertainties and volatility
associated with capital flows will test the evolving policy stance.
While the domestic outlook is positive and should remain so with appropriate corrections
in liquidity and financial market conditions to align them with the policy stance,
it is the global outlook which presents the greatest threats to growth with stability
in India. The conduct of monetary policy must ensure that the gains of strong
macroeconomic performance are not lost in the cross currents of global financial
markets and the periodic episodes of volatility of turbulence which have world
wide ramifications. It is in this context that the Reserve Bank has reinforced
the emphasis on price stability and financial stability in the first quarter review
with a view to supporting growth by contributing stability. To sum up, therefore,
inflation risks and potential dangers of financial market turbulence dominate
the macroeconomics of current policy assessment.
III.
The Policy Response The operating framework of monetary management
is rendered complex, particularly in a developing economy such as ours which
is undergoing significant financial deepening and structural change. The relationship
between real economy variables such as GDP growth and monetary aggregates is subject
to constant change. Similarly, the relationships between different monetary aggregates
themselves such as broad money (M3), narrow money (M1) and reserve
money (M0) is also subject to continuous change. It is for this reason that we
have to operate policy flexibly, leading to some impressions of lack of transparency.
Our overall job is to maintain price stability in the presence of the existing
scenario of welcome accelerated growth, along with the maintenance of financial
stability of the system. It is our firm judgement that low and stable inflation
is essential to maintenance of the growth process and we are determined to achieve
this continuing goal. Similarly, in a low income country such as ours, we also
believe that the ability of market participants, ranging from far flung subsistence
farmers to the ultra sophisticated financial market players, such as you, is much
more varied than in a developed country. The costs of risks unfolding are asymmetric,
so we have to place a higher weight on the maintenance of financial stability
than in a developed country, as we pursue overall growth and associated financial
market development. The stance of monetary policy in the first quarter review
assigns a higher priority for managing appropriate liquidity in the financial
markets while maintaining the intensive vigil on price and financial stability.
The Reserve Bank has articulated its approach to liquidity management in the form
of “appropriate use of CRR stipulations, open market operations including
MSS and LAF and all policy instruments at its disposal flexibly, as and when the
situation warrants”.
In view of the surplus conditions in the financial
markets, the ceiling on daily reverse repos under the LAF has been removed.
The objective is to absorb excess liquidity and align overnight rates with the
prevailing monetary policy stance so that policy signals are efficiently and transparently
passed through into the structure of interest rates, aggregate demand and thereby,
growth and stability. The restoration of the informal LAF corridor should help
in stabilising overnight rates and smoothing volatility. The key policy
rates have been kept unchanged. The cash reserve ratio has been raised by
50 basis points to 7 per cent in the first quarter review with a view to impounding
liquidity generated by excessive deposit growth in the banking system. The
CRR is expected to work in conjunction with the restoration of the LAF corridor
to ensure appropriate liquidity conditions in the economy. The policy stance
will be under careful and continuous review and the mix of instruments will be
modulated by the evolving situation. To reflect the Reserve Bank’s
point of view at the present time, the stance of policy for the period ahead has
been enunciated as:
• To reinforce the emphasis on price
stability and well-anchored inflation expectations while ensuring a monetary and
interest rate environment that supports export and investment demand in the economy
so as to enable continuation of the growth momentum.
• To
re-emphasise credit quality and orderly conditions in financial markets for securing
macroeconomic and, in particular, financial stability while simultaneously pursuing
greater credit penetration and financial inclusion.
• To respond
swiftly with all possible measures as appropriate to the evolving global and domestic
situation impinging on inflation expectations, financial stability and the growth
momentum.
Once again, I congratulate Shri Bhatt and the State Bank of
India for organising this extremely useful and illuminating workshop. Thank
you.
Valedictory Address by Dr. Rakesh Mohan, Deputy Governor, Reserve Bank of India on August 3, 2007at the Workshop for Top Executives of Banks on Macroeconomic Issues and their Relevance to the Banking System organised by the State Bank of India. Assistance of M.D. Patra and Indranil Bhattacharya in preparing the speech is gratefully acknowledged. |