|
It is my great pleasure to be here
at the 2nd Annual Indian Securities Infrastructure & Operations
Forum 2006. The recent growth momentum of the Indian economy is leading to renewed
interest in India’s growth prospects. As the mid-year review of the annual policy
is just over I thought instead of giving just a run-down of the current state
of the Indian economy let me put the current trends into a broader perspective
- both with respect to the longer term trend and as well as the global scenario.
Thus, I will proceed as follows:
- In order to draw appropriate perspectives for
the future of the Indian economy, I will first present an overview of India’s
economic progress over the past three decades.
- Given the growing integration of the Indian
economy with the rest of the world, I will then discuss the prospects of the
global economy.
- This will be followed by an assessment of the
current economic situation in India.
- Finally, I will discuss some of the issues necessary
to accelerate the current growth momentum.
I. Overview of Longer-Term Trends
Growth, Savings and Investment
Following the initiation of structural
reforms in the early 1990s, the Indian economy has grown at an annual average
rate of over 6 per cent per annum. While the 1980s had also witnessed high growth
(5.8 per cent per annum), this growth was associated with widening macroeconomic
imbalances – growing fiscal deficits, growing current account deficits, falling
international reserves and higher inflation – culminating in the balance of
payments crisis of 1990-91. In contrast, not only has been there an acceleration
in growth from 5.8 per cent during the 1980s to 6.4 per cent between 1992-93
and 2005-06, it has also been achieved in an environment of macroeconomic and
financial stability, despite large exogenous shocks, both internal and external,
over this period (Table 1).
|
Table 1 : India’s Real GDP
Growth
|
|
Period
|
Average Annual
Growth (%)
|
Coefficient
of Variation
|
|
1
|
2
|
3
|
|
1970s
|
2.9
|
1.42
|
|
1980s
|
5.8
|
0.39
|
|
1990s
|
5.8
|
0.32
|
|
2000-2006
|
6.4
|
0.32
|
|
Memo:
|
|
1992-93 to 2005-06
|
6.4
|
0.24
|
More recently, real GDP growth
has averaged more than 8 per cent per annum in the three-year period ended 2005-06.
Taking into account the sharp deceleration in population growth over the past
two decades, per capita real GDP growth has recorded a more impressive increase
from 3.4 per cent per annum during the 1980s to around 6.5 per cent per annum
in the recent three years. Developments in the current year so far suggest that
the economy is on course to sustain the recent growth momentum in 2006-07.
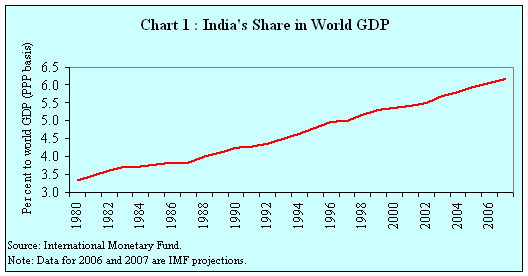
The Indian economy is today the
world’s second fastest growing economy after China. In terms of purchasing power
parity (PPP) GDP, India is the world’s fourth largest economy after the US,
China and Japan. India’s share in world GDP (PPP basis) has increased from 4.3
per cent in 1991 to almost 6.0 per cent in 2005 (Chart 1).
The step-up in the growth rate
of the economy has been facilitated by increase in domestic investment to over
30 per cent of GDP, financed predominantly by domestic savings. Domestic savings
increased to over 29 per cent of GDP by 2004-05 after some stagnation in the
second half of the 1990s. The improvement in overall savings in recent years
has particularly benefited from the turnaround in public sector savings. After
turning negative between 1998-99 and 2002-03 owing to sharp deterioration in
the savings of Government administration, public sector savings have turned
positive again from 2003-04 onwards, mainly reflecting the ongoing fiscal consolidation.
In 2004-05, the public sector savings rate was 2.2 per cent, but it was still
less than a half of the peak of almost five per cent touched in 1976-77. Improvement
in corporate profitability since 2002-03 has also contributed to increase in
domestic savings in the recent years. Household savings remain the predominant
component of domestic savings, contributing almost three-fourths of overall
domestic savings in 2004-05. For the Indian economy to achieve higher growth
on a sustained basis, further improvement in overall savings is necessary and,
in this context, public sector savings will have to play a significant role
(Table 2).
|
Table 2: Domestic Savings
in India
(Per cent to GDP)
|
|
Period/Year
|
Household
Sector
|
Private
Corporate
Sector
|
Public
Sector
|
Total
|
|
1
|
2
|
3
|
4
|
5
|
|
1970s
|
12.2
|
1.6
|
3.7
|
17.5
|
|
1980s
|
14.6
|
1.8
|
3.0
|
19.4
|
|
1990s
|
18.5
|
3.7
|
1.0
|
23.2
|
|
2000-2005
|
22.4
|
4.2
|
-0.2
|
26.3
|
|
Memo:
2004-05
|
22.0
|
4.8
|
2.2
|
29.1
|
Inflation
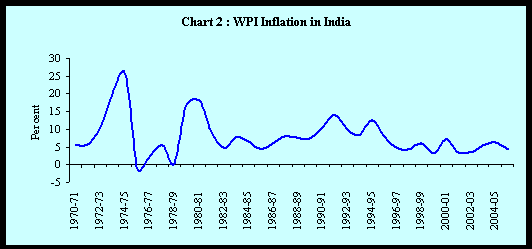
A notable macroeconomic achievement
is in regard to inflation, which has seen a significant fall since the mid-1990s
to an average of around 5 per cent per annum (from around 8 per cent per annum
during the 1970s and 1980s) (Chart 2). The success with inflation management
reflects largely pre-emptive monetary policy actions, in turn, facilitated by
an improved monetary-fiscal interface. The forces of competition unleashed by
growing openness and deregulation of the economy have also helped to contain
the increase in domestic prices. Overall, the success with maintaining price
stability has led to low and stable inflation expectations in the country. As
cross-country experience tells us, inflation expectations play a key role in
determining actual inflation movements. The success with maintaining price and
financial stability in India has raised expectations of a structural shift in
the medium-term growth path of the economy. Although inflation in India
has indeed been significantly lower since the mid-1990s compared to the 1970s
and 1980s, it needs to be stressed that inflation in India still remains higher
than that of 2-3 per cent prevailing in major advanced economies.
It is interesting to note that
inflation in the country in the recent past has remained relatively benign despite
large shocks from record high oil and other commodity prices. The Indian experience
in this context is consistent with the recent experience in other countries;
in the current episode of the oil shock, globally, inflation, has remained relatively
modest compared to the kind of increase in inflation that took place due to
the previous oil shocks. This is attributable to a number of factors such as
declining intensity of oil usage, incomplete pass-through in some cases, higher
competition and finally stable inflation expectations in view of pre-emptive
monetary policy tightening. These issues are explored further in the next section.
Industrial Growth
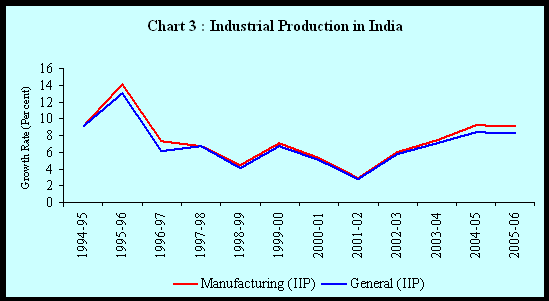
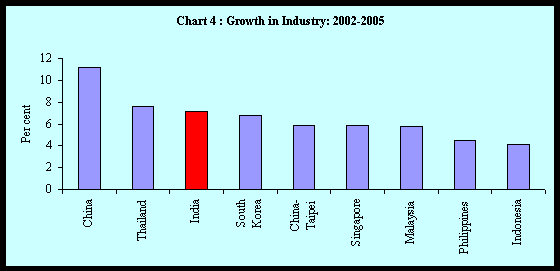
A welcome feature of the strengthening
of economic activity since 2003-04 has been the resurgence of manufacturing
activity in the country (Charts 3 and 4). After recording high growth in the
mid-1990s, the manufacturing sector exhibited stagnation till 2001-02. Since
then, manufacturing has registered a gradual pick-up and this growth has been
sustained in the current year so far. Notwithstanding the rebound in manufacturing
activity, employment growth in manufacturing activity remains low (Table 3).
|
Table 3: Employment in
Industry
(Per cent of total employment)
|
|
Country/Year
|
1980
|
2000
|
|
1
|
2
|
3
|
|
India
|
13.9
|
18.2
|
|
Brazil
|
24.7
|
19.3
|
|
China
|
18.2
|
23.0
|
|
Indonesia
|
13.2
|
17.3
|
|
South Korea
|
29.0
|
28.0
|
|
Malaysia
|
24.1
|
32.2
|
|
Mexico
|
26.5
|
26.9
|
|
Thailand
|
10.3
|
19.0
|
|
Turkey
|
34.9
|
24.5
|
|
Source: Kalpana Kochhar, Utsav Kumar, Raghuram
Rajan, Arvind Subramanian and
Ioannis Tokatlidis (2006), 'India's Pattern of Development: What Happened,
What Follows?', Journal of Monetary Economics, Vol. 53.
|
Growth in Bank Credit
The upturn in economic activity
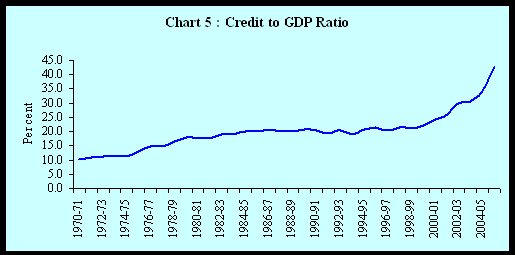
is mirrored in the sustained growth in demand for bank credit. Bank credit has
increased sharply from 30 per cent of GDP at end-March 2000 to 48 per cent by
end-March 2006 (Chart 5). Non-food credit extended by scheduled commercial banks
(SCBs) recorded an average annual growth of 26.1 per cent between 2002-03 and
2005-06, notably higher than that of 14.5 per cent recorded during the preceding
four-year period (1998-99 to 2001-02) as well as the long-run average of 17.8
per cent (1970-2006). The stagnation in credit flow observed during the late
1990s, in retrospect, was partly caused by reduction in demand on account of
increase in real interest rates, turn down in the business cycle, and the significant
business restructuring that occurred during that period. Apart from the revival
of economic activity, the sharp growth in bank credit in the recent years can
be attributed to factors such as financial deepening from a low base, structural
shifts in supply elasticities, rising efficiency of credit markets and policy
initiatives to improve flow of credit to sectors like the agriculture and small
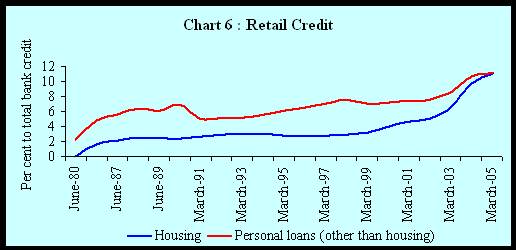
scale units. Increasingly, retail credit led by demand for housing as well as
other retail loans is emerging as a major driver of growth in bank credit. This
is reflected in the sharp increase in the share of housing credit in overall
credit extended by SCBs from 2.4 per cent at end-March 1990 to 11.0 per cent
at end-March 2005. Growth in retail credit has also emanated from increased
use of credit cards, loans for consumer durables and demand for education loans.
The share of non-housing retail credit in total bank credit has increased from
four per cent at end-March 1990 to around 11 per cent at end-March 2005. Thus,
the share of total retail credit in bank credit has increased from 6.4 per cent
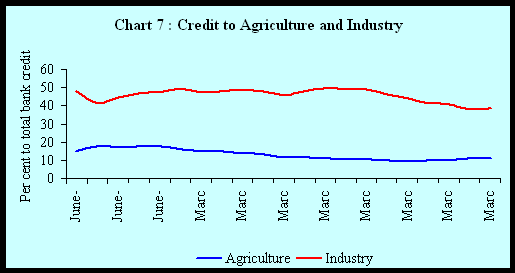
to over 22 per cent in the past 15 years (Chart 6). As a result of these trends,
the share of industry in total credit has been falling since the late 1990s
(Chart 7).
External Sector
The external sector has witnessed
dramatic transformation over the past 15 years. There is growing integration
of the Indian economy with the rest of the world. In contrast to the constant
stress experienced with respect to the external sector during the period till
the early 1990s, the balance of payments position since then has remained comfortable.
A summary indicator of the strength of the external sector is provided by India’s
foreign currency assets which are now close to US $ 160 billion (as on October
27, 2006) in contrast to a mere US $ 1 billion in June 1991. This significant
improvement can be attributed to the combination of policies related to the
external sector such as reduction in tariff and non-tariff barriers, current
account convertibility, prudential approach to capital account liberalisation,
preference for foreign investment flows, especially direct investment flows,
constraints imposed on debt flows and a market-determined exchange rate system.
These policies have enhanced access to external markets while promoting productivity
gains and ensuring financial stability. This is mirrored in strong growth in
merchandise exports and, more strikingly, growth in exports of services and
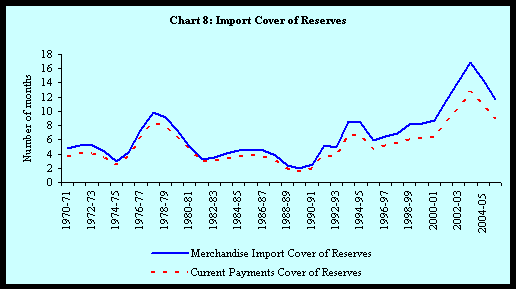
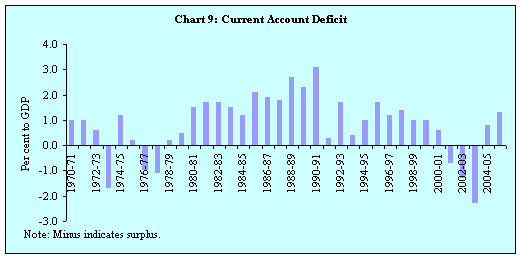
remittances. As a result, the country has been able to finance its increasing
import demand while keeping current account deficits quite modest – an average
of only 0.5 per cent of GDP since 1991-92 as against a deficit of 1.8 per cent
of GDP during the 1980s (Charts 8 and 9).
The growth in services receipts
has been led by the significant expansion in software exports, and other professional
and business services. Reflecting the sustained growth since the early 1990s,
gross invisible receipts (i.e., services, transfers and income taken
together) have expanded sharply from 2.4 per cent of GDP in 1990-91 to 11.5
per cent in 2005-06, outpacing the growth in merchandise exports (which increased
from 5.8 per cent of GDP to 13.1 per cent over the same period). This has led
to a rise in the share of invisibles in the current receipts (exports and invisibles
combined) from 29 per cent in 1990-91 to 47 per cent in 2005-06 (Table 4). As
a result, the ratio of current receipts to GDP has nearly trebled from 8.2 per
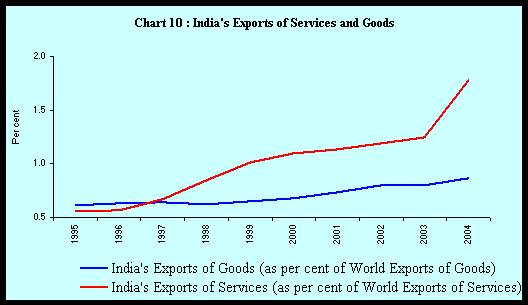
cent in 1990-91 to 24.5 per cent in 2005-06. Reflecting the continued buoyancy
of India’s services exports, the share of India’s services exports in world
exports has trebled in the course of just a decade - from 0.6 per cent in 1995
to 1.8 per cent in 2004 (Chart 10). India was the 18th largest service
exporter in the world in 2004. The gains recorded by the exports of services
have far exceeded those recorded by exports of goods.
|
Table 4: India’s Invisible
Receipts
(US $ billion)
|
|
Year
|
Services
|
Transfers
|
Income
|
Invisibles Receipts/
Current Receipts
(per cent)
|
|
1
|
2
|
3
|
4
|
5
|
|
1990-91
|
4.6
|
2.5
|
0.4
|
29
|
|
1995-96
|
7.3
|
8.9
|
1.4
|
35
|
|
2000-01
|
16.3
|
13.3
|
2.7
|
42
|
|
2001-02
|
17.1
|
16.2
|
3.4
|
45
|
|
2002-03
|
20.8
|
17.6
|
3.5
|
44
|
|
2003-04
|
26.9
|
22.7
|
3.9
|
45
|
|
2004-05
|
46.0
|
21.3
|
4.5
|
47
|
|
2005-06
|
60.6
|
25.2
|
5.7
|
47
|
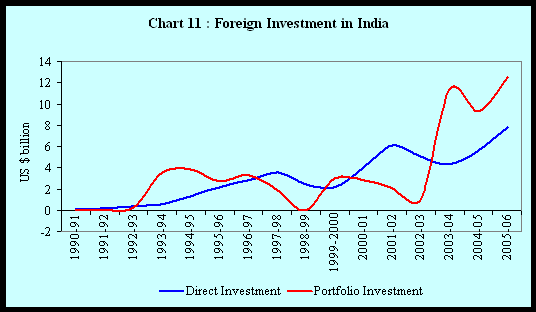
Foreign investment has increased
from negligible levels till the early 1990s to 2.5 per cent of GDP by 2005-06
(Chart 11). Both direct and portfolio investment flows have recorded significant
increases, although the inflows under direct investment remain relatively low
compared to other recipient countries. The volume of FDI inflows into India
is, however, growing on the back of growing interest by many of the world’s
leading multinationals. India has improved its rank from fifteenth (in 2002)
to become the second most likely FDI destination after China in 2005. Net capital
flows received by India amounted to US $ 25 billion in 2005-06; gross capital
inflows and outflows were much higher at US $ 139 billion and US $ 115 billion,
respectively, pointing towards growing openness and integration of the Indian
economy with the global economy. Consequently, global economic developments
are likely to have more pronounced effects on the Indian economy than hitherto.
Policies that take advantage of the growing openness while minimising the adverse
consequences have been followed since early 1990s and these have served the
country well so far. Indeed, not only is India a recipient of FDI inflows, but
Indian companies are also increasingly investing abroad to take advantage of
opportunities available in the global market. Outward FDI investment was as
high as US $ 2.7 billion in 2005-06 and cumulative FDI investment abroad is
estimated at US $ 12 billion at end-March 2006.
Public Finance
Public finances have exhibited
a mixed trend in the reforms period. After witnessing some correction till 1996-97,
public finances witnessed a deterioration, reflecting a variety of factors such
as the decline in tax revenues (as per cent to GDP) in consonance with the cyclical
downturn of economic activity, as well as the effects of the 5th
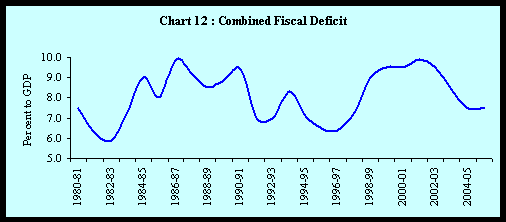
Pay Commission award. Indeed, the combined fiscal deficit of the Centre and
States was higher in 2001-02 than that in 1990-91 (Chart 12). Since 2002-03
onwards, public finances have witnessed a significant improvement, reflecting
both policy efforts at fiscal consolidation as well as the upturn in economic
activity. Notwithstanding this recent correction, combined public debt remains
high (almost 79 per cent of GDP). Furthermore, capital expenditure remains low
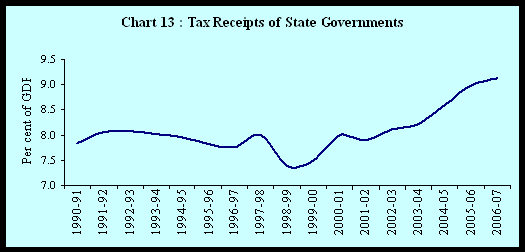
(Table 5) and the tax-GDP ratio, despite recent improvement, also remains low
(Table 6 and Chart 13).
|
Table 5: Central Government’s
Expenditure
(Per cent to GDP)
|
|
Year
|
Revenue Expenditure
|
Capital Outlay
|
|
1
|
2
|
3
|
|
1970-71
|
6.9
|
2.1
|
|
1980-81
|
10.0
|
2.1
|
|
1990-91
|
12.9
|
2.1
|
|
1995-96
|
11.8
|
1.2
|
|
2000-01
|
13.2
|
1.2
|
|
2005-06 RE
|
12.5
|
1.6
|
|
2006-07 BE
|
12.4
|
1.7
|
|
Table 6: Gross Tax Revenues
of the Centre
|
|
(Per cent to GDP)
|
|
Year
|
Direct Tax
|
Indirect Tax
|
Total
|
|
1
|
2
|
3
|
4
|
|
1990-91
|
1.9
|
8.2
|
10.1
|
|
1991-92
|
2.3
|
8
|
10.3
|
|
1992-93
|
2.4
|
7.5
|
10
|
|
1993-94
|
2.4
|
6.5
|
8.8
|
|
1994-95
|
2.7
|
6.5
|
9.1
|
|
1995-96
|
2.8
|
6.5
|
9.4
|
|
1996-97
|
2.8
|
6.6
|
9.4
|
|
1997-98
|
3.2
|
6.0
|
9.1
|
|
1998-99
|
2.7
|
5.6
|
8.3
|
|
1999-2000
|
3.0
|
5.8
|
8.8
|
|
2000-01
|
3.2
|
5.7
|
8.9
|
|
2001-02
|
3.0
|
5.2
|
8.2
|
|
2002-03
|
3.4
|
5.4
|
8.8
|
|
2003-04
|
3.8
|
5.4
|
9.2
|
|
2004-05
|
4.2
|
5.5
|
9.8
|
|
2005-06 (RE)
|
4.8
|
5.7
|
10.5
|
|
2006-07 (BE)
|
5.3
|
5.9
|
11.2
|
|
RE : Revised Estimates. BE: Budget Estimates.
|
Financial Sector
The financial system in India,
through a measured, gradual, cautious, and steady process, has undergone substantial
transformation. It has been transformed into a reasonably sophisticated,
diverse and resilient system through well-sequenced and coordinated policy measures
aimed at making the Indian financial sector more competitive, efficient, and
stable. It is noteworthy that despite a series of exogenous shocks such as the
Asian crisis, sanctions due to nuclear explosions, the sharp rise in oil prices
to record highs, large corrections in stock markets, financial stability has
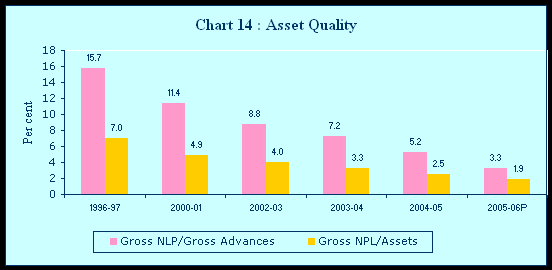
been maintained. The asset quality of the banking sector has recorded a significant
improvement: the ratio of net non-performing assets to net advances has declined
from 8.1 per cent at end-March 1997 to 2.0 per cent at end-March 2006 despite
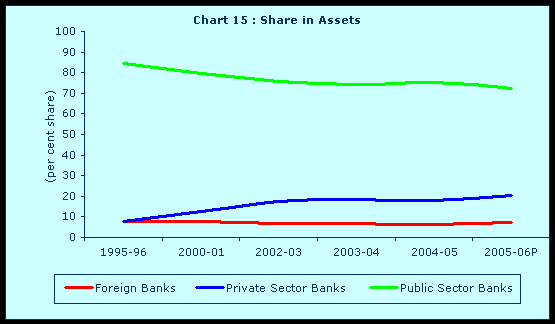
tightening of prudential norms. There is growing competition in the banking
sector, as indicated by the rising share of private sector banks in total banking
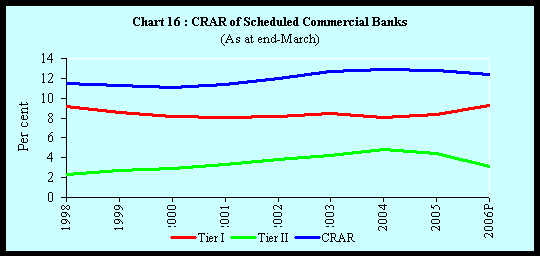
assets. The overall capital adequacy ratio of the banking sector
as a whole has increased from 10.4 per at end-March 1997 to 12.8 per cent at
end-March 2006. Operating expenses of scheduled commercial banks have declined
from 2.1 per cent of total assets in 1992 to 1.8 per cent in 2004 indicative
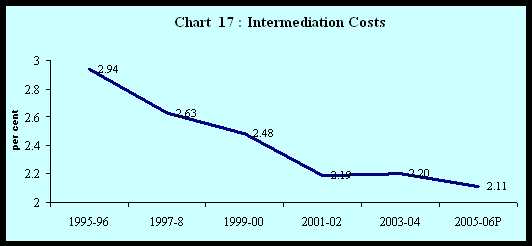
of improvements in efficiency. Intermediation cost of banks has declined from
2.9 per cent in 1995-96 to 2.1 per cent by 2005-06. The financial system
is now robust and resilient, and is enabling accelerated economic growth in
an environment of stability (Charts 14-17).
II. World Economic Situation
As noted earlier, the openness
of the Indian economy has nearly trebled between 1990-91 and 2005-06. The Indian
economy is thus now much more intertwined with the global economy. In order
to assess the prospects for the domestic economy, it would, therefore, be relevant
to review the prospects of the global economy.
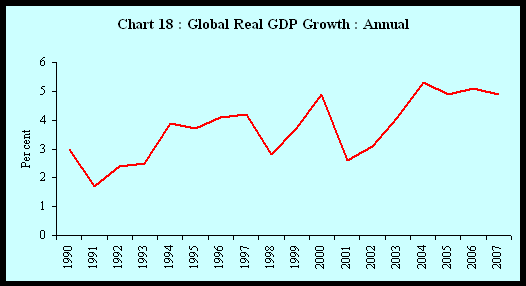
According to the latest assessment
of the IMF in its World Economic Outlook (September 2006), the global economy
(using exchange rates based on purchasing power parities) is expected to record
an accelerated growth of 5.1 per cent in 2006, higher than that of 4.9 per cent
in 2005. This is the fourth successive year of strong, above trend, growth despite
continuous headwinds form record high oil prices and elevated non-commodity
prices. Global growth is expected to average 4.9 per cent per annum between
2003 and 2006, significantly higher than growth of 3.9 per cent registered between
1996 and 2000 and 2.8 per cent between 1991 and 1995. Headwinds from higher
commodity prices have been offset by productivity gains across the world, in
both developed and emerging economies, emanating from forces of globalisation,
the ICT revolution, creation of global supply chains, greater efficiency in
financial markets and better macroeconomic policies. Global growth has been
led by the US and emerging economies led by China and India. A positive feature
is that global economic activity is now becoming more balanced, with the euro
area gaining momentum, along with sustained expansion in Japan. Economic activity
in the US, on the other hand, is slowing down mainly on the back of a cooling
housing market. Global economic growth is expected to maintain its recent
above-trend growth in 2007; the IMF projects growth to be 4.9 per cent in 2007
(in PPP terms) (Charts 18 and 19). Concomitantly, growth in world trade has
remained buoyant. World trade in goods and services in volume terms has increased
by an average of 9 per cent per annum during 2004 and 2005 and is expected to
grow by another 9 per cent in 2006.
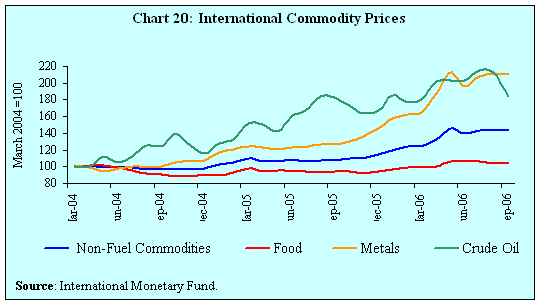
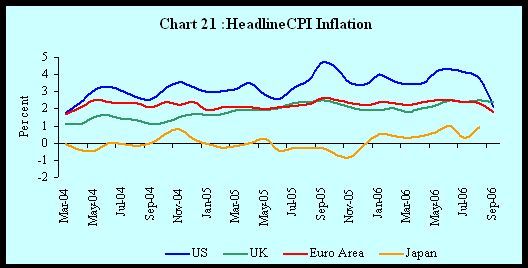
While global growth has remained
strong, it faces a number of downside risks. One such risk emanates from high
oil prices and commodity inflation. Globally, inflation has edged up reflecting
higher oil and other commodity prices, but surprisingly, the impact has remained
relatively muted compared to previous oil shocks. It is also worth stressing
that since 2003 onwards, real interest rates are at very low levels in many
countries and monetary and credit aggregates have been recording above trend
growth. Yet, consumer price inflation has been relatively benign, even in the
face of sharply higher oil and other commodity prices (Charts 20 and 21). This
phenomenon has been aptly described as the "Great Liquidity Expansion Puzzle".
A number of factors explain as
to why consumer price inflation has remained relatively modest despite higher
oil and other commodity prices and abundant liquidity. Lower trade barriers,
increased deregulation, innovation and competition and efficiency gains arising
from global supply chains all over the world helped in containing inflationary
pressures. With the rapid expansion in tradables, domestic economies are, therefore,
increasingly exposed to the rigours of international competition and comparative
advantage, reducing unwarranted price mark-ups. Productivity growth in a number
of sectors, partly due to IT investments combined with restructuring, has also
enabled absorption of higher costs. Fall in intensity of oil usage, and, in
case of many emerging market economies, less-than-complete pass-through of oil
prices have also helped to contain headline inflation. Finally, changes in the
conduct of monetary policy frameworks such as inflation targeting regimes with
greater focus on price stability and increased central bank credibility have
contributed to keeping inflationary expectations largely stable and anchored
at low levels.
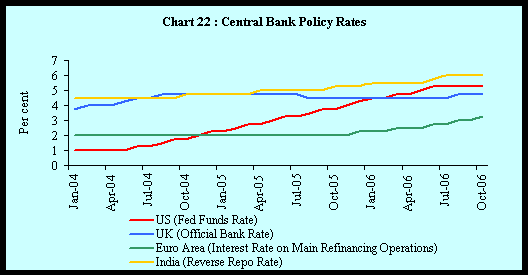
Nonetheless, the cumulative impact
of the past increases in oil and other commodity prices has led to headline
inflation in many economies marginally exceeding their respective targets. Central
banks have, therefore, been tightening their monetary policies to stabilise
inflation expectations, especially since demand conditions have been strong
and output gaps are closing in most of the economies (Chart 22). While the Federal
Reserve in the US has paused since end-June 2006 after 17 successive hikes of
25 basis points each between June 2004 and June 2006, it has indicated that
further tightening would depend upon the incoming information. The European
Central Bank is anticipated to continue to tighten further, despite a pause
in its latest meeting. Thus, global interest rates, which had eased significantly
during 2002-2003, are likely to remain relatively higher in the short-term.
Although in recent weeks, international crude oil prices have eased substantially
to below US $ 60 a barrel, they still remain quite high and furthermore, the
outlook remains uncertain. Moreover, although headline inflation in major advanced
economies has indeed exhibited significant moderation during September
2006, core inflation continues to remain firm.
In brief, globally, both output
growth and consumer price inflation are relatively more stable despite a series
of supply shocks. On the other hand, commodity prices, exchange rates and other
asset prices have exhibited heightened volatility. When inflation and interest
rates are low, as is the case now, small changes in inflation expectations or
interest rate expectations can lead to repricing of risks which can be quite
large. In turn, this repricing of risks can lead to elevated volatility in asset
prices, as was witnessed during May-June 2006.
III. Current Economic Situation:
India
Against this backdrop of external
outlook, it would be useful to have an assessment of the Indian economy for
2006-07, based on developments during 2006-07 so far. A review of the developments
suggests that the Indian economy is on its way of achieving growth close to
that witnessed during the past three years (Table 7).
|
Table 7 : India’s Real GDP
Growth
(Per cent)
|
|
Sector
|
Full Year
|
April-June
|
|
|
|
(Base: 1999-2000)
|
|
|
|
|
|
2003-04
|
2004-05 (QE)
|
2005-06 (RE)
|
2005
|
2006
|
|
1
|
2
|
3
|
4
|
5
|
6
|
7
|
|
1
|
Agriculture and Allied Activities
|
10.0
|
0.7
|
3.9
|
3.4
|
3.4
|
|
2
|
Industry
|
6.6
|
7.4
|
7.6
|
9.5
|
9.7
|
|
2.1
|
Mining and Quarrying
|
5.3
|
5.8
|
0.9
|
3.1
|
3.4
|
|
2.2
|
Manufacturing
|
7.1
|
8.1
|
9.0
|
10.7
|
11.3
|
|
2.3
|
Electricity, Gas and Water Supply
|
4.8
|
4.3
|
5.3
|
7.4
|
5.4
|
|
3
|
Services
|
8.5
|
10.2
|
10.3
|
10.1
|
10.5
|
|
3.1
|
Construction
|
10.9
|
12.5
|
12.1
|
12.4
|
9.5
|
|
3.2
|
Trade, Hotels and Restaurants, Transport,
Storage and Communication
|
12.0
|
10.6
|
11.5
|
11.7
|
13.2
|
|
3.3
|
Financing, Insurance, Real Estate and Business
Services
|
4.5
|
9.2
|
9.7
|
8.8
|
8.9
|
|
3.4
|
Community, Social and Personal Services
|
5.4
|
9.2
|
7.8
|
7.3
|
9.5
|
|
4
|
Gross Domestic Product
|
8.5
|
7.5
|
8.4
|
8.5
|
8.9
|
Agriculture
Assuming trend growth in agriculture
under normal monsoon conditions and barring domestic or external shocks, the
Reserve Bank in its Annual Policy Statement for 2006-07 (April 2006) placed
real GDP growth, for policy purposes, in the range of 7.5-8.0 per cent during
2006-07. The Reserve Bank reaffirmed its forecast for GDP growth in July 2006
in its First Quarter Review of the Annual Statement on Monetary Policy. The
Reserve Bank revised upwards its forecast for GDP growth to around 8.0 per cent
in October 2006 in its Mid-Term Review on the back of improvement in industrial
outlook and expected sustenance of growth momentum in services. Other agencies
have also placed their growth estimates close to 8 per cent.
Industry and Infrastructure
Led by manufacturing,
the upturn in the industrial sector is entering its fifth year of expansion
in 2006-07. Manufacturing activity has remained stronger than expected in the
current fiscal year so far. Based on movements in the index of industrial production
(IIP), growth in manufacturing activity accelerated to 11.8 per cent during
April-August 2006 from 9.6 per cent in the corresponding period of 2005. In
terms of use-based classification, all sectors, excepting consumer non-durables
have exhibited acceleration. Notably, growth in capital goods production accelerated
to nearly 19 per cent, even on a high base, reflective of strong investment
activity in the economy (Table 8).
|
Table 8: Index of Industrial
Production
|
|
Sector
|
Weights in IIP
|
Growth Rate (Per cent)
|
|
|
|
April-March
|
April-August
|
|
|
|
2004-05
|
2005-06
|
2005
|
2006
|
|
1
|
2
|
3
|
4
|
5
|
6
|
|
IIP
|
100.0
|
8.4
|
8.1
|
8.7
|
10.6
|
|
Basic Goods
|
35.6
|
5.5
|
6.6
|
6.9
|
8.3
|
|
Capital Goods
|
9.3
|
13.9
|
15.8
|
13.8
|
18.6
|
|
Intermediate Goods
|
26.5
|
6.1
|
2.4
|
3.5
|
9.5
|
|
Consumer Goods
|
28.7
|
11.7
|
12.0
|
13.7
|
11.3
|
|
i) Consumer Durables
|
5.4
|
14.4
|
14.9
|
13.0
|
16.6
|
|
ii) Consumer Non-Durables
|
23.3
|
10.8
|
11.1
|
13.9
|
9.5
|
On the other hand, the six infrastructure
industries have recorded only modest improvement to 7.3 per cent during April-September
2006 from 6.1 per cent in the corresponding period of 2005. This improvement
was helped by a turnaround in the production of crude oil and petroleum refinery
products – these two sectors had registered negative growth a year ago. Electricity
generation, coal, and oil production, however, remained subdued (Table 9).
|
Table 9 : Infrastructure Activity
|
|
|
Weight in IIP
(per cent)
|
Growth in
per cent (y-o-y)
|
|
|
|
April-March
|
April-September
|
|
Sector
|
|
2004-05
|
2005-06
|
2005
|
2006
|
|
1
|
2
|
3
|
4
|
5
|
6
|
|
Electricity
|
10.2
|
5.2
|
4.9
|
4.7
|
6.7
|
|
Coal
|
3.2
|
6.2
|
7.0
|
6.0
|
5.3
|
|
Finished Steel
|
5.1
|
8.4
|
8.0
|
13.7
|
7.2
|
|
Cement
|
2.0
|
6.6
|
12.3
|
11.4
|
10.0
|
|
Crude Petroleum
|
4.2
|
1.8
|
-5.3
|
-5.0
|
4.1
|
|
Petroleum Refinery Products
|
2.0
|
4.3
|
2.1
|
-0.7
|
12.3
|
|
Composite Infrastructure Index
|
26.7
|
5.8
|
5.3
|
6.1
|
7.3
|
The resilience shown by the industrial
sector against the hardening of global oil prices is reflective of inherent
strengths and capabilities that the industrial sector has built up over the
years since the initiation of economic reforms in the country. There is evidence
of growing competitiveness in respect of sectors such as automobiles and pharmaceuticals,
with potential to emerge as a manufacturing base for global production. At the
same time, in the face of challenges from infrastructural bottlenecks, elevated
input costs from higher oil and other commodity prices, likely imports from
China and the possibility of emerging shortages of domestic skilled labour,
the domestic manufacturing sector will have to continuously improve its productivity
and competitiveness in order to sustain the current growth momentum.
Corporate Profitability
In recent years, a striking feature
of the Indian corporate sector is its growing engagement with the global economy.
Apart from merchandise trade in goods and services, this growing integration
has taken the form of large scale cross-border merger and acquisition activities.
Thus, not only India is a recipient of foreign direct investment, but the corporate
sector is also exploring opportunities to invest abroad. Following the phased
liberalisation in the regime for Indian investments overseas, investments in
joint ventures (JV) and wholly owned subsidiaries (WOS) abroad have emerged
as important avenues for promoting global business by Indian companies. Indian
firms are acquiring firms abroad to leverage comparative advantage of foreign
locations, to acquire appropriate technologies and to have a marketing and distribution
base with the ultimate objective of attaining economies of scale and productivity
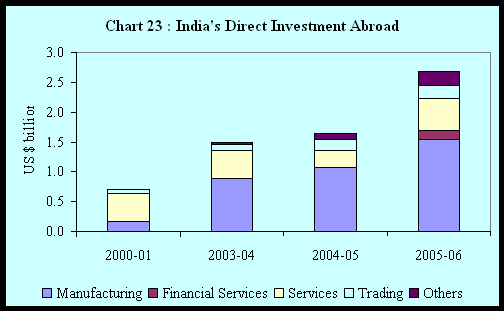
gains. As noted earlier, India’s direct investment overseas amounted to US $
2.7 billion during the year (Chart 23). The value of acquisitions is, however,
much higher since these data only capture the cross-border remittance of outward
FDI from India. The number of Indian companies listed on stock exchanges abroad
has seen a consistent increase. The growing integration of the Indian corporate
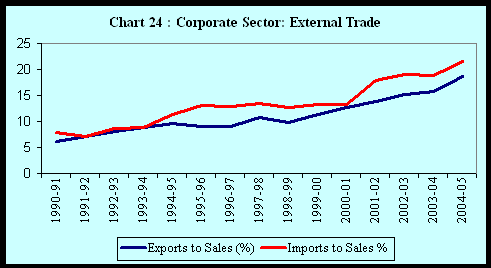
sector is also visible from the trends in their exports and imports. The ratio
of merchandise exports to sales trebled from 6.2 per cent in 1990-91 to 18.6
per cent by 2004-05 while the ratio of imports to sales has increased from 7.9
per cent to 21.6 per cent over the same period (Chart 24).
Corporate profitability has recorded
strong growth for over three years now. Profits after tax of a sample non-financial
non-Government companies recorded a growth of more than 40 per cent for 11 successive
quarters from October-December 2002 to April-June 2005. Subsequently, growth
in profitability decelerated over the next three quarters of 2005-06 on the
back of rising input costs as well as higher debt servicing costs. Available
information for 2006-07 suggests a reversal of the deceleration trend; growth
in profits after tax accelerated to 35 per cent during April-June 2006 from
around 15 per cent in the preceding quarter (Table 10). It is interesting that
corporate profitability has remained strong, despite sharp rise in input costs.
Perhaps, the strong profitability can be partly attributed to productivity gains.
Looking ahead, a critical question is: how long can corporate profitability
and productivity continue to exhibit buoyancy?
|
Table 10: Corporate Sector
Performance
(Growth rates, per cent)
|
|
Item
|
2003-04
|
2004-05
|
2005-06
|
2005-06
|
2006-07
|
|
|
|
|
Q1
|
Q2
|
Q3
|
Q4
|
Q1
|
|
1
|
2
|
3
|
4
|
9
|
10
|
11
|
12
|
13
|
|
Sales
|
16
|
24.1
|
16.9
|
18.5
|
16.4
|
13.2
|
19.5
|
25.6
|
|
Expenditure
|
13.2
|
21.9
|
16.4
|
18
|
16.3
|
12.7
|
18.9
|
24.6
|
|
Gross Profit
|
25
|
32.5
|
20.3
|
32
|
19.1
|
21.2
|
16.6
|
33.9
|
|
Interest Cost
|
-11.9
|
-5.8
|
1.9
|
-13.5
|
-8
|
4.6
|
3.8
|
19.9
|
|
Profit After Tax
|
59.8
|
51.2
|
24.2
|
54.2
|
27.5
|
27
|
15.1
|
34.7
|
|
Note : 1. Growth rates are percentage
change in the level for the period under reference over the corresponding
period of the previous year.
2. Data are based on the audited / unaudited abridged results of the non-financial
non-Government companies except column
(2) and column (3) which are based on audited balance sheets for 2003-04
and 2004-05, respectively.
*: Provisional.
|
Recovery in domestic stock markets,
buoyant corporate performance and business confidence all suggest that investment
climate remains upbeat and this should support economic activity. There has
been a large increase in investment intentions: the value of investment intentions
registered in Industrial Entrepreneurs Memoranda have more than doubled from
Rs.1,54,954 crore in 2003-04 to Rs. 3,82,743 crore in 2005-06. However, it remains
to be seen as to how much of these investments fructify? Issues of financing
of investments will also assume importance in this context as these investment
intentions move towards fructification.
Banking Developments
Bank deposits as well as credit
have recorded strong growth during the fiscal year 2006-07 indicative of strong
demand conditions. Bank credit has continued to record year-on-year growth of
over 30 per cent for more than a year. Bank credit has been largely broad-based,
although some of the sectors such as housing and other retail and commercial
real estate have expanded more rapidly. In this context, it would be relevant
to note that the credit-GDP ratio in India - notwithstanding the sharp rise
since 2000 - remains lower than in many Asian economies as well as in advanced
economies. Deposit growth has accelerated, which could be attributed partly
to higher interest rates on time deposits as well as extension of tax benefits
for deposits above 5-year maturity. Concomitantly, growth in broad money
(M3), y-o-y, at 19.0 per cent as on October 13, 2006 remains above the indicative
trajectory of 15.0 per cent projected in the Annual Policy Statement (Table
11). By current indications, as the Reserve Bank noted in its Mid-Term Review
(October 2006), the growth in monetary and credit aggregates is now expected
to be somewhat higher than the initial indicative projections. In view of
sustained demand for credit from the commercial sector, banks’ continue to restrict
their incremental investments in Government securities. As a result, the banks’
holdings of SLR securities have declined to around 30 per cent as on October
13, 2006 from around 35 per cent a year ago. As the ratio approaches the statutory
minimum of 25 per cent, the flexibility available to the banks by switching
their asset portfolio in favour of credit to the commercial sector by restricting
their incremental investments in SLR securities is, thus, getting progressively
limited. In the context of sustained high growth in bank credit, the Reserve
Bank has raised risk weights and provisioning requirements for sectors witnessing
large credit growth. In view of the high credit growth, the Reserve Bank has
also been drawing the attention of banks to the need to ensure asset quality
in order to maintain financial stability.
|
Table 11 : Money and Credit
(Per cent)
|
|
Item
|
Year on-Year Growth
|
| |
October 14, 2005
|
October 13, 2006
|
|
1
|
2
|
3
|
|
Broad Money
|
16.8
|
19.0
|
|
Of which:
|
|
|
|
Currency with Public
|
14.6
|
17.3
|
|
Commercial Bank Deposits
|
18.6
|
20.7
|
|
Commercial Bank Non-food
Credit
|
31.8
|
30.5
|
|
Commercial Bank Investment
in Gilts
|
5.9
|
2.5
|
Demand for bank credit is likely
to remain strong in view of vast demands for financing the infrastructure investment,
the growing size of the services sector, SMEs and rural enterprises. The emphasis
on financial inclusion will also lead to enhanced need for financial intermediation.
The corporate sector, in the coming years, is, therefore, likely to face greater
competition for bank credit as the banks explore emerging avenues such as retail
credit. The banking system has to respond adequately to these new challenges,
opportunities and risks. Innovative channels for credit delivery for serving
these new rural credit needs, encompassing full supply chain financing, covering
storage, warehousing, processing, and transportation from farm to market will
have to be found. In view of the expected large demand for bank credit, banks
will have to simultaneously put in steps to increase deposit mobilisation. Concomitantly,
it is important to keep monetary growth consistent with the requirements of
price stability.
Inflation
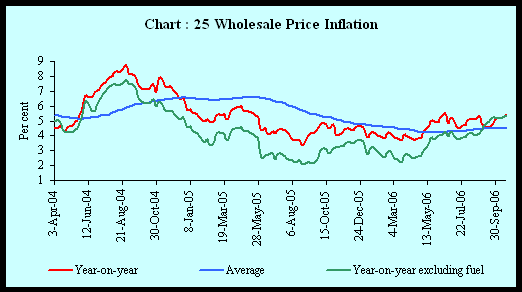
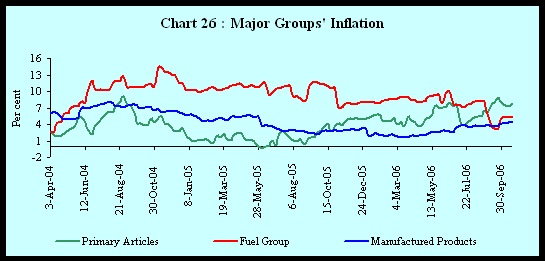
Headline inflation during 2006-07
so far (5.4 per cent as on October 21, 2006) remains relatively contained, even
as supply shocks from higher primary food articles prices have got accentuated.
Primary articles inflation, year-on-year, has increased to 7.8 per cent on the
back of higher prices of wheat, pulses and milk. As regards fuel prices, its
impact on domestic inflation has petered out in recent weeks on the back of
base effects. In this context, the recent decline in international crude oil
prices, if sustained, is welcome. However, it needs to be noted that the pass-through
of higher international crude oil prices to domestic prices remains incomplete
as LPG and kerosene prices have remained unchanged since November 2004 and April
2002, respectively. Manufactured products inflation has also edged higher in
recent months, although it remains relatively modest (Charts 25 and 26).
Various measures of consumer price
inflation – which has a greater weight on prices of food articles – remain higher
than that of wholesale price inflation. In order to contain inflationary expectations,
the Reserve Bank increased the reverse repo rate as well as the repo rate by
25 basis points each in June 2006 and July 2006. The Reserve Bank increased
the repo rate by another 25 basis points to 7.25 per cent in its Mid-term Review
(October 2006) while leaving the reverse repo rate unchanged at 6.00 per cent
– there has, thus, been a cumulative increase of 150 basis points in the reverse
repo rate and 125 basis points in the repo rate since the tightening began in
October 2004. The monetary measures have been supported by fiscal measures such
as exempting imports of wheat, pulses and sugar from customs duty, reduction
in customs duty on palm oils and restriction on exports of pulses. Pressures
on primary articles prices, low stocks in case of wheat as well as shortfall
in global production pose continuing challenges for monetary management. Furthermore,
as the Mid-Term Review of the Annual Policy Statement for 2006-07 has observed,
recent developments, in particular, the combination of high growth and consumer
inflation coupled with escalating asset prices and tightening infrastructural
bottlenecks underscore the need to reckon with dangers of potential overheating
and the implications for the timing and direction of monetary policy setting.
While there is no conclusive evidence of potential overheating in the Indian
economy at the current juncture, the criticality of monitoring all available
indications that point to excess aggregate demand is perhaps more relevant now
than ever before.
The cumulative rainfall during
the South-West monsoon season (June-September 2006) was close to normal; the
inter-temporal as well as inter-spatial distribution, however, turned out to
be uneven. As a result, kharif foodgrains output for 2006 is now anticipated
to be almost four per cent below that achieved in 2005. Looking ahead, the total
live water storage in the 76 major reservoirs as on October 12, 2006 at 90 per
cent of the Full Reservoir Level remains higher than that of 81 per cent a year
ago and portends well for the ensuing rabi crops. However, in a medium-term
perspective, the stagnation in domestic foodgrains production in the recent
years has emerged as a clear cause of concern, impinging both upon domestic
demand as well as domestic prices. These issues are addressed in detail in the
subsequent section.
External Sector
Finally, external sector developments
indicate continued buoyancy in both merchandise and service exports, suggestive
of growing competitiveness of Indian manufacturing and services. Oil imports
have posted large growth so far, reflecting the further hardening of international
crude oil prices until mid-August 2006. The recent easing of international crude
oil prices, if sustained, could restrict the growth of oil imports going forward.
Non-oil imports, on the other hand, have recorded a sharp deceleration, which
could be partly attributed to imports of gold and silver (which declined by
30 per cent during April-June 2006 as against an increase of 52 per cent during
April-June 2005). Imports of capital goods continued to record strong growth
(38 per cent during April-June 2006). Capital flows have remained strong led
by higher inflows under FDI, NRI deposits and issuances under ADRs/GDRs even
as there were outflows by foreign institutional investors (FIIs). On the whole,
India’s foreign exchange reserves have increased by US $ 14.5 billion in the
current fiscal year so far to US $ 166.2 billion as on October 20, 2006.
Looking ahead, despite the growing
oil import bill, the anticipated current account deficit in 2006-07 is manageable,
as in the past, due to the continuing underlying strength of merchandise exports,
invisibles and capital flows. The balance of payments is, therefore, expected
to remain comfortable during 2006-07.
In brief, an assessment of the
developments during 2006-07 so far suggests reinforcement of the robust economic
growth exhibited in recent years. For the current growth momentum to be maintained
and to be improved upon, a number of issues such as agriculture, infrastructure,
and fiscal consolidation need to be addressed. These are discussed next.
IV. Issues
Instead of summarising my remarks,
let me flag some issues that are going to be rather important in the days to
come.
Agriculture
The agriculture sector in the recent
years has been marked by low and volatile growth – real GDP growth in the agricultural
sector during the first four years of the Tenth Five Year Plan has averaged
only two per cent per annum as against four per cent envisaged in the Plan period
(2002-07). A key factor underlying this low and volatile growth is the stagnation
in domestic production in the case of major crops like wheat, sugar and pulses.
Illustratively, the production of wheat after touching a peak of 76 million
tonnes (mt) in 1999-2000 has since then been range-bound at around 70 mt. Similarly,
the production of pulses has not been able to exceed the peak of 14.9 mt reached
in 1998-99. The production of pulses at 13.1 mt in 2005-06 was even lower than
the levels achieved more than 15 years back (14.3 mt in 1990-91). The stagnation
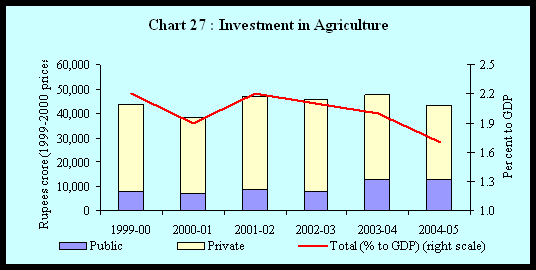
in production, in turn, can be partly attributed to stagnancy in investment
in the agricultural sector which, at constant (1999-2000) prices, at Rs.43,123
crore in 2004-05 was even lower than that of Rs.43,473 crore in 1999-2000. As
a result, the ratio of investment to GDP fell from 2.2 per cent in 1999-2000
to 1.7 per cent in 2004-05 (Chart 27).
For the Indian economy to attain
growth rates of 8 per cent and above, the stagnation in production of major
crops and agricultural investment needs to be reversed. First, investment outlays
on irrigation facilities need to be stepped up along with focus on efficient
use of water resources. In this context, appropriate pricing of power can be
helpful in avoiding the excessive use of ground water. Second, given the several
risks that farmers face such as future price and monsoon conditions, there is
a need to put in place proper risk mitigation policies. Third, greater focus
on rural infrastructure is required to enhance the productivity of physical
resources, and improve supply chain management and value addition in agriculture.
Improvements in rural infrastructure will facilitate food processing and other
agro-based industries. In this context, the focus on rural infrastructure development
under Bharat Nirman is welcome. Fourth, globalisation, rising income, and urbanisation
call for increasing diversification and value addition in Indian agriculture.
The shifts in consumption pattern warrant a shift of land and other resources
to crops with higher potential for value addition. Fifth, effective linkages
of production systems with marketing, agro-processing and other value added
activities would play an increasingly important role in diversification of agriculture.
Sixth, more focus needs to be placed on agricultural research in the coming
years as the success so far has been restricted to select crops. Finally, the
Reserve Bank is intensifying its efforts in revitalising the rural cooperative
credit system, strengthening regional rural banks, providing incentives to commercial
banks for investments in rural economy and ensuring an adequate and timely delivery
of credit at an appropriate price. Higher growth and stability in the agricultural
sector will also provide a strong demand impetus for the non-agricultural sector
(RBI, Annual Report, 2005-06).
Infrastructure
The sustenance and strengthening
of the ongoing manufacturing resurgence will depend critically upon improvements
in infrastructure facilities in a number of areas. Improvements that have taken
place in infrastructure facilities in areas such as telecommunications, civil
aviation, roads and, to some extent, ports and railways would need to be extended
to the power sector. Electricity generation continues to be hampered by policy
shortcomings, continued excessive transmission and distribution losses, and
collection of dues along with emerging difficulties in the availability of coal
and gas. Unreliable supply of power and that too at higher tariffs vis-à-vis
other countries such as China can have adverse implications for competitiveness
of the domestic manufacturing sector.
Provision of urban infrastructure
facilities also needs greater attention. Globally, cities have consistently
provided the environment for institutional and technological innovation, and
acted as engines of economic growth. In this context, it may be noted that,
in the last century, India did not face an "urban explosion" as against
rapid urbanization across the globe. India’s level of urbanisation increased
from 17.6 per cent in 1951 to only 23.7 per cent in 1981 and 27.8 per cent in
2001. Consistent with its low per capita income India ranks among the last thirty
in the list of countries listed according to their urbanisation levels. Despite
its low level of urbanisation, India’s urban population has grown to more than
285 million in 2001, close to 28 per cent of the total population of the country.
In the last decade the overall increase in population has been particularly
large at about 70 million people, which is larger than the urban population
of all countries except Brazil, China, Indonesia, Russia, and the United States.
Therefore, even though India’s level of urbanisation continues to be low and
its urban population growth rate is not among the fastest in the world, the
magnitude of urbanisation in India per se is large. Moreover, most of the growth
in urban population has been due to the enlargement of existing towns at every
level and not significantly due to the addition of new towns. This stable, rather
static, situation has resulted in a stable city primacy hierarchy, but is also
accompanied with vast areas of the country still continuing to be devoid of
urban settlements of any size leading to extremely low levels of urbanisation
of 10-15 percent in these regions (Table 12).
|
Table 12: Trends in Urbanisation
(Population in millions)
|
|
Year
|
Number of
UAs/Towns
|
Total
Population
|
Rural
Population
|
Urban
Population
|
Urban/
Total (%)
|
|
1
|
2
|
3
|
4
|
5
|
6
|
|
1901
|
1,830
|
238
|
213
|
26
|
10.8
|
|
1911
|
1,815
|
252
|
226
|
26
|
10.3
|
|
1921
|
1,944
|
251
|
223
|
28
|
11.2
|
|
1931
|
2,066
|
279
|
246
|
34
|
12.0
|
|
1941
|
2,253
|
319
|
275
|
44
|
13.0
|
|
1951
|
2,822
|
361
|
299
|
62
|
17.3
|
|
1961
|
2,334
|
439
|
360
|
79
|
18.0
|
|
1971
|
2,567
|
548
|
439
|
109
|
19.9
|
|
1981
|
3,347
|
683
|
524
|
160
|
23.3
|
|
1991
|
3,769
|
846
|
629
|
218
|
25.7
|
|
2001
|
4,378
|
1,027
|
742
|
285
|
27.8
|
Studies show that doubling of city
size is associated with large productivity gains of 3-8 per cent, i.e.,
moving from a city of 100,000 inhabitants to one of 10 million is predicted
to increase productivity by more than 40 per cent. These benefits emanate from
the proximity to product as well as labour markets; proximity provides savings
in trade and transport costs on the one hand and the availability of skilled
labour on the other hand. Economic concentration economises on infrastructure
investment that would have been larger had it been spread out over a larger
part of the country. Thus, the evidence suggests that urban agglomerates provide
large productivity gains. Accordingly, substantial improvement in the quality,
governance and management of urban infrastructure in the country is essential
for India to maintain and accelerate the momentum of economic growth and productivity.
Human Resource Development
Finally, substantial improvements
in primary and secondary educational facilities available in the country will
be necessary to accelerate the current growth momentum as well as to reap the
benefits of the expected demographic dividend. Moreover, a renewed emphasis
on quality higher education is necessary in view of the greater concentration
of economic activities in the skill-intensive sectors, both in the industry
and the services.
Fiscal Responsibility
The success in achieving fiscal
consolidation, as observed earlier, has been mixed since the early 1990s. Against
this backdrop, the progress on fiscal consolidation in the past three years
is heartening. Indeed, the turnaround in public sector savings of 4.2 percentage
points – from a negative 2.0 per cent of GDP in 2001-02 to a positive 2.2 per
cent in 2004-05 – has been the predominant factor in improvement of overall
savings to above 29 per cent and of investment rate to above 30 per cent. Fiscal
consolidation is expected to improve savings further while also permitting productivity
and efficiency gains as more resources become available for the private sector.
The progress in Central Government
finances during the first five months of 2006-07 (April-August 2006) indicates
that the key deficit indicators, as proportion to budget estimates, were higher
than in the corresponding period of 2005-06. The widening of deficits was essentially
on account of large growth in non-Plan revenue expenditures - higher interest
payments, higher food and fertiliser subsidies and grants to States - which
more than offset the buoyant tax collections under corporation tax, income tax
and customs duties. The Government has, however, reiterated that the
deficit targets set under the FRBM would be met with an evening out of revenues
and expenditures over the course of the year.
Given the downward rigidity in
revenue expenditure and sluggishness in non-tax receipts, the scope for deepening
fiscal empowerment lies in improving tax revenue. In this context, the reversal
of the declining trend in gross tax-GDP ratio is welcome. Gross tax/GDP ratio
of the Centre after falling to a low of 8.2 per cent in 2001-02 has since increased
to 11.2 per cent, the highest since 1990-91. This increasing trend needs to
be maintained through further widening of the tax base and curtailment in tax
exemptions. Larger deficit reductions in 2007-08 and 2008-09 will be required
to meet the FRBM targets. As the Reserve Bank in its latest Annual Report has
observed, adhering to the FRBM targets in respect of fiscal deficit and revenue
deficit is critical for macroeconomic, financial, external sector and budgetary
sustainability. It is essential to eliminate revenue deficit and generate sufficient
revenue surplus which may be utilised for asset creation without creating liabilities.
Any slippage in achieving the FRBM targets could erode the gains achieved in
the initial year of the FRBM. It could also generate a chain effect at the State
levels to relax targets set out in their fiscal responsibility legislations.
Any deviation from the FRBM targets will have both national and international
repercussions in terms of credibility.
As in the case of the Centre, the
States will also need to focus on fiscal empowerment, i.e., expand the
scope and size of revenue flows into budget. In particular, augmenting non-tax
revenues through appropriate user charges and restructuring of State public
sector undertakings (PSUs) continues to be of critical importance. Higher user
charges will, however, not be feasible unless there is a greater efficiency
in the delivery of the services provided by the States. Therefore, improving
delivery of public services should be a priority for the State Governments.
The various measures aimed at improving
tax collections are expected to reduce revenue deficits of the Government sector.
The combined revenue deficit must be brought to zero in order to release more
resources for investment, both by the public and the private sectors.
Public Services Delivery
Given the large infrastructure
requirements and given the public good nature of such projects, the public sector
will always have significant presence in the provision of infrastructure. Thus,
infrastructural projects such as roads, urban infrastructure (water supply,
sewerage, public lighting and urban transportation), railways and ports and
airports will continue to need to be funded by public sector funds, although
in some cases there is some scope for private sector in areas such as railways.
This requires greater focus on improvement in delivery of public services.
Inaugural Address of Dr. Rakesh
Mohan, Deputy Governor, RBI at the 2nd Annual Indian Securities Infrastructure
& Operations Forum 2006 at Mumbai on November 7, 2006.
|