Today, the Reserve Bank released data relating to India’s International Investment Position for end-June 2026[1]. Key highlights of India’s IIP in end-June 2026: -
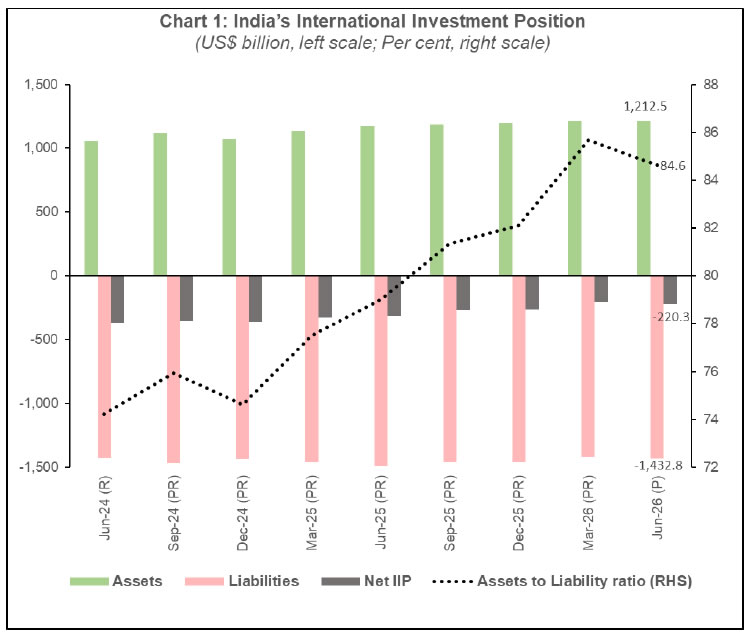
Net claims of non-residents on India increased by US$ 16.5 billion during Q1:2026-27 to US$ 220.3 billion as at end-June 2026, mainly due to increase in external liabilities by US$ 11.6 billion and a decline of US$ 4.9 billion in the foreign-owned assets (Table 1). -
Accordingly, the ratio of India’s international assets to international liabilities moderated to 84.6 per cent in June 2026 from 85.7 per cent a quarter ago (Chart 1 & Table 1). -
Rise in foreign liabilities of Indian residents was mainly on account of increased direct investment (US$ 15.7 billion) and other investment (US$ 4.2 billion) compensating for the decline in portfolio equity investments (US$ 14 billion). -
Reserve assets accounted for 55.1 per cent of India’s international financial assets while overseas direct investment accounted for over one fourth share (Table 2). - The share of debt liabilities in total external liabilities increased gradually during the recent quarters and stood at 56.9 per cent as on end-June 2026 (Table 3).
(Brij Raj)
Chief General Manager Press Release: 2026-2027/1223
| Table 1: Overall International Investment Position of India | | (US$ billion) | | Period | Jun-25 (PR) | Sep-25 (PR) | Dec-25 (PR) | Mar-26 (PR) | Jun-26 (P) | | Net IIP (A-B) | -312.9 | -271.9 | -261.6 | -203.8 | -220.3 | | A. Assets | 1,177.3 | 1,185.5 | 1,200.2 | 1,217.4 | 1,212.5 | | 1. Direct Investment | 279.6 | 289.2 | 299.0 | 306.6 | 316.1 | | 1.1 Equity and investment fund shares | 180.2 | 187.8 | 196.0 | 201.7 | 208.7 | | 1.2 Debt instruments | 99.4 | 101.4 | 103.0 | 105.0 | 107.4 | | 2. Portfolio Investment | 16.3 | 16.6 | 16.5 | 22.4 | 23.4 | | 2.1 Equity and investment fund shares | 13.1 | 12.5 | 10.1 | 12.2 | 16.0 | | 2.2 Debt securities | 3.2 | 4.1 | 6.4 | 10.2 | 7.4 | | 3. Other Investment | 183.3 | 179.6 | 197.0 | 197.3 | 204.4 | | 3.1 Trade Credits | 33.7 | 31.9 | 34.2 | 31.0 | 31.0 | | 3.2 Loans | 25.6 | 25.8 | 26.8 | 26.9 | 28.6 | | 3.3 Currency and Deposits | 83.6 | 80.8 | 90.2 | 89.8 | 91.3 | | 3.4 Other Assets | 40.4 | 41.1 | 45.8 | 49.6 | 53.5 | | 4. Reserve Assets | 698.1 | 700.1 | 687.7 | 691.1 | 668.6 | | B. Liabilities | 1,490.2 | 1,457.4 | 1,461.8 | 1,421.2 | 1,432.8 | | 1. Direct Investment | 571.7 | 563.0 | 560.5 | 545.2 | 560.9 | | 1.1 Equity and investment fund shares | 535.9 | 526.7 | 523.7 | 508.1 | 521.8 | | 1.2 Debt instruments | 35.8 | 36.3 | 36.9 | 37.2 | 39.1 | | 2. Portfolio Investment | 272.6 | 258.7 | 255.9 | 232.3 | 224.0 | | 2.1 Equity and investment fund shares | 147.4 | 133.0 | 130.1 | 109.3 | 95.3 | | 2.2 Debt securities | 125.2 | 125.7 | 125.8 | 123.0 | 128.7 | | 3. Other Investment | 646.0 | 635.6 | 645.4 | 643.7 | 647.9 | | 3.1 Trade Credits | 131.1 | 135.0 | 148.3 | 144.9 | 148.4 | | 3.2 Loans | 260.3 | 258.5 | 259.8 | 264.9 | 267.0 | | 3.3 Currency and Deposits | 171.7 | 168.9 | 173.9 | 170.4 | 172.6 | | 3.4 Other Liabilities | 60.1 | 50.6 | 40.7 | 41.1 | 37.5 | | 3.5 Special drawing rights (Net incurrence of liabilities) | 22.7 | 22.7 | 22.7 | 22.4 | 22.4 | | Memo Item: Assets to Liability ratio (%) | 79.0 | 81.3 | 82.1 | 85.7 | 84.6 | Notes (applicable for all tables):
1. P: Provisional; PR: Partially Revised; and R: Revised.
2. The sum of the constituent items may not add to the total due to rounding off. |
| Table 2: Composition of International Financial Assets and Liabilities of India | | (Per cent) | | Period | Jun-25 (PR) | Sep-25 (PR) | Dec-25 (PR) | Mar-26 (PR) | Jun-26 (P) | | A. Assets | | 1. Direct Investment | 23.7 | 24.4 | 24.9 | 25.2 | 26.1 | | 2. Portfolio Investment | 1.4 | 1.4 | 1.4 | 1.8 | 1.9 | | 3. Other Investment | 15.6 | 15.1 | 16.4 | 16.2 | 16.9 | | 4. Reserve Assets | 59.3 | 59.1 | 57.3 | 56.8 | 55.1 | | Total | 100.0 | 100.0 | 100.0 | 100.0 | 100.0 | | B. Liabilities | | 1. Direct Investment | 38.4 | 38.6 | 38.3 | 38.4 | 39.2 | | 2. Portfolio Investment | 18.3 | 17.8 | 17.5 | 16.3 | 15.6 | | 3. Other Investment | 43.3 | 43.6 | 44.2 | 45.3 | 45.2 | | Total | 100.0 | 100.0 | 100.0 | 100.0 | 100.0 |
| Table 3: Share of External Debt and Non-Debt Liabilities of India | | (Per cent) | | Period | Jun-25 (PR) | Sep-25 (PR) | Dec-25 (PR) | Mar-26 (PR) | Jun-26 (P) | | Non-Debt Liabilities | 45.9 | 45.3 | 44.7 | 43.4 | 43.1 | | Debt Liabilities | 54.1 | 54.7 | 55.3 | 56.6 | 56.9 | | Total | 100.0 | 100.0 | 100.0 | 100.0 | 100.0 |
| |