[Under Section 45ZL of the Reserve Bank of India Act, 1934] The seventeenth meeting of the Monetary Policy Committee (MPC), constituted under section 45ZB of the Reserve Bank of India Act, 1934, was held during June 3, 4 and 6, 2019 at the Reserve Bank of India, Mumbai. 2. The meeting was attended by all the members – Dr. Chetan Ghate, Professor, Indian Statistical Institute; Dr. Pami Dua, Director, Delhi School of Economics; Dr. Ravindra H. Dholakia, former Professor, Indian Institute of Management, Ahmedabad; Dr. Michael Debabrata Patra, Executive Director (the officer of the Reserve Bank nominated by the Central Board under Section 45ZB(2)(c) of the Reserve Bank of India Act, 1934); Dr. Viral V. Acharya, Deputy Governor in charge of monetary policy – and was chaired by Shri Shaktikanta Das, Governor. 3. According to Section 45ZL of the Reserve Bank of India Act, 1934, the Reserve Bank shall publish, on the fourteenth day after every meeting of the Monetary Policy Committee, the minutes of the proceedings of the meeting which shall include the following, namely: -
the resolution adopted at the meeting of the Monetary Policy Committee; -
the vote of each member of the Monetary Policy Committee, ascribed to such member, on the resolution adopted in the said meeting; and -
the statement of each member of the Monetary Policy Committee under sub-section (11) of section 45ZI on the resolution adopted in the said meeting. 4. The MPC reviewed the surveys conducted by the Reserve Bank to gauge consumer confidence, households’ inflation expectations, corporate sector performance, credit conditions, the outlook for the industrial, services and infrastructure sectors, and the projections of professional forecasters. The MPC also reviewed in detail staff’s macroeconomic projections, and alternative scenarios around various risks to the outlook. Drawing on the above and after extensive discussions on the stance of monetary policy, the MPC adopted the resolution that is set out below. Resolution 5. On the basis of an assessment of the current and evolving macroeconomic situation, the Monetary Policy Committee (MPC) at its meeting today decided to: - reduce the policy repo rate under the liquidity adjustment facility (LAF) by 25 basis points to 5.75 per cent from 6.0 per cent with immediate effect.
Consequently, the reverse repo rate under the LAF stands adjusted to 5.50 per cent, and the marginal standing facility (MSF) rate and the Bank Rate to 6.0 per cent. The MPC also decided to change the stance of monetary policy from neutral to accommodative. These decisions are in consonance with the objective of achieving the medium-term target for consumer price index (CPI) inflation of 4 per cent within a band of +/- 2 per cent, while supporting growth. The main considerations underlying the decision are set out in the statement below. Assessment Global Economy 6. Global economic activity has been losing pace after a somewhat improved performance in Q1:2019, reflecting further slowdown in trade and manufacturing activity. Among advanced economies (AEs), economic activity in the US strengthened in Q1, supported by higher government spending, increase in private investment and a lower trade deficit. However, factory activity and retail sales moderated in April. Economic activity in the Euro area has remained weak due to muted industrial activity and weak business confidence. Leading indicators point to a further slowdown in the Euro area in Q2. In the UK, GDP growth for Q1 picked up on high retail sales and government expenditure. However, the outlook is clouded by uncertainty relating to Brexit. The Japanese economy accelerated in Q1 on net exports gains and increased public investment. In April, industrial production improved, while retail sales fell. 7. Economic activity has slowed in many emerging market economies (EMEs). In Q1:2019, the Chinese economy grew at the same pace as in the previous quarter, though slightly above consensus expectations. However, incoming data on industrial production and retail sales suggest that the growth momentum may weaken in Q2. The Russian economy, which had shown some signs of recovery in Q4:2018, weakened in Q1 on muted domestic activity and trade. Economic activity in South Africa contracted in Q1 pulled down mainly by a sharp decline in manufacturing activity. Brazil’s economy contracted in Q1 for the first time since 2016 and there are fears that it could return to recession. 8. Crude oil prices remained volatile, reflecting evolving demand-supply conditions underpinned by the production stance of the OPEC plus, rising shale output, weakening global demand and geo-political concerns. The strengthening of the US dollar had weakened gold prices; however, prices picked up since the last week of May on escalating trade tensions, reviving its demand as a safe haven asset. Inflation remains below target in several economies, though it has shown an uptick since March. 9. Financial markets have been driven by uncertainties surrounding US-China trade negotiations and Brexit. In the US, the equity market has experienced some selling pressures since early May on escalation of trade tensions with China and recently, with Mexico. Equity markets in most EMEs have lost steam due to the waning risk appetite on rising geo-political uncertainties and weakening global trade prospects. Bond yields in the US picked up in April on better GDP data for Q1, but declined in May on subdued economic data and expectations of a dovish monetary policy stance. Bond yields in Germany slipped into negative territory on weak economic data; in Japan, they remained negative on indications of sustained accommodation. In many EMEs, bond yields have been falling with central banks adopting accommodative monetary policy to boost economic growth. In currency markets, the US dollar strengthened on better than expected domestic economic data for Q1. Most EME currencies have depreciated against the US dollar. Domestic Economy 10. Turning to the domestic economy, on May 31, 2019 the National Statistical Office (NSO) released quarterly estimates of gross domestic product (GDP) for Q4:2018-19 and provisional estimates of national income for 2018-19. GDP growth for 2018-19 has been estimated at 6.8 per cent year-on-year (y-o-y), down by 20 basis points from the second advance estimates released on February 28, pulled down by a downward revision in private final consumption expenditure (PFCE) and moderation in exports. Quarterly data show that domestic economic activity decelerated sharply to 5.8 per cent in Q4:2018-19 from 6.6 per cent in Q3 and 8.1 per cent in Q4:2017-18. Gross fixed capital formation (GFCF) growth declined sharply to 3.6 per cent, after remaining in double digits in the previous five quarters. Private consumption growth also moderated. The drag on aggregate demand from net exports increased in Q4 due to a sharper deceleration in exports relative to imports. However, the overall slowdown in growth was cushioned by a large increase in government final consumption expenditure (GFCE). 11. On the supply side, agriculture and allied activities contracted, albeit marginally, in Q4:2018-19 due to a decline in rabi production. According to the third advance estimates, foodgrains production at 283.4 million tonnes for 2018-19 was lower by 0.6 per cent compared with the previous year mainly due to lower production of rabi rice, pulses and coarse cereals. However, there has been a catch-up in foodgrains production relative to earlier estimates. Foodgrains stocks at 72.6 million tonnes as on May 16, 2019 were 3.4 times the prescribed buffer norms. Growth in manufacturing activity weakened sharply to 3.1 per cent from 6.4 per cent in the previous quarter. Service sector growth, however, accelerated, supported by financial, real estate and professional services, and public administration, defence and other services. In contrast, construction activity slowed down markedly. 12. Moving beyond Q4, the India Meteorological Department (IMD) has predicted that south-west monsoon rainfall (June to September) is likely to be normal at 96 per cent of the long period average (LPA). The current weak El Niño conditions over the Pacific are likely to continue during the monsoon. However, currently prevailing neutral Indian Ocean Dipole (IOD) conditions may turn positive in the middle of the monsoon season and persist thereafter, which augur well for the rainfall outlook. 13. Growth in eight core industries decelerated sharply in April, pulled down largely by coal, crude oil, fertilisers and cement. Credit flows from banks to large industries strengthened, though they remained muted for micro, small and medium industries. Based on early results of the Reserve Bank’s order books, inventory and capacity utilisation survey (OBICUS), capacity utilisation (CU) in the manufacturing sector improved to 77 per cent in Q4 from 75.9 per cent in Q3; seasonally adjusted CU, however, slipped marginally to 75.2 per cent in Q4 from 75.8 per cent in Q3. The business assessment index (BAI) of the industrial outlook survey (IOS) in Q1:2019-20 remained unchanged at its level in the previous quarter. Imports of capital goods – a key indicator of investment activity – remained anaemic in April. However, the manufacturing purchasing managers’ index (PMI) edged up to 52.7 in May with strengthening of output, new orders and employment. 14. High frequency indicators suggest moderation in activity in the service sector. Sales of commercial vehicles, tractors, passenger cars, and three and two wheelers contracted in April. Railway freight traffic growth decelerated. Domestic air passenger traffic growth contracted in March, but turned around modestly in April. Two key indicators of construction activity, viz., cement production and steel consumption, slowed down in April. The PMI services index moderated to 50.2 in May on subdued growth of new businesses. 15. Retail inflation, measured by y-o-y change in CPI, remained unchanged in April, at its March level of 2.9 per cent, with higher inflation in food and fuel groups being offset by lower inflation in items excluding food and fuel. 16. The April food inflation print showed an increase to 1.4 per cent from 0.7 per cent in March. Within the food group, vegetables moved out of nine months of deflation. However, three sub-groups, viz., fruits, pulses and sugar, remained in deflation in April, though the extent of deflation moderated. Among other food sub-groups, inflation in prices of milk, oils and fats, spices, non-alcoholic beverages and prepared meals moderated, while inflation in meat, fish and eggs prices ticked up. 17. Inflation in the fuel and light group rose to 2.6 per cent in April from the February trough of 1.2 per cent, pulled up by prices of liquified petroleum gas due to an increase in international prices. Inflation in subsidised kerosene also rose, reflecting the impact of the calibrated increase in its administered price. Electricity prices moved out of three months of deflation in April. Prices of rural fuel consumption items – firewood, chips and dung cake – moved into deflation. 18. CPI inflation excluding food and fuel fell sharply to 4.5 per cent in April from 5.1 per cent in March – the largest monthly decline since April 2017. The moderation in inflation was broad-based, with household goods and services, and personal care and effects sub-groups registering the largest fall in April; housing inflation was the lowest since June 2017, reflecting softening in house rents in urban areas. Inflation in clothing and footwear also touched its historical low in the new all-India CPI series. Inflation in education, health and transportation and communication moderated as well. 19. Inflation expectations of households in the May 2019 round of Reserve Bank’s survey declined by 20 basis points for the three-month ahead horizon compared with the previous round, but remained unchanged for the one-year ahead horizon. However, manufacturing firms participating in the Reserve Bank’s industrial outlook survey expect input cost pressures to intensify on account of higher raw material costs and salaries in Q2. Input price pressures eased in both agricultural and industrial raw materials. Nominal growth in rural wages and in organised sector staff costs remained muted. 20. Liquidity in the system turned into an average daily surplus of ₹66,000 crore (₹660 billion) in early June after remaining in deficit during April and most of May due to restrained government spending. The Reserve Bank injected liquidity of ₹70,000 crore (₹700 billion) in April and ₹33,400 crore (₹334 billion) in May on a daily net average basis under the LAF. It conducted two OMO purchase auctions in May amounting to ₹25,000 crore (₹250 billion) and a US dollar buy/sell swap auction of US$ 5 billion (₹34,874 crore) for a tenor of 3 years in April to inject durable liquidity into the system. The weighted average call money rate (WACR) – the operating target of monetary policy – remained broadly aligned with the policy repo rate: it traded above the policy repo rate (on an average) by 6 bps in April, but below the policy repo rate by 6 bps in May. The Reserve Bank has announced that it would conduct an OMO purchase auction of ₹15,000 crore (₹150 billion) on June 13, 2019. 21. Transmission of the cumulative reduction of 50 bps in the policy repo rate in February and April 2019 was 21 bps to the weighted average lending rate (WALR) on fresh rupee loans. However, the WALR on outstanding rupee loans increased by 4 bps as the past loans continue to be priced at high rates. Interest rates on longer tenor money market instruments remained broadly aligned with the overnight WACR, reflecting near full transmission of the reduction in policy rate. 22. Exports were unable to sustain the growth of 11.8 per cent observed in March 2019; they grew by 0.6 per cent in April 2019 dragged down by engineering goods, gems and jewellery, and leather products. Imports grew at a somewhat accelerated pace in April 2019 relative to the preceding month, driven by imports of petroleum (crude and products), gold and machinery. This led to a widening of the trade deficit, both sequentially and on a y-o-y basis. Provisional data suggest that net services exports in Q4:2018-19 were broadly comparable to their level a year ago which bode well for the current account balance. On the financing side, net foreign direct investment flows were stronger in Q4:2018-19 than a year ago. After a sharp recovery in March 2019, net foreign portfolio inflows were relatively modest at US$ 2.3 billion in 2019-20 in April-May. While the equity segment received net inflows during this period, the debt segment witnessed net outflows. India’s foreign exchange reserves were at US$ 421.9 billion on May 31, 2019. Outlook 23. In the bi-monthly monetary policy resolution of April 2019, CPI inflation was projected at 2.4 per cent for Q4:2018-19, 2.9-3.0 per cent for H1:2019-20 and 3.5-3.8 per cent for H2:2019-20, with risks broadly balanced. The headline inflation outcome in Q4 at 2.5 per cent was largely in alignment with the April policy projections. 24. The baseline inflation trajectory for 2019-20 is shaped by several factors. First, the summer pick-up in vegetable prices has been sharper than expected, though this may be accompanied by a correspondingly larger reversal during autumn and winter. More recent information also suggests a broad-based pick-up in prices in several food items. This has imparted an upward bias to the near-term trajectory of food inflation. Second, a significant weakening of domestic and external demand conditions appear to have led to a sharp broad-based decline of 60 bps in inflation excluding food and fuel in April; this has imparted a downward bias to the inflation trajectory for the rest of the year. Third, crude prices have continued to be volatile. However, its impact on CPI inflation has been muted so far due to incomplete pass-through. Fourth, near-term inflation expectations of households have continued to moderate. Taking into consideration these factors, the impact of recent policy rate cuts and expectations of a normal monsoon in 2019, the path of CPI inflation is revised to 3.0-3.1 per cent for H1:2019-20 and to 3.4-3.7 per cent for H2:2019-20, with risks broadly balanced (Chart 1). 25. Risks around the baseline inflation trajectory emanate from uncertainties relating to the monsoon, unseasonal spikes in vegetable prices, international fuel prices and their pass-through to domestic prices, geo-political tensions, financial market volatility and the fiscal scenario. 26. In the April policy, GDP growth for 2019-20 was projected at 7.2 per cent – in the range of 6.8-7.1 per cent for H1 and 7.3-7.4 per cent for H2 – with risks evenly balanced. Data for Q4:2018-19 indicate that domestic investment activity has weakened and overall demand has been weighed down partly by slowing exports. Weak global demand due to escalation in trade wars may further impact India’s exports and investment activity. Further, private consumption, especially in rural areas, has weakened in recent months. However, on the positive side, political stability, high capacity utilisation, the uptick in business expectations in Q2, buoyant stock market conditions and higher financial flows to the commercial sector augur well for investment activity. Taking into consideration the above factors and the impact of recent policy rate cuts, GDP growth for 2019-20 is revised downwards from 7.2 per cent in the April policy to 7.0 per cent – in the range of 6.4-6.7 per cent for H1:2019-20 and 7.2-7.5 per cent for H2 – with risks evenly balanced (Chart 2). 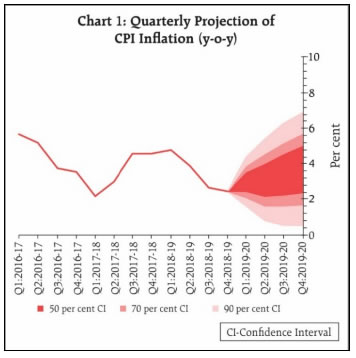
 27. The MPC notes that growth impulses have weakened significantly as reflected in a further widening of the output gap compared to the April 2019 policy. A sharp slowdown in investment activity along with a continuing moderation in private consumption growth is a matter of concern. The headline inflation trajectory remains below the target mandated to the MPC even after taking into account the expected transmission of the past two policy rate cuts. Hence, there is scope for the MPC to accommodate growth concerns by supporting efforts to boost aggregate demand, and in particular, reinvigorate private investment activity, while remaining consistent with its flexible inflation targeting mandate. 28. Against this backdrop, all members of the MPC (Dr. Chetan Ghate, Dr. Pami Dua, Dr. Ravindra H. Dholakia, Dr. Michael Debabrata Patra, Dr. Viral V. Acharya and Shri Shaktikanta Das) unanimously decided to reduce the policy repo rate by 25 basis points and change the stance of monetary policy from neutral to accommodative. 29. The minutes of the MPC’s meeting will be published by June 20, 2019. 30. The next meeting of the MPC is scheduled during August 5 to 7, 2019. Voting on the Resolution to reduce the policy repo rate by 25 bps to 5.75 per cent | Member | Vote | | Dr. Chetan Ghate | Yes | | Dr. Pami Dua | Yes | | Dr. Ravindra H. Dholakia | Yes | | Dr. Michael Debabrata Patra | Yes | | Dr. Viral V. Acharya | Yes | | Shri Shaktikanta Das | Yes | Statement by Dr. Chetan Ghate 31. Since the last review, there has been a further decline in the 3 month ahead inflationary expectations by 20 bps but with no change in the 1 year ahead inflationary expectations. Both the three month ahead inflationary expectations and the current perception of inflation have now declined in 4 consecutive rounds reflecting more benign inflation conditions. While inflationary expectations from RBI’s household survey may have bottomed out, I find it encouraging that the 58th round of the Survey of Professional Forecasters (SPF) indicates better anchoring of inflationary expectations to the medium target of 4 percent. 32. While headline inflation evolves in line with projections (April print was 2.92%, March print was 2.86%), food inflation has ticked up and doubled since the March print. I have been concerned that one year ahead headline inflation projections have been assuming lower food momentum, small deviations from which could easily make headline inflation projections breach the 4% target. More realistic baseline parameter assumptions used in current projections however rectify this, and suggest that 1 year ahead headline projections will undershoot the 4% medium target (average Q4 FY 20 values are 3.8%). 33. Inflation ex food fuel has precipitously dropped by 60 bps to 4.5% in April from 5.1% in March, which is the lowest print since September 2017. Even factoring in the latent pass through of the spike in crude that happened before the general election results were declared on May 23, the month-on-month SAAR rate for inflation ex food and fuel is still subdued in April 2019 (around 1.87%). 34. I see two risks here: first, the INR has depreciated more than other EME currencies in the last one year; second, crude prices tend to make the INR more vulnerable. I continue to remain watchful of the risk that the INR and crude will have on the trajectory of inflation ex food and fuel. Food inflation, however, will continue to normalize in the April-August period. It remains to be seen how strong the spillovers are from a cyclical seasonal movement, especially in vegetables, on inflation ex food and fuel. This should be carefully monitored. 35. On the growth front, compared to the last review, several indicators are flagging red. The crucial question is how deep is the cyclical downturn. 36. While RBI’s study on corporate performance for Q4 FY 19 indicates that demand conditions continued to moderate (proxied by nominal and sales growth of 1432 firms), this moderation was not broad-based. For instance, sales growth improved in sectors like food products and beverages, and remained steady and in double digits in cement and cement products and chemical and chemical products. Likewise, high double digit growth in sales was recorded in wholesale and retail trade and transport and storage services. Since new launches of private real estate continue to languish, it would appear that the stable growth in cement and steel could be driven by a government push in infrastructure building and affordable housing. A carefully done base-momentum decomposition analysis of seasonally adjusted Industrial GVA indicates that, during 2018-2019, barring the significant push to Industry GVA provided by the base effect in Q1, it is an unfavorable base effect which acted as a drag on industrial growth in the other quarters. Likewise, a decomposition of gross fixed capital formation (GFCF) into base and momentum effects indicates that investments during Q4: 2018-2019 were down primarily due to an adverse base effect, with some deceleration in momentum. Nominal GVA growth of listed private manufacturing companies however was dented by lower staff costs, which moved into single digit growth (6.4%) after many quarters, possibly reflecting lower employment creation. 37. There is a larger issue in my mind as to why RBI’s study on corporate performance paints a less drastic (or mixed) picture on the health of the economy when compared to say other indicators used in the national account statistics (NAS), or the IIP. It may possibly be because it samples a smaller universe of non-governmental non-financial (i.e., private sector) firms, although more analysis needs to be done. For instance, most consumption indicators in the IIP are now flashing red and have worsened since the last review. Consumer durable growth, reflecting stress in the auto sector, moved into contraction (-5.3%). Capital goods, reflecting the decline in machine and equipment, was also in contraction (-8.7%). Consumer non-durables growth, reflecting declines in discretionary income, was low (+0.3%). 38. These declines are reflected in a further widening in the output gap since the last review. The widening of the output gap is also in sync with a low print of Q4 FY 19 growth of 5.8%, and the virtual stalling of gross fixed capital formation growth in Q4 FY 19. 39. On the external front, the pace of activity has continued to slow down. The world output gap is more negative compared to a couple of months ago. I continue to view the consolidated fiscal deficit (as embodied in the public sector borrowing requirement) as jeopardizing the durability of the inflation target in the medium term. There are a few issues here. 40. One, our practice of fiscal policy where large swings in government final consumption expenditure in the final quarter of a fiscal year are required to meet fiscal deficit targets imparts substantial volatility to growth rates. This makes it difficult to design monetary policy. Second, fiscal ‘prestidigitation’ or sleight of hand may contribute to our own version of a “doom-loop”, i.e., by pushing expenditure off budget to meet deficit targets and then recourse to borrowing from the national small savings fund by state entities keeps administrative interest rates high to incentivise such savings. This impedes monetary transmission. Poor monetary transmission requires more active fiscal policy to compensate which breaches fiscal targets once again. 41. I also worry that the very nature of the Indian growth model, which requires excessive policy induced tinkering with the inter-sectoral terms of trade to meet both distributional objectives and demand push objectives makes fiscal-monetary coordination difficult. 42. The job of good monetary policy is to close gaps. A widening negative output gap and below target inflation warrants a monetary policy response. A rate cut at the current juncture would help both close the output gap and bring inflation back to target, a situation of “divine-coincidence”. 43. Going forward, I will remain data dependent, and will carefully watch the incoming growth and inflation data. 44. I vote to cut the policy rate by 25 basis points, and shift the stance to accommodative. Statement by Dr. Pami Dua 45. India’s Gross Domestic Product (GDP) growth in Q4:2018-19 decelerated sharply to a 20-quarter low of 5.8%, mainly due to a decline in the growth of gross fixed capital formation to 3.6% and moderation in growth of private consumption expenditure to 7.2%. While growth in government consumption expenditure was upbeat at 13.1% in Q4:2018-19, GDP growth for FY2019 was revised to a five-year low of 6.8%. Further, growth in agriculture turned negative (-0.1%) in Q4:2018-19 for the first time since Q3:2015-16, although services remained resilient. In addition, y-o-y growth in the Index of Industrial Production (IIP) decelerated in the months of January and February, followed by negative growth (-0.1%) in March. This was accompanied by negative growth in manufacturing (with 78% weight in IIP) in February and March. The use-based classification shows a declining trend in capital goods and consumer durables. Furthermore, high frequency indicators such as passenger vehicle sales, tractors and motorcycle sales suggest a slowdown in urban and rural demand. On the external front, growth in merchandise exports and imports has slowed, with exports witnessing a sharper deceleration, reflecting the slowdown in global demand, trade tensions and global uncertainties. 46. Meanwhile, the Purchasing Managers’ Index increased in May due to an expansion in output, new orders and employment. Further, RBI’s Business Expectations Index of the Industrial Outlook Survey for manufacturing anticipates modest improvement in Q2:2019-20. The OBICUS Survey (Order Books, Inventory and Capacity Utilisation Survey) conducted by RBI suggests a seasonal rise in capacity utilisation in Q4:2018-19. RBI’s Consumer Confidence Indices – Current Situation Index and Future Expectations Index – on the other hand, reflect a drop in the May round compared to the previous March round, implying lower current activity and a less optimistic outlook. On the brighter side, higher financial flows should enhance investment. 47. Headline inflation, measured by CPI inflation, remained at its March level of 2.9% in April, with increase in food and fuel inflation partly offset by the broad-based decline of CPI inflation excluding the food and fuel groups. Trends from surveys provided mixed signals. Inflation expectations of consumers, as captured through RBI’s Inflation Expectations Survey of Households, showed a decline for the three-month-ahead horizon by 20 basis points but were unchanged for the one-year-ahead horizon. At the same time, the Industrial Outlook Survey (IOS) showed an expectation of rising input costs in the upcoming quarter (Q2:2019-20). Going forward, upside risks to inflation include continuation of the uptick in food price inflation, uncertainties relating to monsoon, volatility in international oil prices, materialization of industry expectations of cost pressures as per the IOS and lastly, potential fiscal slippage. 48. Looking at the international scenario, a revival in global economic growth remains elusive, with the Economic Cycle Research Institute’s (ECRI) 20-Country Long Leading Index growth rate staying near its lowest reading in almost three years. Also, US economic growth is set to slow, while an inflation cycle downturn is poised to persist, given the decline in ECRI’s U.S. Future Inflation Gauge (a harbinger of inflation) to its lowest reading in over three years. Meanwhile, with ECRI’s Global Leading Manufacturing Index growth staying near a seven-year low, the global industrial growth outlook remains dismal. Of particular concern is that growth in ECRI’s Chinese Leading Industrial Production Index, which leads Chinese PMI data, slipped in its latest reading toward its recent multiyear low. This is the cyclical context of the recent escalation of its trade war with the US. 49. The gloomy global scenario also highlights the fact that India cannot rely on external engines of growth in the current circumstances. Thus, an internal boost to demand would be the preferable option. In the last two MPC meetings (February and April), the repo rate was cut by 25 basis points in each meeting. The transmission of these policy rate cuts of 50 bps to the weighted average lending rate (WALR) was 21 bps on fresh rupee loans. On the other hand, the WALR on outstanding loans increased by 4 bps, since past loans are priced at high rates. At the same time, longer tenor money market instruments were generally aligned with the weighted average call money rate (WACR), implying reasonable transmission of the reduction in the policy rate. In other words, while the transmission is not complete, its impact is visible. 50. Thus, given the deceleration in growth and in the context of projected headline inflation remaining below the target in 2019-20, I vote for a rate cut of 25 bps. To reinforce this, in an attempt to boost sentiment, I also vote to change the stance from neutral to accommodative. Statement by Dr. Ravindra H. Dholakia 51. In the MPC meeting of April 2019, I had clearly stated that there was a considerable space of about 75 bps to cut policy rate further and voted for a 25 bps reduction with a change of stance from neutral to accommodative. Subsequent developments have further opened up the space by about 20-25 bps. Forecast by RBI 3-4 quarters ahead on headline inflation is down by 10 bps and on annual real GDP growth by 20 bps. Oil prices have remained broadly in my expected range and are softening of late. Inflationary expectations are getting anchored. As I had argued in my statement last time, the core inflation (by whatever definition) shows a declining trend and is no longer sticky at high levels. Recent inflation prints for March and April 2019 show a sharp decline in the core inflation across several goods and services. Real interest rates are very high in the economy adversely impacting costs and thereby our global competitiveness. In my opinion, we should continue correcting our real interest rates by bringing down our policy rate. I, therefore, vote for changing the stance to accommodative and reducing the policy rate further by 25 bps, although I would have preferred to cut it by 40 bps this time. More precise considerations for my vote are as follows: -
Recent developments on global slowdown in growth and international trade, pile up of inventory of oil in USA, and geo-political tensions indicate that oil prices are not likely to breach the band of $ 58 to $ 73 on a durable basis in the near future. Therefore, its adverse impact on headline inflation, if at all, is not likely to be significant. -
Growth has seriously dipped and can recover relatively fast on the policy support though it is likely to remain well below the potential at least for next three-four quarters. This will lead to widening of the output gap already created. It would, therefore, put further downward pressure on wages and prices. -
Core inflation (with whatever precise definition) is already on a declining trend and is likely to continue to fall over time because of the above reasons. In addition, the inflationary expectations in the economy are also coming down. -
Food stocks are more than adequate and available predictions on monsoon are favourable. There is a possibility that food prices may not pick up to the extent predicted. If there are spikes in prices of some vegetables and fruits, they may be temporary and reversible over time. On the whole, there is a good chance that the food inflation and hence the headline inflation may undershoot the expectations. -
Central Banks all over the world have become more dovish in their tone and rate hikes are not only on hold but may reverse in some cases. This may generate additional space to correct our real interest rates. -
The concern about first, the fiscal slippage at this stage and second, its adverse impact on inflation in my opinion is both misconceived and misplaced. With substantial slowdown in real growth on one hand and inflation rate consistently undershooting both on retail and wholesale basis, the growth of nominal GDP has declined significantly compared to the one assumed for the budget preparation. Under such a cyclical downturn, the fiscal deficit can overshoot the target even without any change in the fiscal policy parameters such as tax rates and expenditure rates. This should not be considered as a fiscal slippage; otherwise the fiscal policy would turn pro-cyclical if the policy makers become obsessed to achieve the observed fiscal deficit target by reducing expenditures or increasing taxes. It would only destabilize the system further rather than stabilizing it as expected of the policy. In order to take care of this anomaly with the observed fiscal deficit target, theory suggests evaluating fiscal performance through the concept of “full-employment budget deficit” or “the structural budget deficit”, which is not observed but has to be calculated taking potential output rather than actual (or observed) output. In practical terms, if the slippage in fiscal deficit is on account of revenue shortfall consequent on the decline in the nominal income growth, it should not be considered a genuine fiscal slippage. If, however, the slippage is because of increased expenditures by the government, it would be a genuine slippage. The current situation needs careful consideration before we conclude on fiscal slippage, because the slippage seems to be more due to revenue shortfall than expenditure increase. Secondly, in the face of a serious slowdown in the economy, a stabilization policy such as fiscal policy should be counter-cyclical and not pro-cyclical. Temporary “observed fiscal slippage” under such circumstances is neither undesirable nor damaging. The fear that it would derail the government from the path of fiscal consolidation and discipline amounts to distrusting the intentions of the government that has a clear and strong political mandate to perform. In my opinion, therefore, under present conditions, concerns about temporary fiscal slippage are misplaced. Moreover, with existence of deficient aggregate demand, minor fiscal slippage in the observed deficit would not be inflationary. -
Finally, in most countries that matter to us in terms of trade and finance the real rates of interest are very low; or the real policy rate is barely positive. On the contrary, our real policy rate is in excess of 2 percent and our real interest rates are very high, making our production globally less competitive. We must bring it down to realistic levels of around 1.5 percent sooner than later. With expected inflation around 3.7 percent, there is a space of about 75-80 bps of rate cut. 52. It is prudent to create space for future policy action on either side when the conditions are good. When inflation is under reasonable control and upside risks are muted, this is the right time to correct the high real rates of interest. However, we have to be careful to avoid any knee-jerk reactions and proceed slowly but steadily. It is in this context that it is still not too late in my opinion to change the stance from neutral to accommodative by reducing the policy rate further by 25 bps. Statement by Dr. Michael Debabrata Patra 53. The formation of inflation over recent months is a story of compensating variations in components. But the sum of these parts has moved down over the twelve months ahead horizon on a trajectory that has itself been adjusted downwards four times successively (December 2018; February 2019; April 2019; and June 2019). Risks to the primary target of monetary policy are distinctly on the ebb. Inflation expectations are also better anchored than before. In fact, if one were to step back a little in time, it is evident that if the 2019-20 projections materialise, the MPC would have steered inflation at or below target on average for four years in a row in its five-year term of office. 54. The path of inflation in 2019-20 will likely encounter transient supply shocks such as pre-monsoon food price spikes, which monetary policy should look through and await their reversal. More importantly, this future path will also be conditioned by softening of more durable constituents, which perhaps mirrors the underlying state of the economy. And it is in this context that the conduct of monetary policy over the year ahead will get defined. 55. Lead and coincident indicators gleaned from surveys and other sources emit the following messages: -
weakening demand conditions facing manufacturing, which is also denting hiring intentions; -
elevated capacity utilisation in the absence of investment in new capacity; -
inventories of finished products in several sectors, including houses and automobiles; -
still weak pricing power among corporates; -
dipping consumer confidence in the economic situation and the employment outlook; -
professional forecasters expecting further moderation in private consumption, gross fixed investment, exports and imports. 56. I would submit that all this highlights the deterioration in the outlook for the economy in the year ahead. The recently released estimates of national income for Q4 2018-19 confirm the weakening of economic activity about which I have consistently expressed concerns in my minutes from February 2019. High frequency indicators for Q1 2019-20 point to a broad-basing of the slowdown. 57. Turning to the global economy, it is unlikely that global growth will be able to sustain the uptick in Q1 2019. Intensification of trade wars and geopolitical tensions amidst volatile crude prices and nervous financial markets render the outlook fraught with downside risks. India cannot afford to be complacent about the danger of the global slowdown deepening. 58. In my view, the evolving macroeconomic configuration imparts urgency to strong policy support for the flagging economy in pursuance of the goals set for the MPC. In fact, with inflation projected to remain below target, a higher weight needs to be assigned to growth relative to previous meetings. 59. Most important at this juncture: monetary policy by itself cannot bring about a reinvigoration of economic activity. Monetary policy is taking the lead as the first line of defence, but a coordinated full throttle effort by all arms of macroeconomic management is the need of the hour. 60. On these considerations, I vote for a 25 basis points reduction in the policy rate and a change in the stance of monetary policy to accommodation. Statement by Dr. Viral V. Acharya 61. “Why do old men wake so early? Is it to have one longer day?” wonders Santiago, the old fisherman, in “Old Man and the Sea” by Ernest Hemingway. I found myself preparing and writing these minutes early too, perhaps so I could have one longer drafting day! 62. Since the April 2019 meeting of the Monetary Policy Committee (MPC), inflation prints have been more or less consistent with RBI’s projections. Food inflation has risen more than expected, driven significantly by a seasonal summer uptick in vegetable prices. In contrast, inflation excluding food and fuel (ex-food-fuel) has registered a significant broad-based decline of 90 basis points (bps); this was both unexpected and unusually large in magnitude over a short period of two months. I have always put significant weight on ex-food-fuel inflation in my assessment of future inflation trajectory as it tends to be the more persistent component of headline inflation and it contains better signals about the underlying aggregate demand pressures. The signal conveyed by substantial softening of ex-food-fuel inflation has only been corroborated by the large negative surprise of the Q4:2018-19 GDP print, pulled down by a sharp deceleration in Gross Fixed Capital Formation (GFCF) growth to 3.6%, a 14-quarter low, explained possibly at least in part by a hysteresis effect induced by the pre-election uncertainty. 63. Altogether this led to the following considerations at my end regarding the inflation outlook: -
The broad-based decline in ex-food-fuel inflation is the primary contributor to softening of the inflation trajectory at the horizon of 12 months. While the level of ex-food-fuel inflation is presently at 4.5%, the fact that the level of food inflation is relatively low ensures that the headline trajectory over the next twelve months projected by the RBI staff remains below the MPC target of 4%, reaching 3.7% in Q4:2019-20. -
Food momentum has picked up significantly; late monsoon and prevailing drought conditions in many states suggest this momentum may sustain beyond just vegetable prices. While vegetable prices show seasonality during April-August that tends to reverse partly during September-March, the reversal pattern is less clear for the food basket as a whole. Nowcast data suggest that momentum in food prices is broad-based in May too, though it has softened from the first fortnight to the second fortnight. Overall, this has imparted an upward push to the food inflation trajectory, more so in the short term. -
Fuel prices had been rising internationally until the third week of May but have since corrected by over 10% due to the evolving trade war uncertainty and its implications for global demand in a scenario of more than expected supply response. The pass-through to domestic prices has, however, been incomplete. Hence, there is a latent inflation of around 15 basis points that will enter headline inflation if and when passed through; else, if it is absorbed by the government (through lower profits of public sector undertakings) then it will likely get generalised into headline inflation in due course through a higher fiscal deficit. Thus, even as the correction in fuel prices pulls the inflation trajectory down, the incomplete pass-through over the past few months negates some of the decline. 64. In summary, compared to the April 2019 policy, short-term headline inflation trajectory has risen but the 6-to-12-month trajectory has somewhat softened. For a change, I am not comparing this pattern to that observed in the revision of inflation expectations of households or in the survey of professional forecasters as these were received before the release of the Q4:2018-19 GDP print. 65. There is, however, an important upside risk to RBI’s projected inflation trajectory that I wish to highlight in particular – that of fiscal slippage. 66. Estimates of overall public sector borrowing requirement (PSBR) – which appropriately accounts for extra-budgetary resources and other off-balance sheet borrowings of central and state governments –have now reached between 8% and 9% of GDP1.This is at a level similar to that in 2013 at the time of the “taper tantrum” crisis. Following are some salient implications: -
While the consolidated fiscal deficit of the center and states might have improved since 2013, the PSBR suggests otherwise. -
PSBR has risen since 2014 even during high GDP growth years. The rise in PSBR in fact reflects a structural pattern of greater government expenditures and not just cyclical (such as due to weak tax collections from low growth). In other words, there is a significant aggregate demand push linked to government expenditure that needs to be recognised as a source of inflation; in particular, correct economic measurement of the fiscal slippage should factor in the implications of a rising PSBR rather than rely solely on the consolidated fiscal deficit figures. -
Even the cyclical component of PSBR, such as that in the last year due to lower tax collections, raises the inflation trajectory through an increase in issuance of public debt and country risk premium that feed into imported inflation. -
Further, PSBR impairs monetary policy transmission due to crowding out effects on market financing through public bonds and on bank deposits through small savings which continue to offer rates that are significantly higher than market yields. This channel bites particularly when the domestic savings rate is on a decline and increases economy’s reliance on external sources of funding. 67. The upcoming Union Budget is, therefore, key to understanding the inflation outlook, especially the response to ongoing distress in the agrarian economy, caused in part by low food prices and reflected in low rural inflation of less than 2% compared to urban inflation that remains above 4%. Would the response worsen the fiscal outlook for next year and beyond, or keep it contained through pursuit of much-needed reforms for the agricultural sector and reduction/rationalisation of other revenue expenditures? Equally importantly, the pattern of PSBR evolution during the rest of 2019-20 would also be critical for assessing the inflation outlook. Hence, the MPC needs to carefully watch out for these fiscal developments. 68. Turning to growth, the Q4:2018-19 GDP print has widened the traditional measure of the output gap to be more negative. Several coincident economic indicators for Q1:2019-20, such as consumer durables and non-durables consumption as well as investment activity continue to remain weak. It is to be noted though that my preferred measure of the output gap – the finance-neutral output gap (FNOG) – remains closed as (i) aggregate credit growth remains above nominal GDP growth rate; (ii) the impact of past two policy rate cuts will provide fuller transmission to the real sector over the next year; and, (iii) the post-election reduction of financial market uncertainty has led to a softening of the bond yields and a rebound in equity markets in May. In other words, growth has slowed down but financial conditions have eased which should provide a tailwind to growth and help investment activity revive on the back of steadily improving capacity utilisation. 69. Nevertheless, on balance, I concluded that the mixed picture on economic growth has morphed into one where at least some aspects have weakened considerably over the past two quarters. 70. In the April 2019 policy, I had voted to keep the policy rate at 6.25%, whereas the MPC had cut the policy rate to 6%. Counterfactual exercises suggest that under the baseline projections of the RBI, the policy repo rate at 6% is just "right" in the short term to achieve MPC's mandated target of 4% headline inflation in the medium term. However, the large decline in ex-food-fuel inflation since the April policy implies some space in these counterfactual exercises to accommodate growth weakness with a policy rate cut of around 20 basis points sometime in the middle of 2019-20. 71. I do remain concerned about the following upside risks to inflation: -
The monsoon uncertainty imparting further spike in food prices and the possibility of vegetable price reversal in winter months turning out to be lower than expected. Not only would this worsen the inflation outlook directly, but potentially also indirectly via the fiscal channel as it would aggravate the agrarian distress. -
The rise in implied volatility of international crude oil prices from 30% to 50% over the past month even as oil prices have corrected downwards. -
The possibility of an upward level-shift in the price of the Indian crude basket due to a shift in its composition from Iran and Venezuela to other oil suppliers. -
The fiscal undercurrents impacting the generalized inflation outlook. As also conveyed earlier, I worry especially about a worsening of the PSBR in conjunction with rising oil prices, say due to geopolitical tensions; such a coincidence creates a “twin deficit” – fiscal and current account deficits – scenario for imported inflation, a glimpse of which we have had only recently during H1:2018-19. 72. Let me elaborate on the last of these upside risks. The Indian economy appears to experience “twin deficit” related vulnerability on a regular basis when external shocks amplify domestic weaknesses. The key to dealing with such a scenario is the ability and the willingness of the central bank to maintain credibility of inflation targeting when imported inflation tends to rise steeply (e.g., due to rising oil prices, widening fiscal and current account deficits, and, in turn, depreciating currency). Since monetary policy response will cool down inflation only with substantive lags, some headroom needs to be maintained in the inflation trajectory below the mandated target so as to absorb the steep rise in imported inflation without the headline moving far away from the target. Similarly, headroom needs to be retained in the policy rate space so as to help revive growth with monetary accommodation once the economy has cooled off and twin deficits reined in. In my assessment, this is exactly the "robust" approach that the MPC had adopted during the last year2. 73. Finally, a few words on the trade war uncertainty and India are in order. By not being a significant part of global supply chains in manufacturing, India’s direct exposure to the present correction in global growth is likely to be somewhat muted. Indeed, this consideration has led to India being perceived by investors as somewhat of a “safe haven” economy. Hence, it is my view that growth concerns for India based on moderate trade war concerns are somewhat overstated. A full-scale trade war blowout may, however, result in an emerging markets sell-off by foreign portfolio investors, engulfing India’s external sector and raising prospects of imported inflation, especially if it coincides with a worsening PSBR, and even more perversely, if instead of easing due to weak global growth, oil prices were instead to rise from geopolitical tensions. 74. Counterfactual exercises suggest that a fiscal slippage of 50 basis points (a conservative assessment based on the PSBR estimates) or an oil price increase of 10% leave no space to cut the policy rate below 6%. 75. How should I vote? I found that I was speaking to myself as Santiago, the old fisherman, in “Old Man and the Sea” by Ernest Hemingway: “It is better to be lucky. But I would rather be exact. Then when luck comes, you are ready.” 76. In spite of my dilemma, I vote – albeit with some hesitation – to frontload the policy rate cut from 6% to 5.75% (a 50 basis points rate cut from my April vote to keep the policy rate at 6.25%). This would provide an insurance to help prevent the output gap from widening further or the finance-neutral output gap (FNOG) from turning negative. The MPC will need to remain on guard and be prepared to provide such insurance in a symmetric manner if upside risks to inflation were to materialize. 77. I also vote to change the monetary policy stance from neutral to accommodative. This is because the uncertainty around the upside risks to inflation I have highlighted will resolve only gradually over the next few months and can be factored into future MPC decisions in a data-dependent manner, but seem highly unlikely to lead to a rate hike at the next policy. Statement by Shri Shaktikanta Das 78. Since the last MPC meeting in April 2019, greater clarity has emerged about the evolving macroeconomic situation. Overall, there is clear evidence of economic activity losing traction, with the GDP growth in Q4:2018-19 slowing down to 5.8 per cent. CPI inflation excluding food and fuel registered a 20-month low in April 2019 even as the headline CPI inflation evolved broadly along the projected lines. High frequency indicators suggest that the global economy could not sustain the improved performance in Q1:2019 in the face of a sharp slowdown in trade and manufacturing. Consequently, central banks in both advanced and emerging market economies have adopted an accommodative stance in monetary policy. 79. CPI inflation in April 2019 remained unchanged at the previous month’s level of 2.9 per cent, though there were significant compositional shifts. Inflation in the food group increased sharply to 1.4 per cent in April 2019 from 0.7 per cent in March, with vegetables moving out of deflation after nine months. Inflation in the fuel and light group also rose to 2.6 per cent in April from the February low of 1.2 per cent, mainly due to an increase in the prices of liquified petroleum gas following increase in international prices. However, the increase in food and fuel inflation was entirely offset by a sharp decline in inflation in items excluding food and fuel to 4.5 per cent in April from 5.1 per cent in March – the largest monthly decline since April 2017. The moderation in inflation excluding food and fuel, reflecting weakening of demand conditions, was quite broad-based, spread across several groups like household goods and services, personal care and effects, education and housing. Inflation expectations of households in the May 2019 round of the Reserve Bank’s survey softened further by 20 basis points for the three-month ahead horizon as compared with the previous round, though they remained unchanged for the one-year ahead horizon. 80. Inflation projections have been revised to 3.0-3.1 per cent for H1:2019-20 (up by 10 basis points in comparison with the last policy) and to 3.4-3.7 per cent for H2 (down by 10 basis points relative to the last policy), with risks broadly balanced. There are, however, several uncertainties to the baseline inflation path – the progress of monsoon, unexpected spikes in vegetable prices, international petroleum product prices and their pass-through to domestic prices, volatility in financial markets, and the fiscal situation. 81. Turning to economic activity, the May 31, 2019 data release of the National Statistical Office (NSO) placed GDP growth for 2018-19 at 6.8 per cent, down by 20 basis points relative to its February 28, 2019 estimates. In Q4 of 2018-19, GDP growth decelerated sharply to 5.8 per cent from 6.6 per cent in Q3 and 8.1 per cent a year ago. Though the base effect played some part, growth momentum also slowed down. Investment activity, in particular, decelerated sharply. On the supply side, agriculture and allied activities contracted, while manufacturing activity weakened significantly. Service sector growth remained resilient, though construction activity decelerated markedly. 82. Looking ahead, the forecast of a normal south-west monsoon by India Meteorological Department (IMD) augurs well for agriculture. Even as the third advance estimates of foodgrains production for 2018-19 were lower (by 0.6 per cent) as compared with the previous year, adequate stocks of foodgrains (3.4 times the prescribed buffer norms) provide a backstop against any supply shocks. In the industrial sector, growth in eight core industries decelerated sharply in April. Credit flows from banks to large industries strengthened, though they remained muted for micro and small as well as medium industries. Seasonally adjusted capacity utilisation (CU) in the manufacturing sector slipped to 75.2 per cent in Q4 from 75.8 per cent in Q3. Growth in imports of capital goods – a key indicator of investment activity – remained weak in April. High frequency indicators suggest moderation in activity in the service sector. Sales of commercial vehicles, tractors, passenger cars, and two- and three-wheelers contracted in April. Cement production and steel consumption – the two key indicators of construction activity – slowed down in April. Overall imports in April grew at a much faster pace than exports. Projected GDP growth for 2019-20 is revised downwards from 7.2 per cent in the April policy to 7.0 per cent – in the range of 6.4-6.7 per cent for H1:2019-20 and 7.2-7.5 per cent for H2 – with risks evenly balanced. 83. Over the last few years, the Central Government has by and large followed a policy of fiscal prudence. It has adhered to the fiscal deficit glide path in the last 5 years, though at a somewhat slower pace than committed earlier. Public sector borrowing includes several public sector enterprises which have their own revenue streams to service their debt and take care of their liabilities. Borrowings by such public sector enterprises are mostly for capital expenditure. Hence, such borrowings should be viewed differently. 84. Liquidity in the system turned into surplus in early June after a large injection of durable liquidity by the Reserve Bank in the previous months. The 10-year government securities benchmark yield has declined by about 40 basis points from its average in April 2019 to about 7 per cent. The transmission of the cumulative reduction of 50 bps in the policy repo rate in February and April 2019 to fresh rupee loans has been 21 basis points. However, the weighted average lending rate on outstanding loans has increased by 4 basis points. Going forward, the transmission is expected to improve, given the lags with which banks adjust their deposit and lending rates in response to changes in the policy rate. It is to be noted that quite a sizable part of loan portfolio of banks continues at the base rate, which impedes monetary transmission. Interest rates on small savings are also higher than the prescribed formula. 85. In sum, growth impulses have clearly weakened, while the headline inflation trajectory is projected to remain below 4.0 per cent throughout 2019-20 even after considering the expected transmission of the past two policy rate cuts. Keeping in view the evolving growth-inflation dynamics, there is a need for decisive monetary policy action. Hence, my vote is to reduce the policy repo rate by 25 basis points. My vote is also to shift the stance of monetary policy from neutral to accommodative to send a clear signal. Yogesh Dayal
Chief General Manager Press Release: 2018-2019/3001
|