In an environment of formidable geo-economic fragmentation, elevated global food, energy and commodity prices, aggressive monetary policy tightening and spillovers, the Indian economy exhibited resilience in 2022-23. Overlapping supply shocks caused inflation to remain above the upper tolerance level of the inflation target for several months during the year. With the Reserve Bank acting pro-actively to tame inflation, monetary and credit conditions evolved in sync with the policy stance, even as targeted fiscal measures to contain inflation and fiscal consolidation strengthened macroeconomic stability. The current account deficit in the balance of payments remained sustainable and the health of the financial sector improved enabling a rebound in credit growth. II.1.1 The flaring up of geopolitical hostilities followed by a tightening of financial conditions on account of aggressive monetary policy actions worldwide dampened global macroeconomic outcomes during 2022 amidst heightened uncertainty. After the short-lived Omicron wave and a successful inoculation drive on a world-wide scale, with 64.20 per cent of world population fully vaccinated as on March 31, 2023, the resilience of the global economy stood out, causing the International Monetary Fund (IMF) to revise estimate of global growth for 2022 to 3.4 per cent in April 2023 from 3.2 per cent in October 2022. However, global trade (goods and services) growth for 2022 was revised down to 5.1 per cent in April 2023 from 5.4 per cent in January 2023. Global inflation remained uncomfortably high at 8.7 per cent in 2022, as against 4.7 per cent a year ago with inflation overshooting the target in an overwhelming majority of countries. Capital flows to emerging market economies (EMEs) remained subdued and volatile. II.1.2 The synchronised tightening of financial conditions across the globe was reflected in a sharp rise in sovereign bond yields. Other segments of the financial markets also witnessed amplified volatility, reflecting the impact of global spillovers amidst pervasive risk-off sentiments. The relentless appreciation of the US dollar exerted sustained depreciation pressures on currencies of other advanced economies (AEs) and EMEs, eroding a significant part of the foreign exchange reserve buffers of countries due to valuation losses. II.1.3 Turning to the domestic economy, a recovery gained momentum during the second quarter of 2022-23 as domestic supply chains normalised and activity in contact-intensive sectors rebounded. Robust balance sheets of the corporate sector and banks enabled a rebound in credit demand, which was also facilitated by a large increase in capex by the centre. With real GDP growing by an estimated 7 per cent, the Indian economy turned out to be one of the fastest growing major economies of the world during 2022-23. II.1.4 Headline CPI inflation, which was projected by the Reserve Bank before the war started in Ukraine to moderate to 4.5 per cent in 2022-23, surged to 6.7 per cent. The elevation in price pressures was broad based and sticky, exceeding the upper tolerance level of the inflation target in several months of the year. The Reserve Bank raised the policy repo rate cumulatively by 250 basis points (bps) and changed the monetary policy stance to withdrawal of accommodation, prioritising price stability while remaining mindful of growth. In view of the dominance of supply side factors in shaping the inflation trajectory, the government introduced several targeted item specific anti-inflationary measures. Fiscal policy demonstrated a commitment to consolidation while directing public expenditure towards a large increase in growth-supportive capex. Capital formation emerged as a lead driver of growth during 2022-23. II.1.5 Financial conditions remained supportive amidst moderation in surplus liquidity during the year. Money market interest rates rose, broadly in tandem with the policy repo rate movements. Medium to long-term sovereign bond yields hardened under the impact of global spillovers, but the term premium remained below pre-COVID levels. Corporate bond yields hardened during 2022-23, tracking the rise in benchmark G-sec yields, and higher credit spreads. Equity markets exhibited resilience despite heightened global uncertainties, occasionally decoupling from global equity market movements. The Indian rupee was impacted by the strengthening of the US dollar during 2022-23, amidst risk-off sentiments driving net portfolio outflows. II.1.6 Against this backdrop, the rest of the chapter is structured into six sections. An analysis of real economy is presented in section 2, followed by movements in commodity prices and a detailed analysis of the drivers of inflation in section 3. Developments in monetary aggregates and financial markets are presented in sections 4 and 5, respectively. Government finances (centre and states) are discussed in section 6, followed by an analysis of external sector developments in section 7. II.2 THE REAL ECONOMY II.2.1 The Indian economy exhibited robust resilience in 2022-23 amidst a global turmoil following the war in Ukraine, and recorded a growth of 7.0 per cent, the highest among major economies in the world. Barring the Omicron wave scare early in the year 2022, COVID-19 was largely on the ebb for most part of the year helping in restoration of consumer and business confidence. Contact-intensive activity gradually resuscitated during the year and the release of pent-up demand bolstered domestic activity. Sound macroeconomic fundamentals, a resilient financial system reflected in healthy balance sheets of banks and non-banking financial companies (NBFCs), and a deleveraged corporate sector imparted resilience to counter the adverse global spillovers. II.2.2 In this section, component-wise analysis of aggregate demand is presented in sub-section 2. An assessment of developments in aggregate supply conditions in terms of the performance of agriculture, industry and services are discussed in sub-section 3. A drill-down into employment and labour market developments is presented in sub-section 4. The final sub-section provides policy perspectives. 2. Aggregate Demand II.2.3 The second advance estimates (SAE) of national income that were released by the National Statistical Office (NSO) on February 28, 2023 indicated that aggregate demand, measured by real GDP, registered a growth of 7.0 per cent in 2022-23 vis-à-vis 9.1 per cent growth a year ago (Table II.2.1 and Appendix Table 1). With this, real GDP in level terms surpassed the pre-pandemic level of 2019-20 by 9.9 per cent. For the previous three years, GDP growth numbers were revised up by 20 bps (2019-20), 80 bps (2020-21) and 40 bps (2021-22) indicating that the growth momentum was stronger than what early estimates suggested. While both consumption and investment demand gained traction, adverse external demand conditions and the resultant larger deficit in net exports dragged down growth in 2022-23. Real GDP growth at 9.6 per cent remained robust during H1:2022-23 with a sharp acceleration in momentum from Q1 to Q2:2022-23. In Q3:2022-23, however, the momentum moderated (Chart II.2.1 and Appendix Table 2). II.2.4 Underlying the vicissitudes in aggregate demand conditions in 2022-23, were the compositional shifts among its major constituents (Chart II.2.2). Private final consumption expenditure (PFCE) registered a steady growth of 7.3 per cent, buoyed by an uptick in the contact-intensive activity including travel and tourism and an upbeat festival time demand in 2022-23. Government final consumption expenditure (GFCE) growth at 1.2 per cent remained muted as the government continued on a consolidation path to restore fiscal health while stepping up capital expenditure to support growth and investment. The improvement in the quality of expenditure bodes well for sustainability and de-risking of growth going forward. Gross fixed capital formation (GFCF) remained strong with a double-digit growth of 11.2 per cent in 2022-23, primarily aided by the government’s thrust on infrastructure. As a result, the ratio of real GFCF to GDP increased to 34.0 per cent in 2022-23 from 32.7 per cent in the preceding year. India’s exports, after exhibiting remarkable recovery post-COVID with a growth of 29.3 per cent in 2021-22, tapered to 11.5 per cent in 2022-23. As the growth in imports at 18.8 per cent outpaced the growth in exports, the drag from net exports further widened to 2.9 per cent of GDP in 2022-23 from 1.3 per cent in the preceding year. 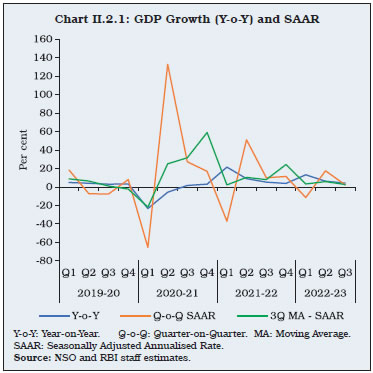
| Table II.2.1. Real GDP Growth | | Component | Growth (per cent) | | 2018-19 | 2019-20 | 2020-21 | 2021-22 | 2022-23 | | 1 | 2 | 3 | 4 | 5 | 6 | | I. Total Consumption Expenditure | 7.0 | 5.0 | -4.6 | 10.5 | 6.4 | | Private | 7.1 | 5.2 | -5.2 | 11.2 | 7.3 | | Government | 6.7 | 3.9 | -0.9 | 6.6 | 1.2 | | II. Gross Capital Formation | 6.2 | -6.0 | -11.6 | 22.2 | 9.6 | | Gross Fixed Capital Formation | 11.2 | 1.1 | -7.3 | 14.6 | 11.2 | | Change in Stocks | 27.3 | -58.7 | -85.5 | 687.8 | 1.9 | | Valuables | -9.7 | -14.2 | 26.4 | 34.0 | -14.8 | | III. Net Exports | | | | | | | Exports | 11.9 | -3.4 | -9.1 | 29.3 | 11.5 | | Imports | 8.8 | -0.8 | -13.7 | 21.8 | 18.8 | | IV. GDP | 6.5 | 3.9 | -5.8 | 9.1 | 7.0 | | Source: NSO. |
Consumption II.2.5 Emancipated from the COVID-19 induced restrictions which lingered for the previous two years, PFCE - the mainstay of aggregate demand - rebounded strongly to 13.2 per cent in 2022-23 above the pre-pandemic level. A well-rounded resumption in contact-intensive activity and pent-up demand in discretionary consumption spearheaded private consumption in the first half of the year. A resilient farm sector and an improvement in labour market conditions relative to the pandemic period supported the revival in consumption. The production of both consumer durables and non-durables weakened substantially in recent months, indicating a slowdown in consumption as the pent-up demand gradually weakened in the second half of the year. II.2.6 Indicators of consumption demand suggest a broad-based revival in 2022-23. Indicators pertaining to transport, viz., domestic air passenger traffic, railway passenger traffic and passenger vehicle sales recorded sharp upticks on y-o-y basis pointing towards a resumption in travel, tourism and hospitality. The revenge tourism across domestic leisure destinations combined with wedding/holiday season propelled the hotel, tourism and hospitality sector to turn around strongly and recuperate the loss suffered during the COVID-19 pandemic. Major labour market indicators - all-India unemployment rate, worker population ratio (WPR) and labour force participation rate (LFPR) surpassed their respective pre-COVID levels in Q1:2022-23. Salaries and wages in the corporate sector have registered steady growth in 2022-23. All these factors bode well for propelling consumption demand further. As per the March 2023 round of the consumer confidence survey (CCS) of the Reserve Bank, while the current situation index (CSI) improved further on account of improved sentiments on general economic situation, employment and household income, the future expectation index (FEI) remained positive despite marginally lower optimism. Household’s spending was buoyant for both essential and non-essential items with an expectation of a rise in non-essential outlay over the next year. II.2.7 Rural demand, which was deeply scathed by the second wave of COVID-19 a year ago recovered, albeit at a slower pace, vis-à-vis urban demand. Real rural wage growth virtually stagnated in 2022-23 despite a visible uptick in economic activity. Although job demand under the Mahatma Gandhi National Rural Employment Guarantee Scheme (MGNREGS) declined on a y-o-y basis, it still prevailed above the pre-pandemic level in 2022-23, indicating that the recovery, especially in the unorganised segment of the economy is not yet complete (Box II.2.1). Investment and Saving II.2.8 The rate of gross domestic investment in the Indian economy, measured by the ratio of gross capital formation (GCF) to GDP at current prices, surged to 31.4 per cent in 2021-22 from the COVID induced slump to 27.9 per cent in the preceding year. Although data on GCF are not yet available for 2022-23, movements in its constituents suggest an uptick primarily led by government spending on infrastructure. The strong pick up in credit growth in 2022-23 and upbeat investment sentiment reflected in the forward-looking surveys conducted by the Reserve Bank, in particular the industrial outlook survey (IOS), suggest that the investment cycle recovery is likely to continue (Box II.2.2). Box II.2.1
Unorganised Sector Recovery Post-Pandemic It has been widely conjectured that the economic loss on account of the COVID-19 pandemic continue to weigh heavily on unorganised sector activity. There is no official measure available on the nature of recovery of this segment of the economy post-pandemic. The very nature of operations of the unorganised or informal enterprises do not require maintenance of accounts or adherence to any regulations and hence, makes it difficult to have a proper account of unorganised sector activity in a timely manner. In the 2011-12 base year series, gross value added (GVA) generated within the household sector1 broadly captures the unorganised sector activity. The official estimates of the unorganised GVA are released on an annual basis with a lag of almost 10 months. Therefore, currently these data are available only up to 2021-22. Household sector GVA in real terms2 in 2021-22 is estimated to have increased by 3.1 per cent above the pre-pandemic level of 2019-20. The asymmetrical impact of the pandemic on the unorganised sector was corroborated by official data as well as survey-based studies and anecdotal evidence (Estupinan and Sharma, 2020). There was a sharp contraction even in nominal terms in the household GVA, while GVA of the organised sector registered marginal expansion in 2020-21. Within services, though both organised and household segments of hotels and restaurants; other services; transport; trade and repair; and construction registered a contraction, the contraction was more entrenched in the household segment. In an attempt to track the performance of the unorganised sector, a composite index for the unorganised sector activity at a monthly frequency is constituted adopting an indicator-based approach. The unorganised sector composite coincident index (UNCCI) with complete information set is available with a lag of 45 days since the end of a reference month. The high frequency indicators (HFIs) identified for the UNCCI broadly pertain to three categories in which the unorganised sector has a relatively larger presence – (i) agriculture; (ii) construction, trade and transport; and (iii) other miscellaneous activities. From a broader set of 15 indicators, the constituent indicators are selected based on their dynamic correlation with the benchmark indicator – household sector GVA growth. The UNCCIs have been developed using the dynamic factor model in the state-space framework (Geweke, 1977), which uses Kalman filter to derive the common trend from the constituent indicators. The UNCCI tracks the cataclysmic impact of COVID-19 and the subsequent recovery in the unorganised non-agriculture sector very well (Chart 1). The recent trajectory of the UNCCI points towards an uptick in November 2022 and showed further improvement in the subsequent months. The composite UNCCI stood robust at 6.9 per cent in March 2023. References: 1. Bhowmick, C., Goel, S., Das, S. and Gautam, (2022), ‘A Composite Coincident Index for Unorganised Sector Activity in India’, RBI Bulletin, December 2022. 2. Estupinan, Xavier and Sharma, Mohit, (2020), ‘Job and Wage Losses in Informal Sector due to the COVID-19 Lockdown Measures in India’, Rochester, New York. 3. Geweke, J. (1977), ‘The Dynamic Factor Analysis of Economic Time Series’ in Ainger, D.J. and Goldberger, A.S. (Eds), Latent Variables in Socio-Economic Models Pp 365-383, North-Holland Publications, Amsterdam. | II.2.9 Among the components of GFCF, activity in the construction sector is gathering traction owing to the focus of the government on infrastructure and the ebullient housing sector. This is evident from movement in its proximate coincident indicators – steel consumption and cement production (Chart II.2.3). Buoyant investment demand in machinery and equipment is evident from movements in their proximate coincident indicators – imports and production of capital goods – which have registered robust growth in 2022-23. Box II.2.2
Role of Credit in Driving a Turnaround in Private Investment Cycle Bank credit plays an important role in financing the investments of corporates in India. A sustained increase in credit may have lead information about investment demand pick-up while an occasional rise may indicate demand for working capital which could be for utilisation of current capacity. As of March 2023, the non-food credit growth (year-on-year) was robust at 15.4 per cent, same as that of the nominal GDP for 2022-23. The broad-based expansion in bank credit has been facilitated by healthier balance sheets of banks (Chart 1). Despite the increase in commodity prices and rise in interest rates, corporate investments have picked up in the recent period. To assess as to whether the rise in bank credit could revive the investment cycle, the relationship between borrowings and fixed investments of listed non-financial firms is examined by a dynamic panel model for the period 2011-12 to 2020-21 (Arellano and Bond, 1991). Results show that a one percentage point higher growth in bank borrowings increases nominal net fixed assets (NFA) by around 0.17 percentage points (Table 1). Higher inflation raises operating costs, which in turn, may reduce fixed investment. The sensitivity of fixed investment to bank borrowings falls during periods of higher inflation. This highlights the crucial role of low and stable inflation to the investment outlook. 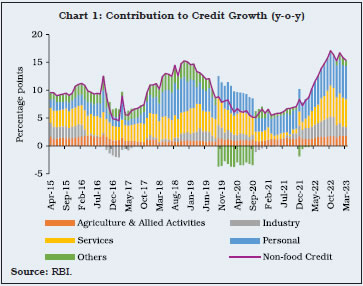
| Table 1: Bank Borrowing and Fixed Investment | | Explanatory Variables | ΔNFAit | ΔNFAit | ΔNFAit | ΔNFAit | | 1 | 2 | 3 | 4 | 5 | | ΔNFAi,t-1 | 0.133*** | 0.859*** | 0.424** | 0.0862* | | (0.0316) | (0.108) | (0.192) | (0.0515) | | Bank Borrowing Growthit | 0.158** | 0.174*** | 0.201* | 0.0252 | | (0.0630) | (0.0662) | (0.104) | (0.125) | | R & D Expenditure Growthit | 0.121*** | 0.0440 | 0.115* | 0.0474 | | (0.0436) | (0.0450) | (0.0683) | (0.0600) | | Operating Expenses Growthit | -0.258*** | | | -0.328** | | (0.0837) | | | (0.146) | | Inflationt | | -0.535** | 1.027*** | | | | (0.210) | (0.323) | | | Bank Borrowing Growthit X Inflationt | | | -0.0504*** | | | | | (0.0116) | | | Bank Borrowing Growthit X Operating Expenses Growthit | | | | 0.0231 | | | | | (0.0184) | | Constant | 6.315*** | 1.588 | -0.317 | 7.885*** | | (0.769) | (2.078) | (2.474) | (1.664) | | N | 117 | 117 | 117 | 117 | | AR(1), p-value | 0.0229 | 0.00760 | 0.00890 | 0.0232 | | AR(2), p-value | 0.264 | 0.180 | 0.133 | 0.243 | | Hansen Test, p-value | 0.920 | 0.804 | 0.999 | 0.853 | ***, **, and * indicate significance at 1 per cent, 5 per cent and 10 per cent level, respectively.
Note: Figures in the parentheses are standard errors. In the above table ‘i’ stands for sector and ‘t’ for time.
Source: RBI staff estimates. | To reconfirm the nature of revival in investment activity, investment cycles are estimated by employing an asymmetric band-pass filter on quarterly seasonally adjusted investment rate and real gross fixed capital formation data. Cycles extracted from both series corroborate cyclical revival in investment from the slump encountered during the first wave of the pandemic (Chart 2). The sustainability of the revival going ahead is contingent on lower and stable inflation in India, stronger growth in global output and trade, improvement in financial conditions, timely project completion by the corporates and a favourable commodity price outlook. Reference: Arellano, M., and Bond, S. (1991), ‘Some Tests of Specification for Panel Data: Monte Carlo Evidence and an Application to Employment Equations’, The Review of Economic Studies, 58(2), 277–297. | II.2.10 As per the order books, inventories and capacity utilisation survey (OBICUS) of the Reserve Bank, aggregate capacity utilisation (CU) of the manufacturing sector increased to 74.3 per cent in Q3:2022-23 from 74.0 per cent recorded in the previous quarter. The seasonally adjusted CU, however, declined by 40 bps and stood at 74.1 per cent in Q3:2022-23. For the manufacturing firms, new orders during Q3:2022-23 grew on a year-on-year basis. In Q3:2022-23, the ratio of both finished goods inventory (FGI) to sales and raw material inventory (RMI) to sales remained flat, reflecting a subdued demand condition. For Q4:2022-23, respondents of the IOS exhibited optimism, particularly regarding financial situation. 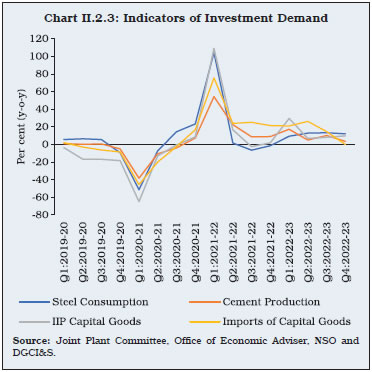 II.2.11 The rate of gross domestic saving as per cent to gross national disposable income (GNDI) surged to 30.0 per cent in 2021-22 from 28.4 per cent in the preceding year, led by lower dissaving of the general government sector, which offset the drop in household saving. The net financial saving of the household sector – the most important source of funds for the two deficit sectors, namely, the general government sector and the non-financial corporations – moderated to 7.6 per cent of GNDI in 2021-22, (Table II.2.2 and Appendix Table 3). The moderation in household financial saving in India is reflective of the release of pent-up demand, and the associated drawdown in precautionary saving as concerns relating to income flows subsided in 2021-22. | Table II.2.2: Financial Saving of Household Sector | | (Per cent of GNDI) | | Item | 2011-12 | 2012-13 | 2013-14 | 2014-15 | 2015-16 | 2016-17 | 2017-18 | 2018-19 | 2019-20 | 2020-21 | 2021-22 | | 1 | 2 | 3 | 4 | 5 | 6 | 7 | 8 | 9 | 10 | 11 | 12 | | A. Gross Financial Saving | 10.4 | 10.5 | 10.4 | 9.9 | 10.7 | 10.4 | 11.9 | 11.8 | 11.4 | 15.2 | 11.0 | | of which: | | | | | | | | | | | | | 1. Currency | 1.2 | 1.1 | 0.9 | 1.0 | 1.4 | -2.1 | 2.8 | 1.4 | 1.4 | 1.9 | 1.1 | | 2. Deposits | 6.0 | 6.0 | 5.8 | 4.8 | 4.6 | 6.3 | 3.0 | 4.2 | 4.3 | 6.2 | 3.5 | | 3. Shares and Debentures | 0.2 | 0.2 | 0.2 | 0.2 | 0.2 | 1.1 | 1.0 | 0.9 | 0.5 | 0.5 | 0.9 | | 4. Claims on Government | -0.2 | -0.1 | 0.2 | 0.0 | 0.5 | 0.7 | 0.9 | 1.1 | 1.3 | 1.3 | 1.2 | | 5. Insurance Funds | 2.2 | 1.8 | 1.8 | 2.4 | 1.9 | 2.3 | 2.0 | 2.0 | 1.7 | 2.8 | 1.9 | | 6. Provident and Pension Funds | 1.1 | 1.5 | 1.5 | 1.5 | 2.1 | 2.1 | 2.1 | 2.1 | 2.2 | 2.4 | 2.4 | | B. Financial Liabilities | 3.2 | 3.2 | 3.1 | 3.0 | 2.7 | 3.0 | 4.3 | 4.0 | 3.8 | 3.9 | 3.4 | | C. Net Financial Saving (A-B) | 7.2 | 7.2 | 7.2 | 6.9 | 7.9 | 7.3 | 7.5 | 7.8 | 7.6 | 11.3 | 7.6 | GNDI: Gross National Disposable Income.
Note: Figures may not add up to total due to rounding off.
Source: NSO. | II.2.12 The resource gap of private non-financial corporations widened in 2021-22 due to a revival in investment demand (Chart II.2.4). The dissaving by the general government sector reduced from an elevated level owing to the government’s commitment to fiscal consolidation after the COVID induced increase in fiscal deficit in 2020-21. 3. Aggregate Supply II.2.13 Aggregate supply, measured by gross value added (GVA) at basic prices, expanded by 6.6 per cent in 2022-23, as compared with a growth of 8.8 per cent a year ago. With gradual revival in economic activity, the three-quarter moving average of seasonally adjusted annualised growth rate (MA-SAAR) exhibited an upturn in Q2:2022-23, but moderated in Q3:2022-23 (Chart II.2.5). II.2.14 GVA growth was driven by a resilient agriculture sector and broad-based recovery in the services sector (Table II.2.3). On the other hand, the industrial sector decelerated sharply amidst intensification of input cost pressures, supply chain disruptions and fledgling global demand conditions. Agriculture and Allied Activities II.2.15 Agriculture and allied sector growth moderated marginally in 2022-23, for the third consecutive year. The GVA of the sector grew by 3.3 per cent during 2022-23 on record production of foodgrains (including rice, wheat, maize, barley and pulses), sugarcane and rapeseed and mustard. The sector’s buoyancy during the year was generally supported by normal cumulative south-west monsoon (SWM) rainfall - despite its uneven distribution over time and across regions, and delayed withdrawal - and normal north-east monsoon rains. Deficient winter season rainfall (January-February) and the consequent above-normal temperature observed during February 2023 - the crucial month when flowering and grain-filling occurs in wheat and other rabi crops as well as in horticulture crops - posed downside risks to rabi production. Moreover, the unusual showers accompanied with the hailstorms during the month of March caused further risk to the rabi crops and delayed the harvesting of the crops in major producing states. II.2.16 The uneven temporal and spatial distribution of the SWM adversely impacted the progress of kharif sowing, reducing the area under cropping. Though the monsoon landed on the Indian mainland on May 29, 2022 (two days prior to its normal date) in line with the India Meteorological Department (IMD)’s forecast, rainfall remained less than normal in June 2022, delaying the onset of kharif sowing. Rainfall fluctuated from July 2022 through September 2022 (Chart II.2.6). However, cumulative rainfall at the end of the season (September 30, 2022) was normal at 6 per cent above the long period average (LPA). Spatially, while rains in north-west India hovered around the normal benchmark, central India and south peninsula received episodes of excessive rains during the middle as well as the end of the season, exposing some of the standing crops to damage. The east and north-east regions, which contribute more than one-third of India’s rice production, witnessed deficit rainfall during most of July to August 2022, the crucial months of kharif sowing. Notably, states like Bihar, Uttar Pradesh, Jharkhand, and West Bengal faced a deficit of more than 20 per cent as compared to their respective normal levels of rainfall. The final kharif acreage as at end-September 2022 was lower by 0.8 per cent as compared with the previous year. | Table II.2.3: Real GVA Growth | | (Per cent) | | Sector | 2018-19 | 2019-20 | 2020-21 | 2021-22 | 2022-23 | | 1 | 2 | 3 | 4 | 5 | 6 | | I. Agriculture, Forestry and Fishing | 2.1 | 6.2 | 4.1 | 3.5 | 3.3 | | II. Industry | 4.9 | -2.5 | 0.9 | 10.5 | 1.7 | | II.1 Mining and Quarrying | -0.8 | -3.0 | -8.6 | 7.1 | 3.4 | | II.2 Manufacturing | 5.4 | -3.0 | 2.9 | 11.1 | 0.6 | | II.3 Electricity, Gas, Water Supply and Other Utility Services | 7.9 | 2.3 | -4.3 | 9.9 | 9.2 | | III. Services | 7.1 | 5.8 | -7.9 | 9.6 | 9.3 | | III.1 Construction | 6.5 | 1.6 | -5.7 | 14.8 | 9.1 | | III.2 Trade, Hotels, Transport, Communication and Services Related to Broadcasting | 7.2 | 6.0 | -19.7 | 13.8 | 14.2 | | III.3 Financial, Real Estate and Professional Services | 7.0 | 6.8 | 2.1 | 4.7 | 6.9 | | III.4 Public Administration, Defence and Other Services | 7.5 | 6.6 | -7.6 | 9.7 | 7.1 | | IV. GVA at Basic Prices | 5.8 | 3.9 | -4.2 | 8.8 | 6.6 | | Source: NSO. |
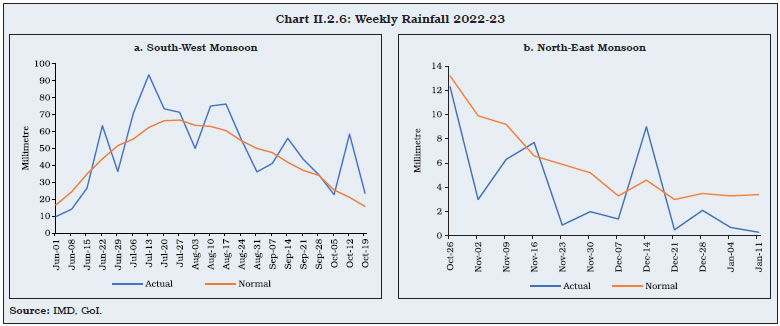 II.2.17 The withdrawal of SWM started around September 20, 2022 and ended on October 23, 2022. The slow withdrawal was due to cyclonic disturbances in the Bay of Bengal. As a result, most of the sub-divisions received heavy rains during September and October 2022. These rains ensured congenial soil moisture content as well as sufficient reservoir levels, which augurs well for the rabi season crops. The reservoir water storage level stood at 70 per cent of the full reservoir capacity as on January 12, 2023 (end of north-east monsoon) which was at par with the previous year’s level and 20 per cent higher than the last 10-year average (Chart II.2.7). Aided by these factors, the rabi crop sowing season 2022-23 ended with a record acreage of 720.7 lakh hectares, surpassing the last year’s sowing by 3.3 per cent. The jump in rabi crops acreage was mainly driven by wheat, rice, maize, lentil, rapeseed and mustard. Consequently, total foodgrains production in 2022-23 is estimated at 3,305.3 lakh tonne, as per the third advance estimates (3rd AE), 4.7 per cent higher than the final estimates (FE) for 2021-22 (Table II.2.4). The record foodgrains production for the seventh consecutive year is mainly contributed by rabi crops (9.5 per cent y-o-y growth) as production of kharif crops contracted marginally [(-)0.2 per cent]. As regards the horticulture production, the third advance estimates (3rd AE) for 2021-22 revised the overall production upward by 7.0 lakh tonne to 3,423.3 lakh tonne, 2.3 per cent higher than that of 2020-21, driven by an increase in production of both fruits and vegetables. 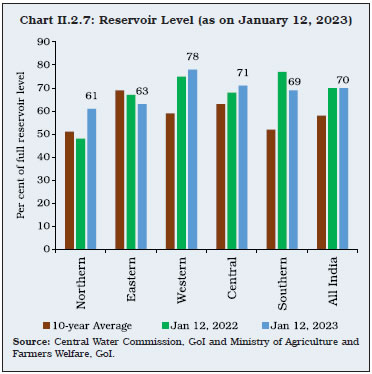
| Table II.2.4: Agricultural Production 2022-23 | | (Lakh tonne) | | Crop | 2021-22 | 2022-23 | 2022-23 (3rd AE) Variations (Per cent) | | 3rd AE | Final | Target | 3rd AE | Over 2021-22 | Over 2022-23 | | 3rd AE | FE | Target | | 1 | 2 | 3 | 4 | 5 | 6 | 7 | 8 | | Foodgrains | 3,145.1 | 3,156.2 | 3,280.0 | 3,305.3 | 5.1 | 4.7 | 0.8 | | Kharif | 1,549.3 | 1,553.6 | 1,631.5 | 1,551.2 | 0.1 | -0.2 | -4.9 | | Rabi* | 1,595.9 | 1,602.5 | 1,648.5 | 1,754.2 | 9.9 | 9.5 | 6.4 | | Rice | 1,296.6 | 1,294.7 | 1,305.0 | 1,355.4 | 4.5 | 4.7 | 3.9 | | Wheat | 1,064.1 | 1,077.4 | 1,120.0 | 1,127.4 | 6.0 | 4.6 | 0.7 | | Pulses | 277.5 | 273.0 | 295.5 | 275.0 | -0.9 | 0.7 | -6.9 | | Oilseeds | 385.0 | 379.6 | 413.5 | 410.0 | 6.5 | 8.0 | -0.8 | | Sugarcane | 4,305.0 | 4,394.3 | 4,150.0 | 4,942.3 | 14.8 | 12.5 | 19.1 | | Cotton # | 315.4 | 311.2 | 370.0 | 343.5 | 8.9 | 10.4 | -7.2 | | Jute & Mesta ## | 102.2 | 101.5 | 105.0 | 94.9 | -7.1 | -6.5 | -9.6 | *: Including summer crops production. #: Lakh bales of 170 kg each. ##: Lakh bales of 180 kg each.
Source: Ministry of Agriculture and Farmers Welfare, GoI. | II.2.18 In line with the approach adopted in recent years, the minimum support prices (MSPs) announced in 2022-23 for both rabi and kharif crops ensured a minimum return of 50 per cent over the cost of production3. The prices increased in the range of 2.0 per cent (for gram) to 9.1 per cent (for lentils) across crops. As on March 31, 2023, the procurement of rice was 492.2 lakh tonne during the kharif marketing season of 2022-23, which is 2.2 per cent lower than the corresponding period of last year (Chart II.2.8). As a result, the buffer stocks of rice stood at 3.2 times the buffer norm as on March 31, 2023 (Chart II.2.9). 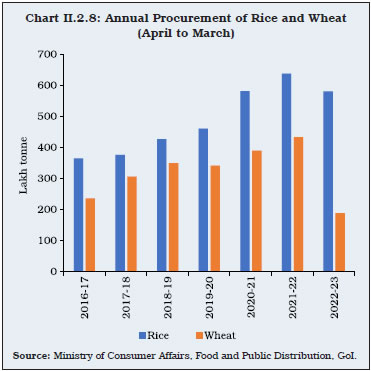
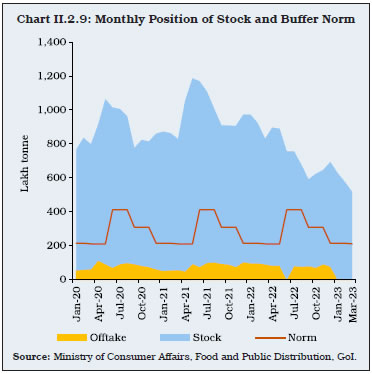 II.2.19 Wheat stocks were 1.1 times the buffer norms (as on March 31, 2023) due to a y-o-y decline of 56.6 per cent in its procurement in the rabi marketing season of 2022-23. The lower procurement of wheat was mainly on account of yield loss due to persistent heatwaves during the harvesting months of March and April 2022; and the rise in wheat exports after the outbreak of the Russia-Ukraine war. The Government of India imposed restrictions on exports of wheat (on May 14, 2022), wheat-based products (on August 25, 2022) and broken rice as well as higher export duties on non-basmati rice except for parboiled rice to ensure domestic availability. In the months of February and March 2023, the government also offloaded 3.4 million tonne of wheat from the central pool stock to the market through e-auctions under the open market sale scheme (domestic) to curb inflationary pressures from wheat. II.2.20 To offset the declining stocks of wheat, the distribution of wheat under the Pradhan Mantri Garib Kalyan Anna Yojana (PM-GKAY) was substituted with rice in the sixth and seventh phases of the scheme during April-December 2022. Since its inception in April 2020, the distribution of foodgrains under the scheme accounted for a significant share in the total offtake under the public distribution system (PDS) [Chart II.2.10]. With the pandemic ebbing, the foodgrains distribution under PM-GKAY was discontinued from January 1, 2023. Instead, the Union Government announced Integrated PM-GKAY scheme that made provision that the foodgrains (rice, wheat and coarse grains) provided under the National Food Security Act (NFSA), which included 5 kg. per person per month to the priority households’ beneficiaries and 35 kg. per household per month to the Antyodaya Anna Yojana beneficiaries to about 81.35 crore beneficiaries, at subsidised prices (₹3/2/1 per kg. of rice/wheat/coarse grains, respectively), would be given free of charge in 2023. 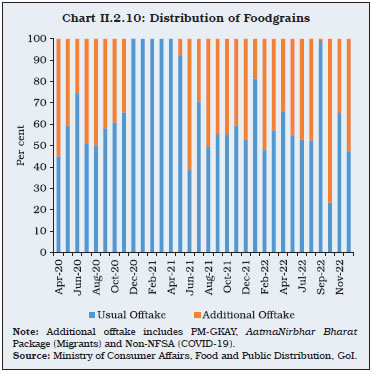 Industrial Sector II.2.21 During 2022-23, the industrial sector’s growth moderated amidst lingering global uncertainties. The organised manufacturing sector which benefitted from the lower base as well as softer raw material costs during 2021-22 faced the brunt of rising raw material costs in H1:2022-23 (Chart II.2.11). The supply chain bottlenecks following the war in Ukraine coupled with elevated raw material costs, impacted the profitability of manufacturing companies. While increased sales in Q1:2022-23 cushioned the hike in raw material costs, the global slowdown impacted sales in Q2:2022-23 adversely, resulting in profit diminishing at an accelerated pace. In Q3:2022-23, a moderation in input costs could only contain the decline in profits to some extent. 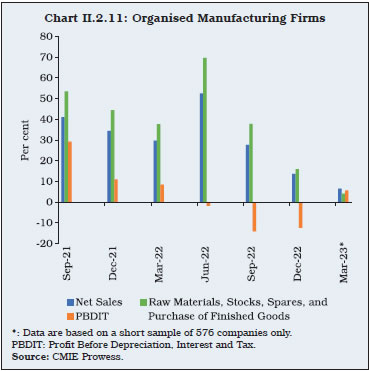 II.2.22 Industrial output measured by the index of industrial production (IIP) expanded by 5.1 per cent during 2022-23 as compared to 11.4 per cent last year. Manufacturing sector, which accounts for three-fourths of the industrial sector largely shaped the industrial sector recovery (Chart II.2.12). Within the manufacturing sector, 19 out of 23 industry groups recorded expansion in H1:2022-23, fuelled by manufacturing of motor vehicles, coke and refined petroleum products, basic metals, chemical products, and machinery and equipment. Manufacturing activity moderated to 2.4 per cent in H2:2022-23, affected by a slowdown in global demand. Labour-intensive sectors such as textiles, wearing apparel, leather and related products, computer, electronic and optical products, and electrical equipment recorded contraction in H2:2022-23, while basic metals, motor vehicles, trailers and semi-trailers, machinery and equipment, and other non-metallic mineral products recorded expansion. The automobile sector, which was riddled by supply chain bottlenecks, bounced back during 2022-23 supported by festive season sales. 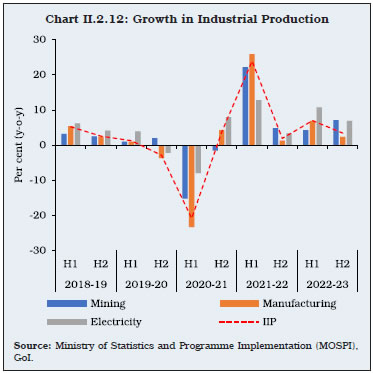 II.2.23 In terms of use-based classification in H1:2022-23, all categories recorded y-o-y expansion barring consumer non-durables, while in H2:2022-23, only consumer durables registered a decline. In 2022-23, primary goods, and infrastructure/construction goods recorded robust growth on a y-o-y basis as well as over the pre-pandemic year 2019-20. While capital goods supported a rise in economic activity, production of consumer goods remained sluggish, with production of consumer durables remaining below the pre-pandemic output levels of 2019-20 and consumer non-durables remained flat during 2022-23 (Chart II.2.13). 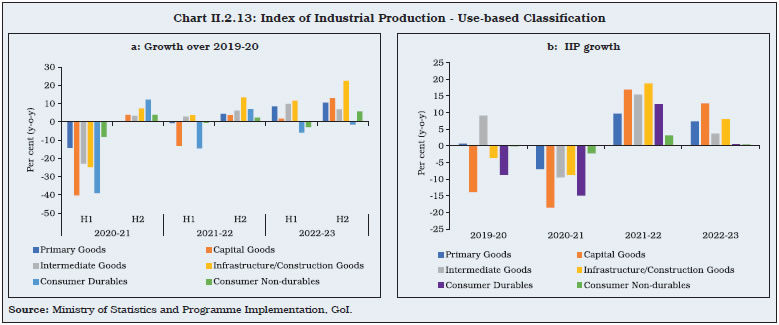 II.2.24 The micro, small and medium enterprises (MSMEs) segment, which contributes about 29 per cent of India’s GDP and employs over 11 crore workers, recorded a modest recovery. The revenue for the MSME sector is projected to exceed the pre-COVID level in 2022-23 by 25 per cent.4 With 99.8 per cent of MSMEs being unregistered, they account for a sizeable share of the unorganised sector output and employment [National Sample Survey Organisation (NSSO), 2015-16]. Various policy measures were introduced to support the sector from the onslaught of the COVID-19 pandemic, including the Emergency Credit Line Guarantee Scheme (ECLGS), which aimed at meeting their liquidity needs for sustaining business operations. As per the assessment of the Credit Information Bureau (India) Limited (CIBIL), the scheme assisted MSME borrowers in managing their businesses better with lower non-performing assets (NPAs) for borrowers availing the facility as compared to borrowers who were eligible but did not avail of it (across all categories of micro, small and medium industries) [Chart II.2.14]. 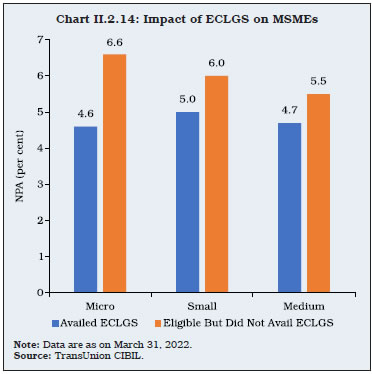 II.2.25 The mining sector output recorded 4.3 per cent y-o-y growth in H1:2022-23, mainly on account of a double-digit growth in coal production, that became necessary to compensate for the reduced imports in response to high international prices. In H2:2022-23 mining sector remained robust with 7.1 per cent y-o-y growth, coal continued to register strong growth, while crude oil recorded a contraction in H2:2022-23. Electricity generation expanded at 10.8 per cent during H1:2022-23 led by strong growth in thermal and renewable energy but moderated to 6.9 per cent in H2:2022-23. Renewable energy, which accounts for 12.6 per cent of the overall generation, recorded a robust 21.3 per cent growth during H2:2022-23 from that of 17.3 per cent during H1:2022-23. While India missed the renewable energy capacity target of 175 gigawatt (GW) by 2022, the progress made so far is commendable as the installed capacity of renewable energy (excluding hydro), increased by 81.3 per cent between 2017-18 and 2022-23 making the share of renewables5 (excluding hydro) in total installed capacity rise to 30.1 per cent in March 2023. The share of renewable sources in total power generation has also been rising consistently from 7.2 per cent in the quarter-ended September 2015 to 12.6 per cent in the quarter-ended March 2023 (Chart II.2.15). II.2.26 The outstanding overdues of the electricity distribution companies (DISCOMs) owed to electricity generation companies (GENCOs) is a major issue plaguing the power sector in India. To address this, the government had introduced the late payment surcharge (LPS) scheme in May 2022, under which all dues to power generator till June 3, 2022 are being liquidated in up to 48 instalments. Accordingly, the total outstanding dues by DISCOMS came down considerably to ₹58,231 crore as on March 1, 2023 from ₹1,00,018 crore on May 18, 2022. Services Sector II.2.27 Services sector, which being contact-intensive faced the major brunt of COVID-19 pandemic, revived strongly in 2022-23. The high frequency indicators of services sector indicated strong growth in Q1:2022-23 supported by low base, but the momentum moderated in Q2 and Q3. In Q4:2022-23, three-wheeler sales, air passenger traffic and GST E-way bills improved while sales of passenger vehicles and construction sector moderated. Among sectors, construction, domestic trade and transport surpassed their pre-pandemic levels, while aviation, tourism and hospitality sectors, though recovering, are yet to reach the respective pre-pandemic levels (Table II.2.5). 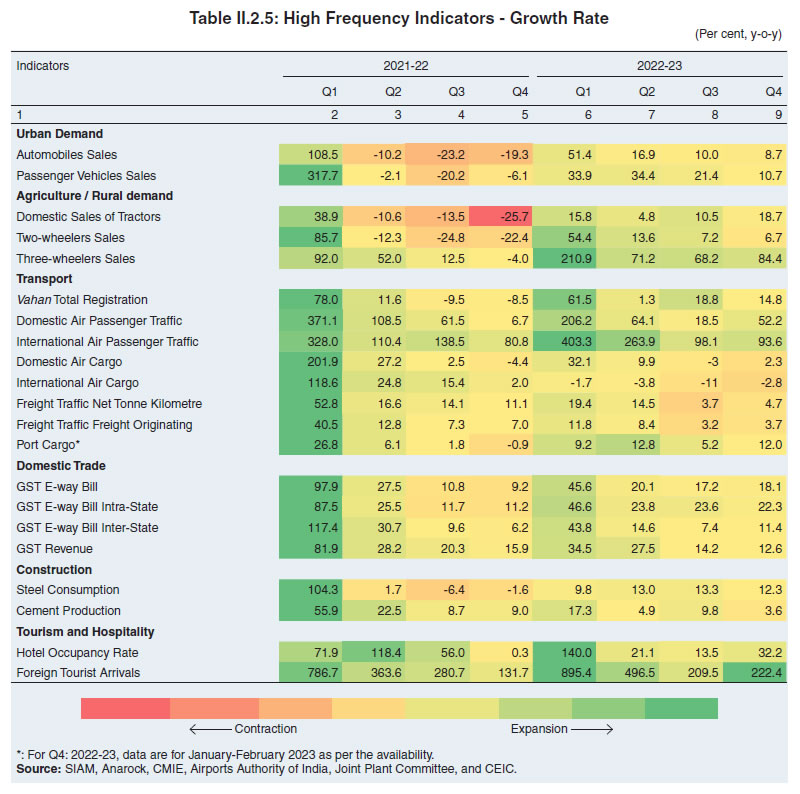 II.2.28 The construction sector remained upbeat due to sustained impetus on infrastructure spending by the government. After a robust performance in the pandemic afflicted years, the information technology sector moderated in 2022-23, with companies recording a decline in profits due to a slowing global economy. The hospitality sector bounced back in 2022-23 as demand for leisure and corporate travel boosted activity. In the financial sector, aggregate deposits and bank credit to the commercial sector recorded expansion. Public administration, defence and other services (PADO) remained resilient in 2022-23 primarily on account of a sharp pick up in other services while government expenditure – especially that of the central government remained muted during the year. II.2.29 Pent-up demand and robust consumer sentiment for home ownership in the aftermath of the pandemic underlay strong recovery in the residential housing sector in 2022-23. In 2022-23, housing launches improved consistently in terms of completed projects after two years of intermittent shutdowns. Housing sales picked up in H1:2022-23 and recovered in Q4 after briefly losing momentum in the third quarter. As launches surpassed sales, unsold inventory increased (Chart II.2.16). 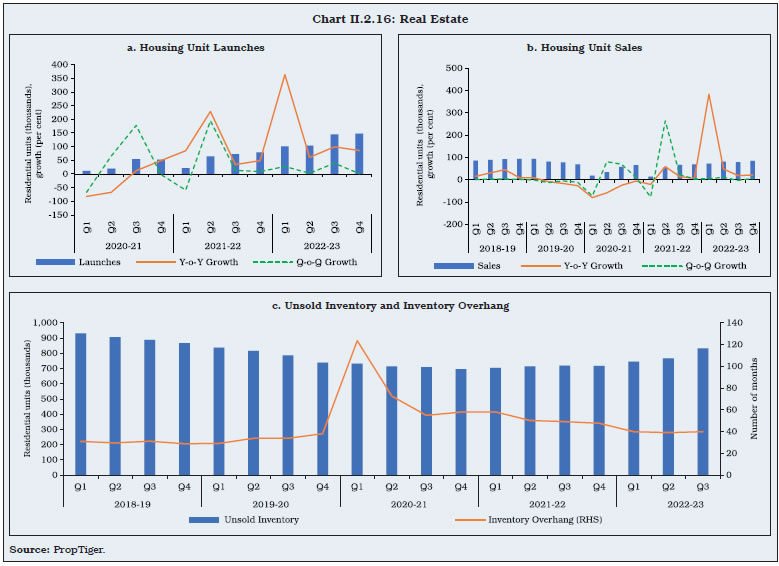 II.2.30 The pandemic boosted digitalisation across sectors. The digital adoption helped sustain economic activity by facilitating quick re-orientation of business operations. Indian technology companies, consisting of 1,08,585 companies, with 30,887 companies having a total funding of US$ 181 billion, as on March 3, 2023, overarchingly rely on the internet ecosystem for their core business activities. India also has the third largest start-up ecosystem in the world with government recognised start-ups rising to 26,542 in 2022 (Chart II.2.17). II.2.31 Aviation passenger traffic performed better than cargo traffic in H1:2022-23 and H2: 2022-23, although it remained below pre-pandemic levels. Port cargo remained firm in H1:2022-23 but moderated in subsequent quarters as international trade decelerated. GST E-way bills, GST revenues and railway freight collection exhibited buoyant momentum in 2022-23 (Table II.2.5). II.2.32 The Reserve Bank’s services sector composite index (SSCI)6, which tracks activity in construction, trade, transport and financial services and is a coincident indicator of GVA growth in the services sector excluding PADO, witnessed a further uptick in Q4:2022-23 (Chart II.2.18). 4. Employment II.2.33 The labour market indicators from the annual periodic labour force survey (PLFS) suggest a declining trend in the unemployment rate amid rising labour force participation rate during 2021-22 (Chart II.2.19). II.2.34 As per the quarterly PLFS, the labour market conditions in urban areas have shown consistent improvement during 2022-23. Labour force participation during Q3:2022-23 surpassed the pre-pandemic January-March 2020 level. Worker to population ratio peaked during October-December 2022 and the unemployment rate stood at its lowest since the start of the survey in 2017-18 (Chart II.2.20).
II.2.35 Organised sector employment, as measured by payroll data, indicated recovery in job creation in 2022-23. The average net subscribers added to Employees’ Provident Fund Organisation (EPFO) per month increased to 11.5 lakh in 2022-23 from 10.2 lakh in 2021-22, signalling an improvement in formal employment opportunities. II.2.36 The various alternate employment indicators also showed steady improvement in employment conditions during 2022-23. The purchasing managers’ index (PMI) for employment showed continued uptick in payroll hiring in both manufacturing and services sector. The employment index remained above ‘no change’ level of 50 for the manufacturing sector all through 2022-23 except for a marginal contraction in March 2023, while for services, it was positive for the entire period except for a marginal decline in May 2022. Similarly, the Naukri index which provides information on hiring activity based on the job listings on Naukri.com has also showed improvement in employment conditions during 2022-23 (Chart II.2.21). 5. Conclusion II.2.37 India exhibited robust growth in 2022-23 amidst prevailing global headwinds. Sound domestic macro-fundamentals, fiscal policy thrust on capex, healthy balance sheets of the corporate sector and the financial sector, and structural reforms announced and implemented over the recent years by the government have strengthened resilience of the economy, besides stepping up the growth momentum. Subdued external demand conditions operated as a drag. Labour market conditions normalised, and unorganised sector activity returned to expansion zone in 2022-23. The universal vaccination programme of the government - one of the largest mass vaccination drives in the world, involving more than two billion doses - helped in improving consumer and business confidence. II.3 PRICE SITUATION II.3.1 Inflation surged across advanced economies (AEs) and emerging market and developing economies (EMDEs) to multi-decadal highs in 2022, primarily driven by the soaring food and energy prices amidst renewed supply disruptions following the war in Ukraine, tighter labour market conditions in AEs, firming up of growth momentum from pandemic time lows and volatility of financial markets in EMDEs resulting from spillovers from the aggressive tightening of monetary policy by the US Fed. Globalisation of inflation, and the realisation that the price pressures are not transitory, led to synchronised tightening of monetary policy, with an emphasis on front-loading to ensure a soft landing. II.3.2 Global commodity prices soared during the first half of 2022, driven by lingering post-COVID supply constraints, which got exacerbated by the war in Ukraine leading to global shortages in key food, energy and other commodities. The World Bank energy price index increased by 54.4 per cent over December 2021 to reach a peak in June 2022, while food prices increased by 24.9 per cent to reach a peak in May 2022 and metals and minerals by 21 per cent to a peak in March 2022. Subsequently, however, commodity prices underwent sharp corrections with the energy price index falling by 40.4 per cent in March 2023 over June 2022 levels. Similarly, food prices declined by 15.3 per cent and metals and minerals by 23.3 per cent from their respective peaks. Notwithstanding notable decline in global commodity prices in the later part of 2022 and early 2023, heightened geopolitical uncertainty, financial market volatility, re-emergence of another COVID-19 wave in some countries and the associated supply chain disruptions sustained the price pressures, limiting the pace of disinflation despite significant tightening of monetary policy. II.3.3 In India, headline inflation7 remained above the upper tolerance level of the inflation target over the successive months during January-October 2022. After a short-lived moderation in November and December 2022, driven by seasonal easing in food prices, inflation increased again in January-February 2023 before moderating in March 2023. Inflation reached a peak in April 2022 at 7.8 per cent driven by a sharp increase in inflation in all the three major groups - food, fuel and core (i.e., excluding food and fuel) inflation - on continued supply disruptions, rise in global commodity prices and currency depreciation, the common adverse global shocks for EMDEs associated with the war in Ukraine (Chart II.3.1). Subsequently, normalisation of supply chain pressures, easing of input cost pressures led by decline in global commodity prices, proactive supply management measures by the government and judicious monetary policy actions by the Reserve Bank softened the price pressures, bringing inflation to below the upper tolerance level in November and December 2022, before it surged again in January-February 2023 due to larger than expected price build-up in cereals. Core inflation generally remained elevated and sticky during the year, reflecting gradual pass-through of input cost pressures to goods inflation and subtle uptick in services inflation. 
| Table II.3.1: CPI Headline Inflation – Key Summary Statistics | | (Per cent) | | Item | 2013-14 | 2014-15 | 2015-16 | 2016-17 | 2017-18 | 2018-19 | 2019-20 | 2020-21 | 2021-22 | 2022-23 | | 1 | 2 | 3 | 4 | 5 | 6 | 7 | 8 | 9 | 10 | 11 | | Mean | 9.4 | 5.8 | 4.9 | 4.5 | 3.6 | 3.4 | 4.8 | 6.2 | 5.5 | 6.7 | | Standard deviation | 1.3 | 1.5 | 0.7 | 1.0 | 1.2 | 1.1 | 1.8 | 1.1 | 0.9 | 0.7 | | Skewness | -0.2 | -0.1 | -0.9 | 0.2 | -0.2 | 0.1 | 0.5 | -0.7 | -0.1 | -0.1 | | Kurtosis | -0.5 | -1.0 | -0.1 | -1.6 | -1.0 | -1.5 | -1.4 | -0.7 | -1.0 | -0.6 | | Median | 9.5 | 5.5 | 5.0 | 4.3 | 3.4 | 3.5 | 4.3 | 6.5 | 5.6 | 6.7 | | Maximum | 11.5 | 7.9 | 5.7 | 6.1 | 5.2 | 4.9 | 7.6 | 7.6 | 7.0 | 7.8 | | Minimum | 7.3 | 3.3 | 3.7 | 3.2 | 1.5 | 2.0 | 3.0 | 4.1 | 4.2 | 5.7 | Note: Skewness and Kurtosis are unit-free. Annual inflation is the average of the monthly inflation rates during the year and therefore, may vary from the annual inflation calculated from the average index for the year.
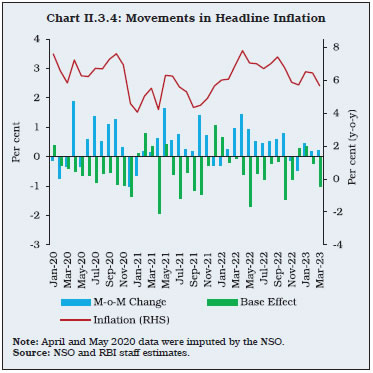
Source: NSO and RBI staff estimates. | II.3.4 Average inflation in 2022-23 increased sharply from its level in 2021-22, while volatility in inflation, as measured by the standard deviation of the consumer price index (CPI) inflation, was marginally lower than a year ago (Table II.3.1). Further, the intra-year distribution of inflation showed a negative skewness reflecting higher than the average inflation prints in many months. II.3.5 Against this backdrop, sub-section 2 assesses developments in global commodity prices and inflation. Sub-section 3 discusses movements in headline inflation in India including major turning points, followed by a detailed analysis of its primary constituents in sub-section 4. Other indicators of prices and costs are analysed in sub-section 5, followed by concluding observations. 2. Global Inflation Developments II.3.6 The spike in commodity prices in Q1:2022-23 was primarily led by energy, food and fertiliser, following the war in Ukraine and recovering global demand (Chart II.3.2). Global crude oil prices rose sharply in Q1:2022-23, reaching a peak of US$ 117 per barrel in June 2022. Notwithstanding the decision by the organisation of the petroleum exporting countries (OPEC) and their allies (OPEC+) to reduce their production target by 2 million barrels per day in October 2022, easing of supply constraints and synchronised tightening of monetary policy that posed the risk of a global recession led to a sharp correction in crude oil prices to US$ 76.5 per barrel in March 2023 (i.e., a correction of 34.5 per cent from the June 2022 peak). Natural gas prices peaked in August 2022 reflecting the conflict induced supply constraints faced by Europe but eased significantly by March 2023 in response to a milder winter and energy conservation measures in the European Union (EU). Metal prices witnessed sharp decline beginning 2022-23 as global growth slowed and demand moderated. While international food prices moderated from the May 2022 peak with easing supply conditions in edible oils and grains, they remained above the pre-conflict level due to decline in production on adverse weather conditions in major producing countries and trade restrictions. Moreover, higher natural gas and coal prices affected fertiliser production, pushing up their prices and consequently the input costs for food crops. Reflecting these global commodity price developments, consumer price inflation surged in both AEs and EMDEs, warranting synchronised monetary policy tightening during the year (Chart II.3.3). 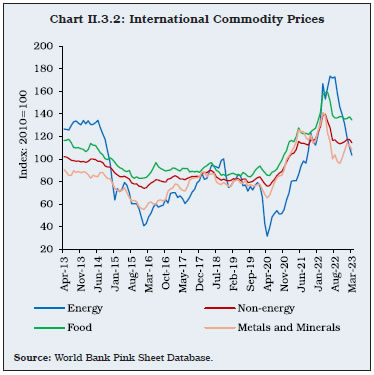 3. Inflation in India II.3.7 CPI headline inflation in India remained above the upper tolerance level of 6 per cent for 10 successive months since January 2022, before moderating during November-December on seasonal easing in food prices. Inflation picked up again in January-February 2023 before easing to 5.7 per cent in March 2023 (Chart II.3.4). The pick-up in headline inflation during the year was broad-based resulting from pass-through of higher global commodity prices (crude oil, metals and food prices) and adverse domestic weather conditions. After reaching a peak in April 2022 following the war in Ukraine, inflation eased with gradual improvement in global supply conditions, record domestic food production, targeted supply side measures undertaken by the government including excise duty cuts on petrol and diesel along with lower import duties and imposition of export restrictions on some inflation sensitive agricultural items. Cumulative tightening of policy repo rate by 250 basis points (bps) during May 2022-February 2023 also aided in containing price pressures in the second half of 2022-23 (Box II.3.1). 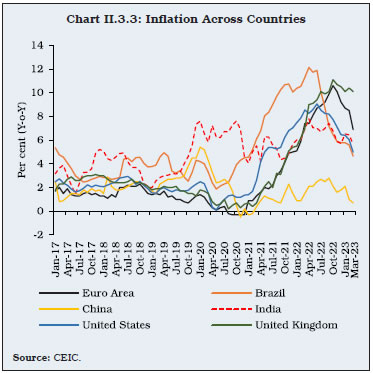
Box II.3.1
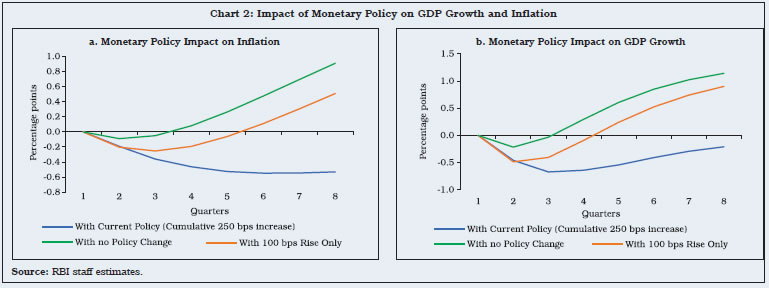
Monetary Policy and Disinflation To tame inflation and bring it within the tolerance band as the immediate priority, the Reserve Bank raised the policy repo rate cumulatively by 250 bps between May 2022 and February 2023 while shifting policy stance to withdrawal of accommodation. To assess the effectiveness of monetary tightening, a four variable VAR model is used with year-on-year (y-o-y) growth in real GDP, CPI (excluding food and fuel) inflation (y-o-y), gross fiscal deficit (GFD) of the central government as per cent of GDP and policy interest rate as the key variables. This is estimated for the period Q1:1998-99 to Q4:2021-22, controlling for the COVID-19 pandemic shock through a dummy variable. The impulse response results suggest a statistically significant response of growth and inflation to monetary policy shock (Chart 1). A one percentage point (pp) rise in the policy rate leads to a peak impact of 30 bps fall in GDP growth in the third quarter with the impact lasting up to the 8th quarter. The impact on inflation operates with a higher lag, with the peak impact of 22 bps materialising in the 5th quarter, and persisting for a longer time period, even beyond four years. Using the same VAR model, a policy response experiment is conducted to assess the importance of timely and front-loaded monetary policy actions, following Cho and Moreno (2006). The counterfactual exercise is undertaken with Q1:2022-23 as the starting point and assessing the impact up to eight quarters to account for monetary policy transmission lags under three scenarios: (a) no policy change or maintaining repo rate at 4 per cent for the whole period; (b) increase in policy repo rate by 100 bps only once in Q1:2022-23; and (c) a tightening of policy as under the current scenario, i.e., an increase in repo rate by 250 bps until February 2023. The simulation results from this exercise suggest that under the no policy change scenario, inflation would have remained above 6 per cent throughout, reaching a peak of 7.3 per cent by the end of 8th quarter (Chart 2). Under the second scenario, inflation would have been lower by about 25 bps as compared to the no policy change scenario. However, under the current tight monetary policy (scenario c), inflation is estimated to have eased by more than 50 bps as compared to a rise in inflation of about 90 bps under policy repo rate left unchanged at 4 per cent. The efforts to control inflation by maintaining current policy stance might have sacrificed growth by about 65 bps. The significance of front-loaded policy action is evident from the fact that inflation would have been higher by 90 bps without the cumulative increase in the repo rate by 250 bps, whereas with only one-off 100 bps increase in the repo rate, inflation would have been lower by only 25 bps. 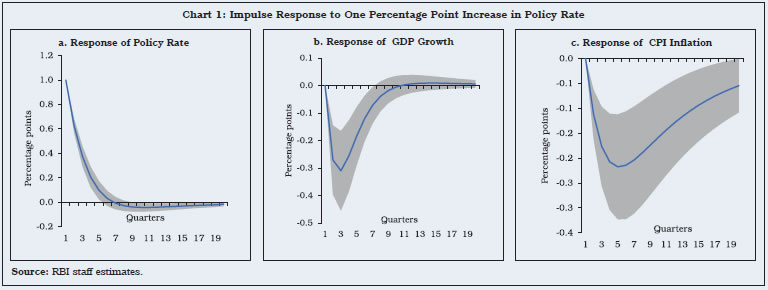
 Reference: Cho, S., and Moreno, A. (2006), ‘A Small-sample Study of the New-Keynesian Macro Model, ‘Journal of Money, Credit and Banking’, Vol. 38, Issue 6, 1461-1481. | II.3.8 Inflation in food and beverages was the primary source of headline inflation build up, with its contribution to headline inflation increasing to 46.4 per cent in 2022-23 from 35.9 per cent in the previous year. Higher global food prices, supply shortages and adverse domestic weather conditions led to the pick-up in food prices, driven by cereals, vegetables, milk and spices. II.3.9 Inflation in fuel and light averaged at 10.3 per cent in 2022-23, driven by a sharp pick-up in prices of kerosene and liquefied petroleum gas (LPG) which, in turn, reflected the impact of rise in global energy prices following the war in Ukraine. After remaining in deflation until October 2022, electricity prices recorded an inflation of 3.1 per cent in November 2022 due to unfavourable base effect and increase in tariffs in a few states. II.3.10 Inflation excluding food and fuel, or core inflation, remained persistently elevated at around 6 per cent during the year. The price pressures were broad-based, reflecting pass-through of input cost pressures and recovering domestic demand (Box II.3.2). A combination of factors - supply shocks, recovering demand, inflation expectations, exchange rate depreciation, fiscal stance - impacted the inflation trajectory (RBI, 2023)8. After a sharp pick-up in April 2022, however, price pressures moderated to some extent, aided by supply side measures by the government, including excise duty cuts in petrol and diesel effected on May 22, 2022. The main drivers of the ascent in core inflation were clothing and footwear, housing, transport and communication, health, household goods and services, and recreation and amusement. II.3.11 During 2022-23, headline inflation averaged 6.7 per cent, 115 bps higher than a year ago (Appendix Table 4). Box II.3.2
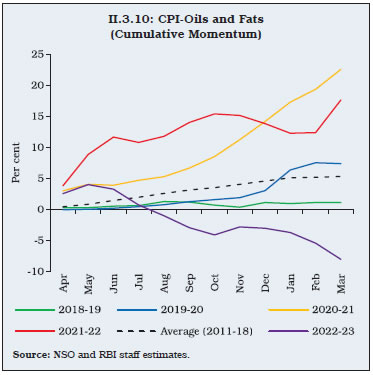
Recent Inflation Dynamics in India – Role of Supply vis-à-vis Demand Distinguishing between the role of demand and supply in driving inflation is critical to guide the conduct of monetary policy in managing the difficult growth-inflation trade-offs. As the persistence of supply shocks raise the risks of high inflation with suppressed economic growth (Shapiro, 2022a), it is imperative to understand the relative contribution of supply shocks driving inflation. In the literature, matching price and volume data from personal consumption expenditures (PCE) as in the case of the US (Shapiro, 2022a and 2022b) and quarterly national accounts data for household consumption expenditure (where matching price and volume data are not available) [OECD, 2022] have been used to distinguish between demand and supply shocks. This is done by identifying the direction of price and volume shocks for different items by running a bi-variate vector auto regressive (VAR) model on a rolling window and interpreting their residuals. Price and volume residuals with the same signs are assumed to reflect demand – higher demand pushes up both prices and volumes in the same direction and vice versa – while residuals with opposite signs correspond to supply shocks – lower supply means a reduction in volume with an increase in price. As matching prices and volume data are not available for the CPI items for India, the 23 CPI sub-groups data on prices are mapped to CMIE (Centre for Monitoring Indian Economy) CPHS (Consumer Pyramid Expenditure Survey) consumption expenditure data.9 Next, the CMIE CPHS expenditure categories are deflated by the corresponding CPIs to derive a proxy for volume. To get a homogeneous base, these 23 mapped CPI sub-groups and corresponding CMIE CPHS expenditure categories are rebased to January 2014=100 and then de-seasonalised. The sample period for the analysis is January 2014 to December 2022 based on CMIE CPHS data. In line with OECD, 2022, a two-equation VAR model for prices and quantities is run for a 5-year rolling window as follows: The one-period ahead forecasts of both price and quantity are generated for each of the 23 matched categories and compared with their actual values. These 23 sub-groups are categorised each month during January 2019-December 2022 into demand, supply and ambiguous10 components, after which the CPI weights of these sub-groups are used to calculate their contributions to CPI inflation. These contributions to CPI inflation are then aggregated into demand driven, supply driven and ambiguous components to quantify the extent of demand and supply driven inflation. The results show that vegetables, milk, pulses, oils and fat, sugar, egg, and meat and fish within the food group experience frequent supply-side pressures, while non-alcoholic beverages, health, household goods and services and recreation and amusement are mainly impacted by demand side factors. Overall, the average contributions of demand side factors to inflation, which was 35.2 per cent in 2019, dropped during the COVID-19 shock to 24.6 per cent in 2020, and then recovered gradually to 31.8 per cent in 2021 and 30.5 per cent in 2022. During excess rain induced supply shocks in October-November 2019 as well as during different phases of COVID-19, supply side factors became predominant. On an average, supply side factors contributed around 55 per cent to CPI headline inflation during the entire sample period (Chart 1). 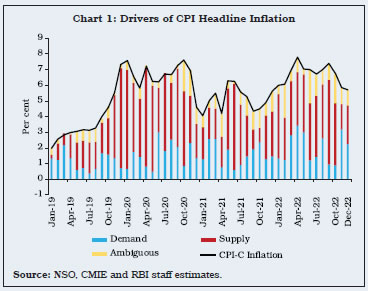 Post the war in Ukraine, besides the supply side factors, the role of demand side factors in driving inflation has also increased, reaching around 42.5 per cent during March-May 2022 and 54.2 per cent in November 2022 led by a pick-up in festive demand. This empirical finding supports timely introduction of monetary tightening phase in May 2022, and its continuation through the year with a cumulative increase in the policy repo rate by 250 basis points. Thus, sequencing of the Reserve Bank’s policy actions was appropriately timed to judiciously balance the growth-inflation trade-offs. References: 1. Shapiro, A. H. (2022a), ‘A Simple Framework to Monitor Inflation’, Federal Reserve Bank of San Francisco, Working Paper 2020-29. 2. Shapiro, A. H. (2022b), ‘How Much do Supply and Demand Drive Inflation?’, Federal Reserve Bank of San Francisco Economic Letter, 15. 3. OECD (2022), ‘Supply- and Demand-driven Inflation in OECD Economies’, Economic Outlook, Vol. 2022, Issue 2. | 4. Constituents of CPI Inflation II.3.12 During 2022-23, CPI headline inflation was primarily driven by food and beverages, followed by fuel and light, clothing and footwear, health and education and transport and communication (Chart II.3.5). Food II.3.13 Inflation in food and beverages (weight: 45.9 per cent in CPI) hovered in a wide range of 4.6 per cent to 8.4 per cent in 2022-23 reflecting a combination of shocks - conflict induced global food and fertiliser price surge, adverse impact of heat wave on domestic rabi crop production and elevated farm input cost pressures - and seasonal price behaviour. Increase in the prices of vegetables, animal proteins, and cereals and products were the key drivers of hardening food inflation in the first half, while easing of vegetables and oils and fats prices drove the moderation in inflation in the second half (Chart II.3.6). II.3.14 Food and beverages inflation averaged 6.7 per cent in 2022-23 as compared with 4.2 per cent in 2021-22. Within the food group, inflation increased in five sub-groups while it moderated for the remaining seven sub-groups (Chart II.3.7). Prices of cereals, vegetables, milk, prepared meals, snacks, sweets, etc. and spices witnessed higher inflationary pressures during a major part of the year, driving up overall food inflation. II.3.15 Early onset of summer, heat waves and excess rains pushed up vegetable prices (weight: 13.2 per cent in CPI-Food and beverages) in H1:2022-23 which ebbed with fresh crop arrivals in November 2022 (Chart II.3.8a and II.3.8b). As a result, after rising till October 2022, the cumulative momentum of vegetable prices moderated sharply in November and turned negative since December 2022, recording an average inflation of 3.0 per cent during the year 2022-23. 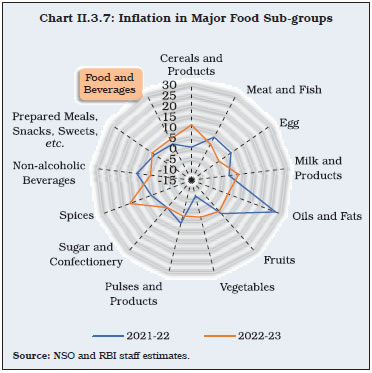 II.3.16 Onion prices moderated during April-May 2022 on account of robust rabi harvest [an increase of 17.4 per cent in 2021-22 as per the 3rd advance estimates (AE) over 2020-21 final estimates (FE)] and record procurement of 2.5 lakh tonne by the Centre for price stabilisation buffer for 2022-23 (higher by 0.5 lakh tonne compared to 2021-22). Price pressures, however, emerged in the subsequent months (barring September 2022) until November 2022 due to seasonal uptick in demand and loss of kharif output on account of both deficit and excess rainfall in key kharif onion-producing states. Tomato prices exhibited significant volatility in 2022-23 with a sharp summer pick-up during April-June 2022 followed by significant corrections in the next two months and another spell of increase during September-October 2022 owing to vagaries of monsoon. The volatility in the prices was driven by extreme weather events, including heat waves in north India, uneven distribution of monsoon throughout the country and excess rainfall in major producing states of Maharashtra, Andhra Pradesh and Karnataka which led to crop damage and delayed arrivals in the market. Decline in production [(-) 4.0 per cent in 2021-22 3rd AE over 2020-21 FE] also tightened supply in the early part of 2022. Potato prices increased during April-October 2022 (barring September) on account of lower production [(-) 5.0 per cent in 2021-22 3rd AE over 2020-21 FE], reflecting the impact of unseasonal rains during November-December 2021 and delay in arrivals of fresh crops. The government allowed free import of potato from Bhutan in July 2022 without any licence till June 30, 2023 to restrain positive price pressures. As cold storages released fresh stocks in the market, prices corrected from November 2022 onwards. 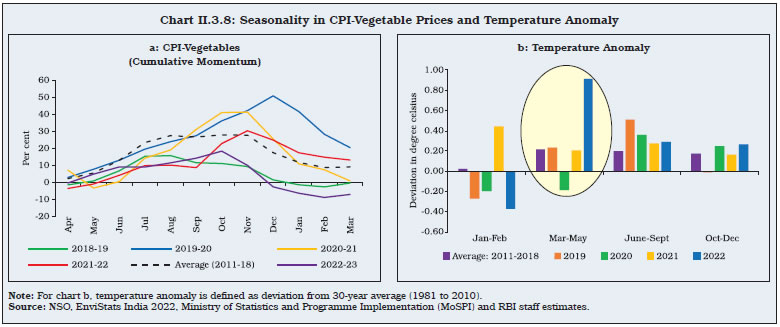 II.3.17 Prices of cereals and products (weight of 21.1 per cent in the CPI-Food and beverages) recorded steady growth in 2022-23, primarily driven by increase in rice and wheat prices. Wheat prices firmed up as domestic production declined in 2021-22 [(-) 1.7 per cent as per 2021-22 FE over 2020-21 FE] due to heat waves in major wheat producing states of Punjab and Haryana and decline in stock levels to below the buffer norms intermittently since August 2022. Price pressures were amplified by higher international prices due to global supply shortages which led to higher volume of exports (11.8 per cent year on year during April-November 2022), leading to reduction in domestic supply of wheat. The sharp increase in domestic prices led the government to impose restrictions on wheat exports since May 2022 and later additional curbs on exports of wheat products since August 2022 even as exports under the government-to-government channel continued. Price pressures in rice reflected substitution of wheat distribution under the Pradhan Mantri Garib Kalyan Anna Yojana (PMGKAY) by rice along with a rise in volume of exports (by 5.2 per cent, y-o-y, in 2022-23) and decline in estimated kharif production [(-) 0.9 per cent in 2022-23 3rd AE over 2021-22 FE]. Supply-side measures by the government - imposition of 20 per cent export duty on non-basmati rice and prohibition of export of broken rice in September 2022 along with robust buffer stocks (which stood at 3.2 times the norm as on April 1, 2023) helped in keeping the price increase range bound. II.3.18 In the case of animal protein-rich items such as eggs, meat and fish (weight of 8.8 per cent in CPI-Food and beverages), price pressures were seen in meat and fish in Q1:2022-23 due to increase in feed and transportation costs (Chart II.3.9 a). Price pressures moderated subsequently due to a fall in seasonal demand on account of Sravana month and approval of an additional import of 0.55 million tonne of genetically modified soybean meal by the government in May 2022. However, price pressures re-emerged in September-October, before moderating thereafter. Egg prices remained volatile and were driven by rising feed costs as well. In the case of milk and products, prices increased throughout the year as major milk co-operatives, viz., Amul and Mother Dairy revised their retail prices upward by ₹2 per litre multiple times during the year citing rising feed cost pressures (Chart II.3.9 b). II.3.19 Price pressures in oils and fats (weight of 7.8 per cent in CPI-Food and beverages) eased gradually since June 2022 as global prices of edible oils, particularly palm oil, declined sharply (Chart II.3.10). Edible oil prices increased sharply during March-May 2022 on account of a rise in global prices as the Ukraine conflict and imposition of export ban on crude palm oil by Indonesia in April 2022 severely impacted the supply of edible oils in the global market. Moreover, depreciation of the Indian Rupee on the back of high dependence on imports of edible oils also added to the rising domestic prices. The price momentum eased gradually with the softening of global prices, lifting of export ban and removal of export levy till October 31, 2022 by Indonesia. The government also undertook several supply-side measures which included extending zero per cent basic customs duty (BCD) on crude palm oil, sunflower and soybean oil till March 2024, reduction in BCD on refined soybean, and sunflower and palm oil to 17.5 per cent and 12.5 per cent (from 32.5 per cent and 17.5 per cent), respectively, and reduction of import duty on refined palm oil to zero till March 2024. In addition to these, the government also imposed stock limits on edible oils and oilseeds till December 31, 2022 and exempted BCD and agricultural infrastructural development cess (AIDC) on allocated Tariff Rate Quota (TRQ) for import of 20 lakh metric tonne of crude soybean oil and sunflower oil for 2022-23. These measures together led to a steady decline in the prices of edible oils. 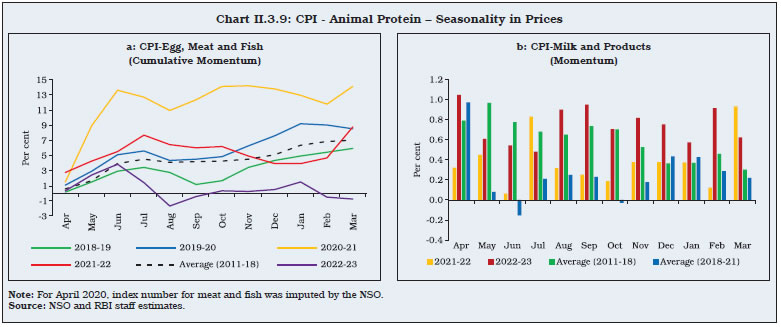
 II.3.20 Inflation in prices of pulses (weight of 5.2 per cent in CPI-Food and beverages) remained muted in 2022-23 on account of extension of imports of tur and urad under ‘free category’ till March 31, 2024, extension of zero AIDC on imports of lentils till March 2024 and higher overall production in 2021-22 (Chart II.3.11). But prices increased since August 2022 on account of a decline in estimated kharif production of both tur and urad by 18.7 per cent and 3.2 per cent, respectively, as per 3rd AE of 2022-23 over 2021-22 FE. Recent measures to boost food security, including raising government limit for procurement of tur, urad and masur from farmers to 40 per cent from 25 per cent and robust sowing of rabi crop contained price pressures since October. II.3.21 Inflation in fruits (weight of 6.3 per cent in CPI-Food and beverages) remained largely range bound during the year, primarily driven by movements in seasonal fruits prices. Spike in mango prices due to crop damage caused by heat waves and unseasonal rains led to sharp increase in price pressures in April 2022 which tapered off gradually with the increase in arrivals. Inflation in banana, papaya and other fresh fruits, however, remained elevated, driving up fruits inflation during February-March 2023. II.3.22 Among other food items, spices witnessed double digit inflation throughout the year 2022-23 averaging 16.2 per cent due to overall decline in domestic production [(-) 2.7 per cent as per 3rd AE of 2021-22 over FE 2020-21] in key spices particularly dry chillies, cumin and coriander. Fuel II.3.23 The contribution of the fuel group (weight of 6.8 per cent in CPI) to headline inflation decreased to 10.5 per cent in 2022-23 from 13.1 per cent in the previous year. Fuel inflation remained in double digit for a major part of the year driven by hardening of domestic LPG and kerosene prices in line with sharp increase in international prices (Chart II.3.12 and Chart II.3.13). Nevertheless, inflation moderated from its intra-year peak of 11.8 per cent in July 2022 as global crude oil prices moderated and price increases in LPG and electricity broadly remained muted.
Inflation Excluding Food and Fuel II.3.24 Inflation excluding the volatile food and fuel items, i.e., core inflation, picked up to an average of 6.1 per cent in 2022-23 - a marginal increase from 2021-22, with a peak of 7.1 per cent in April 2022 (Chart II.3.14) [Appendix Table 4]. Core inflation remained sticky at around 6 per cent since May 2022 despite the excise duty cuts on petrol and diesel in May 2022, followed by a reduction in value added tax (VAT) by many state governments, with broad-based pressures observed across goods and services. II.3.25 Among the major constituents, inflation in transport and communication moderated gradually after the sharp spike in Q1:2022-23, reflecting increase in domestic prices of petrol and diesel in line with international prices (Chart II.3.15). Within transport and communication, prices of personal transport vehicles (viz., motor car, motor cycle and bicycle) increased, reflecting gradual pass-through of input costs pressures alongside a recovery in demand, while transport fares also increased with revisions in bus and taxi fares following the rise in the prices of petrol and diesel. Inflation in the health sub-group remained subdued as compared with the last year as the pandemic induced demand gradually eased with reduction in COVID-19 cases and normalisation of medical supplies. Broad-based increase in core prices was observed on account of pass-through of input costs to retail prices as more than 70 per cent of items registered higher than 4 per cent inflation rates during 2022-23 (Chart II.3.16). 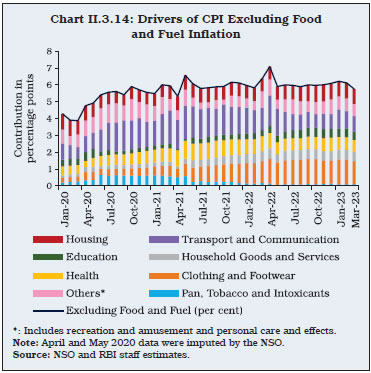
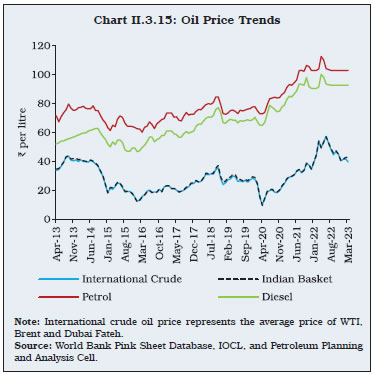 II.3.26 Housing inflation remained muted, averaging at 4.3 per cent in 2022-23, reflecting subdued rental demand on account of hybrid work culture. Net of housing, inflation excluding food and fuel averaged at 6.6 per cent in 2022-23, the same level as observed a year ago. II.3.27 Inflation in clothing and footwear remained a major pressure point, averaging 9.5 per cent in 2022-23. The spike in inflation largely reflected lagged pass-through of input cost pressures emanating from rising international prices of cotton (as measured by the Cotton A Index) and lower domestic cotton arrivals on falling crop yield in major cotton producing states on account of weather disruptions and pest attacks. 5. Other Indicators of Inflation II.3.28 From a sectoral perspective, inflation measured by the CPI for industrial workers (CPI-IW), remained elevated averaging at 6.1 per cent in 2022-23, largely due to the increase in food and fuel prices. Inflation based on the CPI for agricultural labourers (CPI-AL) and rural labourers (CPI-RL) averaged even higher at 6.8 per cent and 7.0 per cent, respectively, during 2022-23, driven by elevated inflation in food, fuel and clothing. II.3.29 Inflation measured by the wholesale price index (WPI) rose sharply in H1: 2022-23, reaching a peak of 16.6 per cent in May 2022. The increase mirrored global trend of rising crude oil and other commodity prices following the war in Ukraine. Softening of global commodity prices, particularly in energy, food and metals in the latter half of the year led to consistent moderation in WPI inflation from its May 2022 peak to 1.3 per cent in March 2023, falling below the CPI headline inflation. The sharp moderation in October-March 2022-23 was driven by easing of price pressures in all three major groups – primary articles (weight of 22.6 per cent in WPI basket), fuel and power (weight of 13.2 per cent) and manufactured products (weight of 64.2 per cent). Although WPI and CPI inflation diverge sporadically reflecting differences in the composition of the basket as well as weighting pattern, they exhibit a long-run relationship11. Within WPI primary articles, food inflation eased significantly during November-December 2022 primarily driven by sharp seasonal easing in prices of fruits and vegetables. However, spices emerged as a new pressure point and witnessed double digit inflation throughout the year. Notwithstanding a persistently high inflation recorded by fuel and power in 2022-23, there was a gradual moderation from its June 2022 level, in line with the easing of global fuel and energy prices. With the broad-based increase in input cost pressures from higher global commodity prices, manufactured products inflation ruled in double-digits during April-May 2022, largely driven by non-food manufactured products inflation. Subsequently, however, there was a gradual easing of inflation in line with moderating cost pressures. Reflecting the sharp rise in WPI inflation and elevated CPI inflation, the gross domestic product (GDP) deflator inflation hardened to 11.6 per cent in H1: 2022-23 from 8.6 per cent in H1: 2021-22. As WPI inflation eased since October 2022, GDP deflator inflation moderated to 6.6 per cent in Q3: 2022-23 from 10.3 per cent in Q2: 2022-23. Overall for 2022-23, GDP deflator inflation moderated to 8.3 per cent from 8.5 per cent a year ago. II.3.30 There was a significant hike in minimum support prices (MSPs) for kharif and rabi crops in 2022-23, a range of 4.4-8.9 per cent for kharif crops and 2.0-9.1 per cent for rabi crops. Soybean (yellow) witnessed the maximum MSP increase among the kharif crops, while the increase was the highest for lentil (masur) among the rabi crops. II.3.31 Wage growth for agricultural and non-agricultural labourers remained subdued during 2022-23, averaging 5.8 per cent and 4.9 per cent, respectively. Nevertheless, there was an increase in the pace of wage growth for agricultural and non-agricultural labourers, reaching an intra-year peak of 7.7 per cent in January 2023 and 5.6 per cent in November 2022, respectively, before moderating in March 2023. 6. Conclusion II.3.32 Common shocks emanating from the war in Ukraine – high food, energy, and other commodity prices – and the globalisation of inflation to multi-decadal high levels exerted sustained upside price pressures in India, leading to inflation remaining above the upper tolerance level of 6 per cent over 10 consecutive months (January-October 2022). Inflation eased somewhat during November-December 2022 on seasonal easing in food prices, before rising again during January-February 2023 and moderating to 5.7 per cent in March 2023. Monetary tightening by major economies and associated volatility in financial markets led to imported inflation pressures. Input cost pressures from high industrial raw materials prices, transportation costs, and global logistics and supply chain bottlenecks impinged on core inflation. The upward pressures from an early onset of summer, heat waves and unseasonal rains on food prices in the first half receded in the second half of the year with the robust kharif harvest and seasonal fresh crop arrivals as well as some easing in global food prices. The proactive supply side interventions by the government also helped contain price pressures. Timely beginning of the monetary policy tightening cycle with a cumulative increase in the policy repo rate by 250 bps since May 2022 helped ease demand pressures, anchor inflation expectations and contain the second-round impact of successive supply shocks. But for the timely monetary actions, inflation is estimated to have been higher by 90 bps. Geopolitical dynamics and possible weather disturbances overcast the outlook for inflation in India. II.4 MONEY AND CREDIT II.4.1 Monetary and credit conditions evolved in sync with the monetary policy stance and the changing state of the economy during the course of the year. Reserve money (RM), adjusted for the first-round effects of the increase in cash reserve ratio (CRR)12, expanded at a marginally higher pace as compared with the previous year.Money supply (M3) growth during the year broadly remained in sync with its largest component - aggregate deposits - partly in response to higher deposit rates following the cumulative increase in policy repo rate by 250 basis points (bps) and gradual withdrawal of surplus liquidity, details of which are set out in Chapter III. Deposit growth, however, did not keep pace with the robust growth in credit with banks taking recourse to the certificates of deposits (CDs) market for funding asset expansion. The growth in currency with the public (CwP) moderated during the year, falling below the growth of aggregate deposits for the first time since 2013-14, partly in response to the rising opportunity cost of holding currency in an environment characterised by increasing deposit rates as also the growing adoption of different modes of payment for effecting transactions. Reflecting return of consumer optimism and improvement in business sentiments, the velocity of money, which had dipped, regained the pre-pandemic level, in line with a broadly stable trend over the past decade. II.4.2 Against this backdrop, sub-section 2 delves into the dynamics underlying movements in RM and, thereby, the shifts in the Reserve Bank’s balance sheet. Sub-section 3 examines developments in money supply in terms of its components and sources, throwing light on the movements in assets and liabilities of the banking sector. The underpinnings of bank credit are covered in sub-section 4, followed by concluding observations. 2. Reserve Money13 II.4.3 Reserve money (RM) depicts the stock of monetary liabilities in the central bank’s balance sheet. As on March 24, 2023, RM constituted more than 68 per cent of the Reserve Bank’s balance sheet size (Chart II.4.1). The remaining14 part largely consists of risk buffers and revaluation accounts [forming bulk of the net non-monetary liabilities (NNML)], which are maintained by the Reserve Bank as the country’s savings for a potential use in a ‘rainy day’,15 as well as liquidity surplus deposited by the banking sector under reverse repos/standing deposit facility (SDF) with the Reserve Bank. 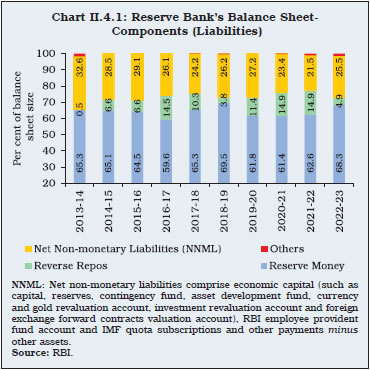 II.4.4 In order to alleviate COVID-19 related stress in the financial markets and specific segments of the economy, the Reserve Bank had used a number of targeted and system-level liquidity measures as part of unconventional monetary policies, which led to stable expansion in its balance sheet size. As a per cent of GDP, the Reserve Bank’s balance sheet size expanded to 28.6 per cent in 2020-21 from 24.6 per cent in 2019-20, before moderating to 26.7 per cent in 2021-22 and further to 22.5 per cent in 2022-23 (Chart II.4.2a). The expansion in the Reserve Bank’s balance sheet was, however, relatively subdued as compared with that in the US, the UK and the Euro Area. During the same period, the reserve money as per cent of GDP in India also remained stable vis-à-vis other major economies as the liquidity measures were carefully designed and targeted with in-built terminal dates, reducing the challenge of exiting from post-COVID unconventional policies (Chart II.4.2b). 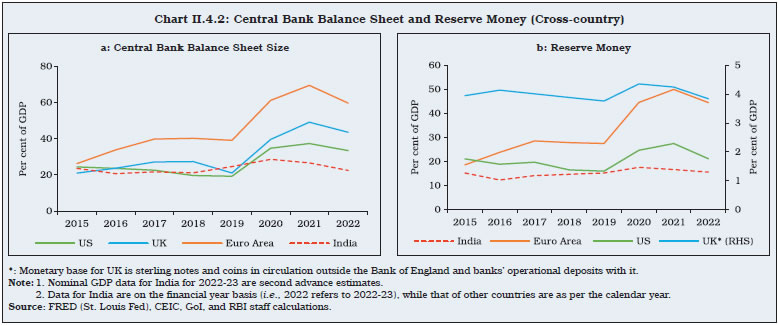 II.4.5 On the component side (liabilities), RM comprises currency in circulation, bankers’ deposits with the Reserve Bank, and other deposits with the Reserve Bank. During 2022-23, the growth in RM decelerated to 10.0 per cent from 12.3 per cent a year ago, as well as from its decennial average of 11.5 per cent (2013-22) which indicates that excessive base money growth was not a causative factor behind the higher average inflation experienced during 2022-23. Adjusted for the first-round impact of change in CRR, RM expanded by 7.5 per cent in 2022-23 as compared to 7.3 per cent a year ago, reflecting gradual and calibrated withdrawal of COVID-19 induced surplus liquidity over the span of two years16 (Chart II.4.3 and Appendix Table 4). 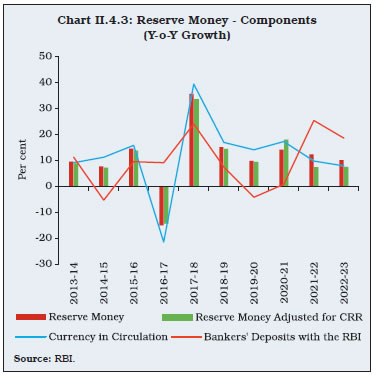 II.4.6 Among the components of RM, currency in circulation (CiC) - the major constituent (share: 78.4 per cent) - increased by 7.8 per cent during 2022-23, at a lower pace than the growth in RM. Amidst moderation in CiC-GDP ratio, the digital payments in India increased significantly in the post-pandemic period with faster digital onboarding of new users, facilitated by digitalisation, through various initiatives of the Reserve Bank such as operationalisation of the Payments Infrastructure Development Fund (PIDF) and launch of Central Bank Digital Currency (CBDC) during the year, details of which are covered in Chapters VI, VIII and IX of this Report (Chart II.4.4). 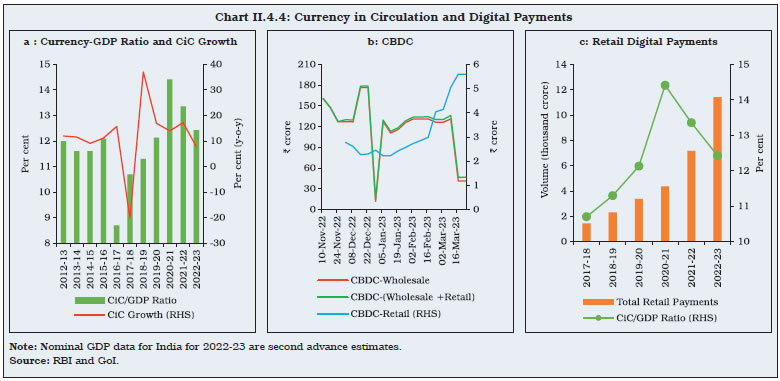 II.4.7 Even though the currency-GDP ratio in India is moderating, it remains relatively at elevated levels vis-à-vis other major economies, widely referred to as currency demand paradox, particularly in the context of the exponential growth achieved in digital payments as a substitute of cash for effecting transactions (Chart II.4.5). Since cash and digital modes are generally expected to substitute each other, the simultaneous rise in both seems counterintuitive (Box II.4.1). II.4.8 The demand for CiC normally follows a predictable intra-month pattern - expansion during the first fortnight due to transactions by households, followed by a contraction in the second fortnight on account of flow back of currency from households to the banking system. It also exhibits a quarterly pattern driven by a seasonal spurt in Q1 associated with rabi procurement and kharif sowing, followed by a contraction in CiC in Q2 due to seasonal slack in economic activity in cash-intensive sectors such as construction and agriculture. CiC expands in Q3, reflecting increased demand for currency for festivals and kharif harvest. Expansion in CiC in Q4 tracks the harvest of rabi crops, various festivals and the wedding season. During 2022-23, variations in CiC during Q3 and Q4 were also influenced by assembly elections in six states (Chart II.4.6). 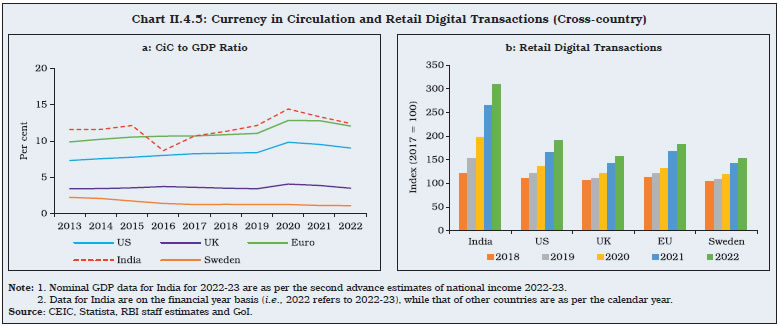
Box II.4.1
The Currency Demand Paradox in India Given the perceived substitutability between currency and digital payment modes for effecting transactions, their parallel growth in a country appears counterintuitive, giving rise to a currency paradox (Bailey, 2009). Further, COVID-19 has intensified this paradox as the rising uncertainties increased cash demand, despite accelerated migration to digital modes of payments (Ardizzi et al., 2020). In India, while the Unified Payments Interface (UPI)-led retail digital payments grew at a compounded annual growth rate (CAGR) of 50 per cent and 27 per cent in terms of volume and value, respectively (during 2016-17 to 2021-22), the currency in circulation (CiC) to GDP ratio also rose and peaked at 14.4 per cent in 2020-21. This phenomenon is, however, not new, or unique to India and has been observed since 2007 for several nations. The persistent affinity for cash has been attributed to factors such as the decline in opportunity costs of holding currency, i.e., interest rates, precautionary holdings amid uncertainty, presence of a large informal economy and direct benefit transfers (DBTs) by the government, promoting both cash and digital modes, as routing of benefits digitally tends to be followed by cash withdrawals. The increase in currency demand during COVID-19 in India was primarily for precautionary motive as the strong growth in CiC was driven by the demand for high denomination notes that witnessed a jump in its share to 90 per cent of total CiC in 2021-22 from the average of 82 per cent during 2010-16. In addition, there was a decline in the share of low denomination notes, partly due to the substitution of small-value payments by the UPI and mobile wallets, corroborated by their narrowing ticket sizes. Lower transactional cash demand was also evident from the sharper decline in the number of cash withdrawals at ATMs than in the withdrawal values, leading to increased withdrawal sizes. Given these factors, the trends in CiC-GDP ratio alone may not be adequate to assess the efficacy of the ongoing digital transformation. Illustratively, a counterfactual assessment shows that the CiC-GDP ratio would have been 12 per cent in 2020-21 and 11.9 per cent in 2021-22 relative to the actual ratio of 14.4 per cent and 13.4 per cent, respectively, had it not been for the pandemic-induced fall in the base (GDP) and uncertainty-driven surge in currency levels.17 Empirical analysis of the long-run currency demand function using autoregressive distributed lag (ARDL) models covering the sample period from Q2:2009 to Q2:2022 provides some interesting perspectives. Data used for the analysis are sourced from Baker et. al., (2016) for economic uncertainty and the Reserve Bank for other variables. All variables employed for empirical analysis, except interest rates, have been converted to natural logarithm with seasonal adjustment for relevant variables. Appropriate dummies were added to control for demonetisation (Q4: 2016, Q1:2017) and the first COVID-induced nationwide lockdown (Q2:2020). As per the Augmented Dickey-Fuller (ADF) test, all variables are stationary at levels or first differences. The baseline model indicates that nominal income (LYN) is the dominant driver of cash demand (LCIC) [positive relationship], while short-term interest rates, proxied by deposits rates of major banks (INT), have a negative association with currency usage (Table 1). Further, access to digital modes, proxied by digital payments value (LDIGVAL), tends to dampen currency usage (models 2 and 3). The substitution effect, albeit significant, is lower than the income effect, suggesting that digital transactions can offset the impact of income on currency demand to lower the currency-to-deposit ratio over time. The precautionary effect on currency usage captured through the economic policy uncertainty index (LEPU) [positive] indicates a preference for cash during uncertain periods. The assessment shows that the sudden uptick in CiC growth during COVID-19 can be attributed to the precautionary and store-of-value motives even as the transactional use of cash has progressively been substituted by digital modes. Recent data suggests a turnaround in the pandemic-induced precautionary demand for cash. For the week ending March 24, 2023, the CiC grew by 7.8 per cent (y-o-y), i.e., recording single-digit growth for 86 weeks since August 2021 (barring April 2022) and averaging overall at 8.5 per cent. Concurrently, digital payment modes continue to maintain strong growth momentum post-COVID. Table 1: Long Run Coefficients of Currency Modelling Regression
[Dependent Variable: LCIC (Natural Log of Currency in Circulation)] | | | Model 1
(Baseline) | Model 2 | Model 3 | | 1 | 2 | 3 | 4 | | Model Type | ARDL
(3,1,0) | ARDL
(3,3,0,2) | ARDL
(3,2,0,2,1) | | Nominal Income (LYN) | 0.88***
(0.04) | 1.19***
(0.20) | 1.26***
(0.18) | | Interest Rate (INT) | -0.06***
(0.01) | -0.07***
(0.01) | -0.07***
(0.01) | | Digital Payments Value (LDIGVAL) | | -0.30**
(0.16) | -0.32**
(0.15) | | Economic Policy Uncertainty (LEPU) | | | 0.06*
(0.00) | | Intercept | 1.53**
(0.81) | 1.96**
(0.84) | 0.83
(0.80) | | Error Correction | -0.24***
(0.01) | -0.24***
(0.01) | -0.27***
(0.01) | | Bounds Test: F statistic | 48.52 | 33.89 | 33.73 | | Model Tests | | | | | Adjusted R-squared | 0.99 | 0.99 | 0.99 | | Akaike Information Criterion (AIC) | -4.81 | -5.06 | -5.08 | | Schwartz Information Criterion (SIC) | -4.46 | -4.52 | -4.50 | | Durbin-Watson Stat. | 2.18 | 1.84 | 2.04 | *** : Significant at 1 per cent level. ** : Significant at 5 per cent level.
* : Significant at 10 per cent level.
Note: Figures in parentheses denote standard errors.
Source: RBI staff estimates. | References: 1. Ardizzi, G., A. Nobili and G. Rocco (2020), ‘A Game Changer in Payment Habits: Evidence from Daily Data During a Pandemic’, Bank of Italy, Occasional Paper No. 591. 2. Bailey, A. (2009), ‘Banknotes in Circulation-Still Rising. What Does this Mean for the Future of Cash?’, Speech at The Banknote Conference, Washington DC, Vol. 6. 3. Baker, S. R., Bloom, N., and Davis, S. J. (2016), ‘Measuring Economic Policy Uncertainty’, The Quarterly Journal of Economics, 131(4), 1593-1636. | II.4.9 Another component of RM, bankers’ deposits with the Reserve Bank (share: 20.1 per cent) increased by 18.5 per cent in 2022-23 as compared with 25.3 per cent during the same period in the previous year, as CRR was raised by 50 bps during the year as against 100 bps hike in the previous year (Chart II.4.3). II.4.10 On the sources side (assets), RM comprises net domestic assets (NDA) and net foreign assets (NFA) of the Reserve Bank. NDA comprises of net Reserve Bank credit to banks, government and commercial sector (mainly primary dealers), while the constituents of NFA are gold and foreign currency assets18 (FCA). During 2022-23, the expansion in RM was driven mainly by NFA, contributing to around 67 per cent, which in turn tracked variations in foreign currency assets; while NDA’s contribution reflects Reserve Bank’s net claims on banks and commercial sector arising from the liquidity management operations.19 Adjusted for valuation, NFA, however, recorded a decline during the year (Chart II.4.7).
3. Money Supply20 II.4.11 Finance is an important enabler of economic development and the supply of money matching the demand becomes crucial for greasing the wheels of the economy, wherein reserve money forms the monetary funding base over which deposits get multiplied through the banking channel, supporting the credit creation process. Money supply, commonly proxied by broad money (M3), largely consists of currency with the public (CwP) and aggregate deposits (AD) on the components side (liabilities). Money supply viewed in the context of economic activity - M3 to nominal GDP ratio - indicates that India witnessed a faster normalisation of COVID-19 induced stimulus, with the ratio reverting to the pre-pandemic steady levels unlike other major economies (Chart II.4.8). II.4.12 The muted expansion of money supply prior to the pandemic, characterised by its prolonged deceleration during 2010-2017 led by its major constituent - aggregate deposits - provided space for undertaking adequate pandemic-induced stimulus without posing the risk of high money supply growth (Chart II.4.9).
II.4.13 During the year, growth in deposits outpaced that of currency with the public (CwP) in a break from trend since 2013-14 (excluding demonetisation year 2016-17). During the year, broad money recorded a growth of 9.0 per cent as on March 24, 2023 (8.7 per cent a year ago) driven mainly by time deposits,21 partly supported by the rise in deposit interest rates in response to a cumulative 250 bps increase in the policy rate, in line with the stance of withdrawal of accommodation (Chart II.4.10). II.4.14 On the sources side (assets), bank credit to the commercial sector, followed by net bank credit to the government led the expansion in M3 in 2022-23. The former – the largest constituent of M3 – grew at a faster pace of 14.4 per cent during 2022-23 as compared with 9.0 per cent in the previous year, reflecting active usage of funds for credit creation. The net bank credit to government increased by 11.5 per cent in 2022-23 (8.2 per cent a year ago) amidst higher investments in government securities22 by banks, seeking the benefit of increase in limit for holding securities (including SLR securities) under held to maturity (HTM) category from 22.0 per cent to 23.0 per cent23 of NDTL, effective April 8, 2022; and also in view of moderation in credit offtake from the peak of 17.8 per cent recorded in October 2022. The net foreign assets of the banking sector declined during the year, mirroring the behaviour of commercial banks amidst global spillovers and the associated volatility in the forex market (Chart II.4.11 and Table II.4.1). 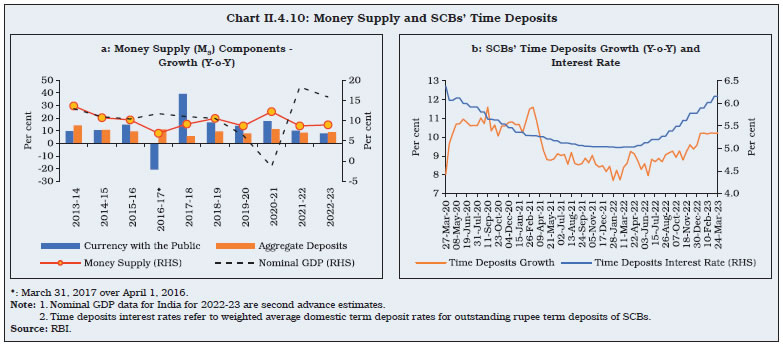 Key Monetary Ratios II.4.15 The behaviour of velocity of money and money multiplier often reflects the response of economic agents to shocks as also the impact of policy changes. In India, the transaction velocity of money, i.e., nominal GDP divided by broad money, was broadly stable since 2010-11, barring the pandemic year 2020-21 when it declined, but has recovered and regained its pre-pandemic level in 2022-23. On the other hand, money multiplier (MM), which peaked in 2012-13 at 5.5, broadly stabilised thereafter, and stood at 5.2 as on March 24, 2023, below its decennial average24 of 5.5 (2012-22), partly on account of the rising role of non-banks in meeting the credit requirements of the economy. Adjusted for reverse repo - analytically akin to banks’ deposits with the central bank - the money multiplier turned out to be marginally lower at 5.1 as on March 24, 2023, indicating convergence of MM and adjusted MM amidst improvement in credit demand conditions, leading to a sharp decline in the amount parked under reverse repo/SDF by banks (Chart II.4.12). 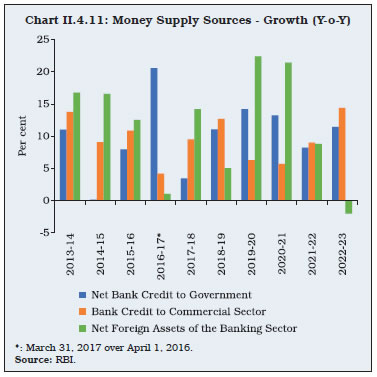
| Table II.4.1: Monetary Aggregates | | Item | Outstanding as on March 24, 2023
(₹ crore) | Year-on-Year Growth Rate (Per cent) | | 2020-21 | 2021-22 | 2022-23 (as on March 24, 2023) | | 1 | 2 | 3 | 4 | 5 | | I. Reserve Money (RM) | 43,13,542 | 14.2 | 12.3 | 10.0 | | II. Money Supply (M3) | 2,23,33,227 | 12.3 | 8.7 | 9.0 | | III. Major Components of M3 | | | | | | III.1. Currency with the Public | 32,78,334 | 17.7 | 10.2 | 7.9 | | III.2. Aggregate Deposits | 1,89,89,563 | 11.3 | 8.4 | 9.1 | | IV. Major Sources of M3 | | | | | | IV.1. Net Bank Credit to Government | 69,16,058 | 13.2 | 8.2 | 11.5 | | IV.2. Bank Credit to Commercial Sector | 1,44,23,483 | 5.7 | 9.0 | 14.4 | | IV.3. Net Foreign Assets of the Banking Sector | 4,86,22,73 | 21.4 | 8.8 | -2.0 | | V. M3 Net of FCNR(B) | 2,21,79,106 | 12.6 | 8.9 | 8.9 | | VI. Money Multiplier* | 5.2 | 4.8 | 3.8 | 4.7 | *: In columns 3, 4 and 5, data indicate incremental money multiplier.
Note: Data are provisional.
Source: RBI. | II.4.16 Of the two behavioural ratios driving MM, the reserve-deposit ratio25 was more or less stable during the past decade (2013-2023) broadly tracking the CRR, while the currency-deposit ratio depicted a broad rising trend, reflecting higher precautionary household savings in the form of currency, which in turn lowered the money multiplier. During 2022-23, in a break from the recent past, the currency-deposit ratio moderated and stood at 17.3 per cent, though it was still above its decennial average (2013-22) of 16.0 per cent (Chart II.4.13), reflecting the tightening cycle of interest rates since May 2022, apart from a shift away from precautionary ‘dash for cash’ by economic agents following the normalisation of the economy post-COVID.
4. Credit II.4.17 The 5-year seasonally adjusted annualised growth in deposits and credit closely tracked each other from July 2011, which coincided with the improved access to foreign capital flows (foreign portfolio investments and external commercial borrowings) on the back of favourable growth differential of India relative to the advanced economies (AEs) and the emerging market economies (EMEs). In the wake of the pandemic, however, a divergence in the rate of growth of credit and deposits reappeared, with deposit growth outpacing credit growth since February 2020. Even though the gap narrowed by November 2021, the wedge continued (Chart II.4.14 and Chart II.4.15a). 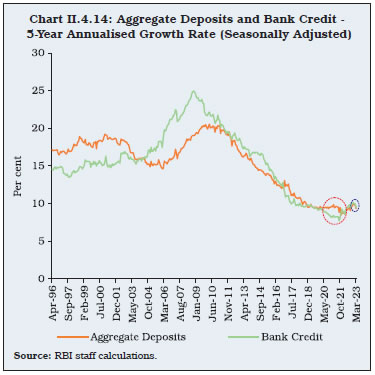 II.4.18 The deposit growth has generally been more stable than credit growth in the recent past (Chart II.4.15a). Further, the momentum in scheduled commercial banks’ (SCBs’) credit offtake has been mostly positive since end-August 2021 with the gradual withdrawal of lockdowns/ restrictions imposed to contain the spread of COVID-19 infections (Chart II.4.15b). As on March 24, 2023, SCBs’ credit-deposit ratio stood at 75.8 per cent (72.4 per cent as at end-March 2022). II.4.19 During 2022-23, amidst buoyant demand for credit growth, the issuances of certificates of deposits (CDs) by banks have risen significantly as compared to the previous year, reflecting additional demand for liquidity by banks to bridge the funding gap between buoyant credit offtake and modest deposit growth. In the primary market, fund mobilisation through CD issuances has been robust at ₹6.73 lakh crore during the year, markedly higher than ₹2.33 lakh crore for the corresponding period of last year. On the other hand, due to the hardening of interest rates on commercial papers (CPs) in sync with policy rate hike, firms have reduced their reliance on CPs during 2022-23 as evidenced by the significant deceleration in CP issuances during the year, as their appetite for bank credit improved (Chart II.4.16a). The pick up in credit offtake during the year was broad based, with SCBs’ credit growth at 15.0 per cent as on March 24, 2023 (9.6 per cent a year ago). Among bank groups, both public sector banks (PSBs) and private sector banks (PVBs) recorded an acceleration in credit growth. The y-o-y credit growth of PSBs at 16.4 per cent (5.6 per cent a year ago) as on March 24, 2023 was lower than that of PVBs at 17.8 per cent (12.8 per cent a year ago), leading to a marginal increase in the share of PVBs in total SCBs’ credit over last year. However, the share of PSBs in total SCBs’ credit remains the largest among bank-groups (Chart II.4.16b and Chart II.4.16c). 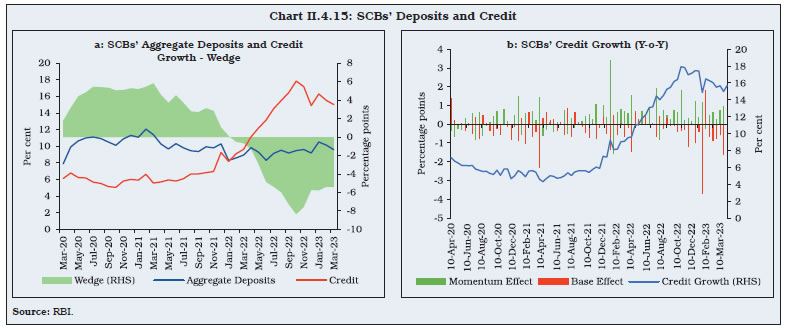
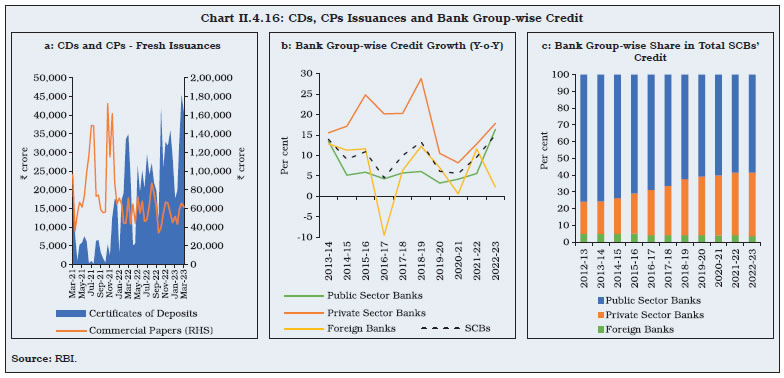
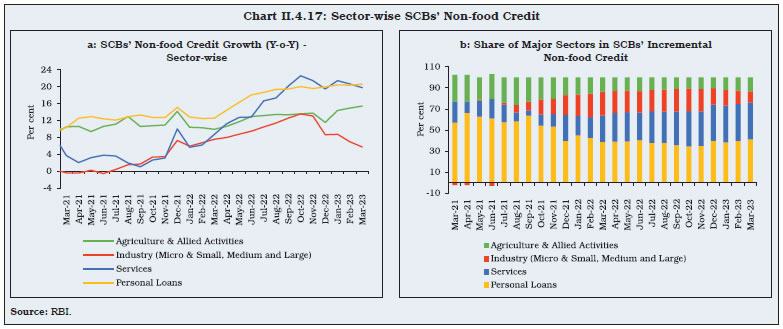 II.4.20 According to the data on sectoral deployment of bank credit26, the agriculture sector credit growth was supported by various measures taken by the government and the Reserve Bank. The micro and small industries/medium industries credit growth benefitted from the guarantee cover under the Emergency Credit Line Guarantee Scheme (ECLGS). Credit growth to large industries posted a turnaround during the year - led by capital-intensive industries such as infrastructure, supported by the government’s higher capex spending. However, it moderated by the end of the year. The infrastructure credit growth was led by roads sector, which continued to post decent credit growth over a high base. Commodity-intensive industries such as metals recovered during the year. Within services, bank credit to non-banking financial companies (NBFCs) consolidated with increased credit offtake during 2022-23 whereas the trade sector credit growth reflected a return of positive sentiment in business activities. Retail loans posted a sustained rise, outperforming overall credit growth, aided by housing and vehicle loans. Further, the share of personal loans and services sector in the incremental non-food credit rose gradually during the year, indicating an improvement in credit demand conditions in these sectors (Chart II.4.17 and Table II.4.2). 
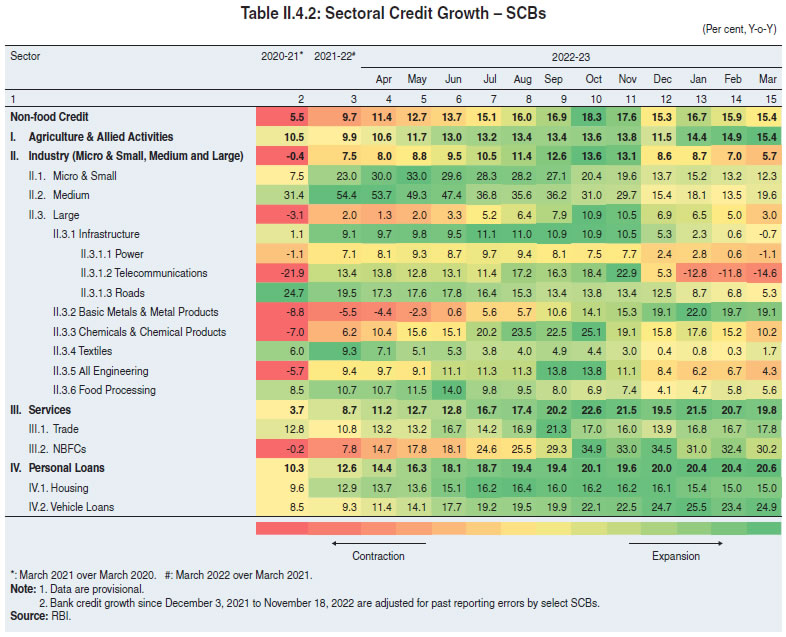 II.4.21 The credit-to-GDP gap narrowed considerably from its previous peak, reflecting the improved credit demand in the economy in the face of rising capacity utilisation in the manufacturing sector (Chart II.4.18a and Chart II.4.18b). 5. Conclusion II.4.22 Key monetary and credit aggregates moved in line with the Reserve Bank’s monetary policy stance and the state of aggregate demand in the economy. Return of consumer optimism and improvement in business outlook during the year could help sustain credit growth ahead, though banks may have to step up deposit mobilisation efforts in an atmosphere of declining system-wide surplus liquidity. II.5 FINANCIAL MARKETS II.5.1 The global financial markets witnessed bouts of turbulence for most part of the year as uncertainties amplified following the geopolitical tensions, deterioration of global growth and trade outlook, global surge in inflation and synchronised tightening of monetary policy. A semblance of market stability was visible by Q4:2022 when inflation appeared to have peaked, global food and commodity prices softened and global supply chain pressure eased. The global financial asset valuations, however, remained volatile during Q1:2023 due to a weaker global growth prospect in 2023 and concerns over financial stability following a banking turmoil in the US and Europe. II.5.2 Amidst aggressive tightening of monetary policy by the US Fed accompanied by a hawkish stance, strengthening of the US dollar against major currencies, and sell-off by foreign portfolio investors (FPIs), the EMEs experienced volatility in their equity and currency markets. The prices of most commodities and crude oil, rose significantly in Q2:2022 in response to the severe disruptions in supplies following the war in Ukraine. The prices came off subsequently as global demand conditions weakened, even as reopening of China after ending its zero-COVID policy exerted renewed pressure. II.5.3 The Indian financial markets remained resilient notwithstanding persistent impact of global spillovers. India’s stock market outperformed most of its EME peers in 2022-23 on the strength of macroeconomic fundamentals and favourable growth prospects. However, primary segment of the equity market witnessed moderation in fundraising amid volatile market conditions. The 10-year Government security (G-sec) yield hardened, however, remained range-bound amid changing outlook for monetary policy and inflation. The rupee came off its lows witnessed in Q3:2022-23 and traded largely range-bound in the fourth quarter, amidst softening of the US dollar. The buoyant demand for bank credit and early signs of a revival in the investment benefitted from higher profitability of scheduled commercial banks, along with improved asset quality, robust capital levels and liquidity buffers. II.5.4 Against this backdrop, money market developments are detailed in sub-section 2. Government security (G-sec) yields are discussed in sub-section 3. Sub-section 4 presents developments in the corporate bond market. Sub-section 5 profiles developments in the domestic equity market, followed by a discussion on movements in the Indian rupee in the foreign exchange market in sub-section 6. The last sub-section offers concluding observations along with some forward-looking perspectives. 2. Money Market II.5.5 The money market trends during 2022-23 reflected the ebbing surplus liquidity in the system, buoyancy in credit demand and tightening financial market conditions following the cumulative increase in policy repo rate by 250 basis points (bps). II.5.6 The weighted average call rate (WACR) - the operating target of monetary policy - moved gradually upward from below the floor of the policy corridor [i.e., standing deposit facility (SDF) rate] towards the policy repo rate in sync with the rate hike cycle and shift in the stance of monetary policy. As credit growth gradually rose above deposit growth, money market rates firmed up. The average spread of the WACR relative to the policy rate declined to (-)12 bps in 2022-23, from (-)75 bps in 2021-22, in accordance with the withdrawal of accommodation stance of the Reserve Bank.27 In Q4 of 2022-23, the spread reduced to (-)1 basis point (Chart II.5.1). II.5.7 Volatility in the call money segment, measured by the coefficient of variation28 of the WACR, increased to 18.1 in 2022-23 from 4.1 in the previous year. II.5.8 Average daily volume in the money market29 increased by 18 per cent to ₹5,36,456 crore during 2022-23 from ₹4,55,224 crore in 2021-22. Of the total money market volume, market share of triparty repo decreased to 72 per cent from 74 per cent last year while the volume in market repo increased to 26 per cent from 24 per cent last year; on the other hand, the share of uncollateralised call money segment remained same at around 2 per cent. In the call money segment, average daily volumes (excluding Saturdays) increased by 37 per cent during the year to ₹12,432 crore (from ₹9,060 crore during 2021-22) partly on account of the increase in cash reserve ratio (CRR) from 4.0 per cent to 4.5 per cent in May 2022 and the gradual decline in surplus liquidity in the system (Chart II.5.2). 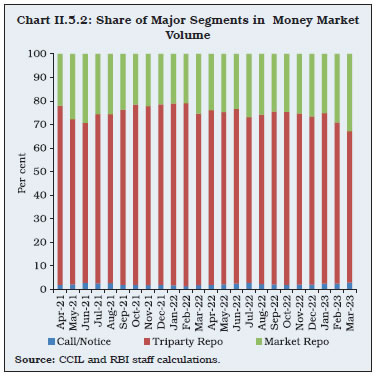 II.5.9 Interest rates on other money market instruments, viz., 91-day Treasury Bills (T-bills), certificates of deposit (CDs) and commercial papers (CPs) generally moved in sync with the overnight rates (call, triparty repo and market repo) and mostly traded around the repo rate till the first rate hike on May 4, 2022; thereafter, remained above the repo rate. The average daily spread of CD rates and CP rates (issued by NBFCs and non-NBFCs) over T-bill rates increased substantially during the year as compared to the previous year (Chart II.5.3). In Q4: 2022-23, the rates increased above the repo rate, reflecting increase in risk premia, coinciding with the reduction in surplus liquidity. 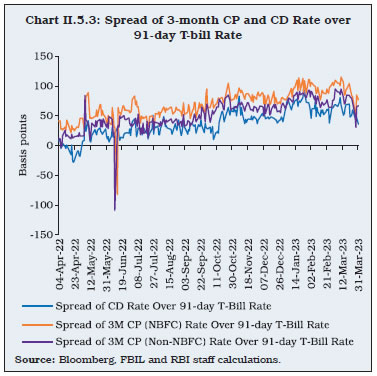 II.5.10 In the primary market, fresh issuance of CDs increased to ₹6.73 lakh crore during 2022-23 as compared with ₹2.33 lakh crore in 2021-22 as banks took recourse to CDs in an atmosphere of deposit mobilisation trailing credit demand even after raising term deposit rates by a considerable magnitude. New issuance of CPs in the primary market, however, decreased to ₹13.73 lakh crore in 2022-23 from ₹20.19 lakh crore in 2021-22. 3. G-sec Market II.5.11 Notwithstanding initial market concerns about the size of the combined borrowing programme of the centre and the states, the borrowing programme was completed in an orderly manner with a range bound term spread (details are covered in Chapter VII). During the course of the year, however, both domestic and global developments impacted the evolution of yields. During Q1:2022-23, G-sec yields hardened in response to the announcement of normalisation of the LAF corridor to 50 bps with introduction of the SDF as the new floor of the policy corridor. The repo rate hike of 40 bps and raising of CRR requirement to 4.50 per cent in an off-cycle monetary policy committee (MPC) meeting held in May 2022, against the backdrop of successive high domestic CPI prints, contributed to rise in yields. The 10-year generic yield reached a high of 7.62 per cent on June 16, 2022 and closed the April-June 2022 quarter at 7.45 per cent (Chart II.5.4). 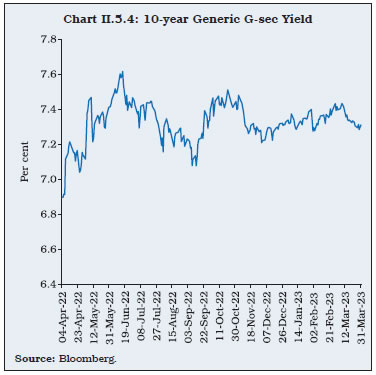 II.5.12 During Q2:2022-23, longer-term yields softened on account of fall in global crude oil prices and market expectations of inclusion of Indian G-secs in global bond indices. Towards the end of the quarter, however, yields started hardening due to rise in global yields and domestic inflation continuing above the upper tolerance level of the inflation target. Over the quarter, the domestic yield curve witnessed flattening as short-term yields increased more than the longer-term yields on account of rate hike expectations. The 10-year generic yield closed the quarter at 7.40 per cent. Yields softened in Q3:2022-23, tracking international crude oil prices and global yields on market assessment of global inflation peaking and associated expectations of lower pace of rate increases in the US. During Q4:2022-23, initially G-sec yields traded rangebound. However, yields rose later tracking global yields, higher than expected CPI and perceived hawkish stance of the MPC. The yields softened by end of 2022-23 tracking global yields and fall in Brent crude oil prices. The 10-year generic yield closed 2022-23 at 7.31 per cent. II.5.13 With the introduction of the fully accessible route (FAR)30 with effect from April 1, 2020, FPIs have three routes to invest in G-secs, viz., the general route with investment limits set under the medium-term framework (MTF), voluntary retention route (VRR) and FAR. The limit for FPI investments in G-secs under the MTF for the year 2022-23 was set at ₹4,04,780 crore. The number of securities included under the FAR scheme increased from 17 securities (with outstanding stock of ₹17,58,043 crore as on April 1, 2022) to 26 securities (with outstanding stock of ₹27,96,589 crore as on March 31, 2023). During 2022-23, FPIs registered a net sell of ₹22,641 crore in G-secs under the general route. FPIs also withdrew ₹1,980 crore in G-secs under VRR, which has a combined investment limit of ₹2,50,000 crore for G-secs and corporate bonds. However, FPIs invested ₹31,129 crore under the FAR route during the same period. FPIs sold a net amount of ₹100 crore of state government securities31 (SGS) during the same period and in the aggregate invested ₹6,408 crore in G-secs and SGSs, across MTF, FAR and VRR segments during 2022-23. 4. Corporate Debt Market II.5.14 Corporate bond yields hardened during 2022-23 tracking the rise in benchmark G-sec yields and widening of credit spreads. The monthly average yield on AAA-rated 3-year bonds of public sector undertakings (PSUs), financial institutions (FIs) and banks hardened by 193 bps while those on NBFCs and corporates hardened by 215 bps and 220 bps, respectively, in March 2023 vis-à-vis March 2022. The monthly average yield on AAA-rated 3-year bonds stood at 7.75 per cent for PSUs, FIs and banks; 8.12 per cent for NBFCs; and 8.07 per cent for corporates in March 2023. II.5.15 During 2022-23, the monthly average risk premium or spread on AAA-rated 3-year bonds (over 3-year G-sec) increased from 21 bps to 36 bps for PSUs, FIs and banks; 35 bps to 73 bps for NBFCs and 25 bps to 68 bps for corporates. The widening of spreads was visible across tenures and rating segments of corporate bonds. The average daily secondary market turnover in the corporate bond market increased to ₹5,549 crore during 2022-23 from ₹5,430 crore during the previous year (Chart II.5.5). The widening of risk premia is reflective of greater risk aversion or risk-off sentiment in global markets in view of the heightened uncertainty about future macroeconomic outlook, implying higher expected return as a compensation for the extra risk in investment (Box II.5.1). 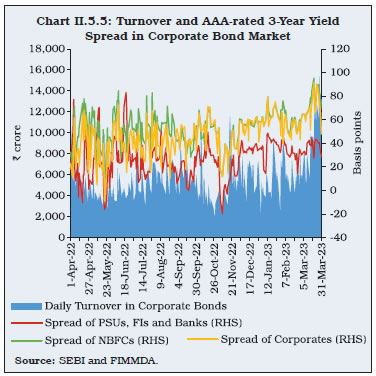 II.5.16 Primary corporate bond issuances rose in the domestic market, while overseas bond issuances moderated in 2022-23. Domestic corporate bond issuances increased to ₹7.6 lakh crore during 2022-23 from ₹6.0 lakh crore during the previous financial year. Private placements remained the preferred channel for corporates, accounting for 98.8 per cent of total resources mobilised through the bond market. The size of outstanding corporate bonds increased by 4.6 per cent y-o-y to ₹42 lakh crore (i.e., 15.4 per cent of GDP) at end-March 2023. Investments by FPIs in outstanding stock of corporate bonds decreased to ₹1.04 lakh crore at end-March 2023 from ₹1.21 lakh crore at end-March 2022. Consequently, utilisation of the approved limit by FPIs declined to 15.52 per cent at end-March 2023 from 19.94 per cent at end-March 2022. Box II.5.1 Drivers of Term Premia and Risk Premia in Financial Markets The slope of the yield curve or term premia is defined as the difference in yields between long-term bond and short-term bond. Term premia is considered to be sensitive to the expected future path of growth, inflation, and monetary policy (Kopp, 2018). Movements in time varying term premia and risk premia, conditioned by both global and domestic factors, contain information about the future macroeconomic outlook and market expectations about the future interest rates. In advanced economies, term premia and risk premia are considered to be inversely related as decrease in term premia may imply a slowing economy, which may translate into an increase in credit spreads (Lepone et. al., 2009; Collin et. al., 2001). An empirical exercise is undertaken to identify the key drivers of term premia and risk premia and their inter-relationship in India. For the exercise, as a broad proxy, term premia is measured as the difference between 10-year G-sec yield and 3-month treasury bill yield. The yield curve has flattened in India since March 2022; however, it has continued to remain upward sloping during 2022-23 (Chart 1). A forward stepwise selection (FSS) regression technique is used that selects and ranks the variables based on their incremental contribution to goodness of fit or R2. This process is repeated until adding additional variables does not result in significant increase in R2 values. Systemic liquidity conditions, G-secs turnover, growth in index of industrial production (IIP) and global economic policy uncertainty are identified as the important drivers of term premia in India. Deficit liquidity conditions tend to raise short-term bond yields in turn leading to a fall in term premia, while higher G-sec turnover entails higher demand for G-secs and lower long-term yields leading to a fall in the term premia (Table 1). Stronger IIP growth steepens the slope of the yield curve, while an increase in global uncertainty also raises the term premia. | Table 1: Drivers of Term Premia | | Ranking | Variables | Sign | | 1 | Net LAF (Systemic Liquidity) | - | | 2 | G-secs Turnover (G-sec Market Liquidity) | - | | 3 | IIP Growth (Economic Activity) | + | | 4 | Global Economic Policy Uncertainty Index | + | Note: All the above reported variables are statistically significant at 5 per cent level of significance. Other variables used in the FSS regression included CPI inflation (cycle component), net FPI flows in debt market, net government of India market borrowings, and USD/INR exchange rate, but were found to be statistically insignificant. The sample covers the period from November 2012 to September 2022.
Source: RBI staff estimates. | Term premia may be correlated with risk premia, the latter measured as the difference between yield on AAA-rated 3-year corporate bond and similar maturity G-sec yield (Chart 2). The correlation between risk premia and term premia came out to be -0.58, for the sample period. Estimates using FSS regression reveal that higher term premia lowers risk premia. Other than term premia, variables used in the FSS regression to determine the drivers of risk premia, i.e., India VIX, inflation, change in oil prices, net LAF, US credit spreads and exchange rate volatility (1-month), are found to be statistically insignificant. References: 1. Collin-Dufresn, P., Goldstein, R. S., & Martin, J. S. (2001), ‘The Determinants of Credit Spread Changes’, The Journal of Finance, 56(6), 2177-2207. 2. Kopp, E., & Williams, P. D. (2018), ‘A Macroeconomic Approach to the Term Premium’, International Monetary Fund Working Paper, No. 2018/140. 3. Lepone, A., & Wong, B. (2009), ‘Determinants of Credit Spread Changes: Evidence from the Australian Bond Market’, Australasian Accounting, Business and Finance Journal, 3(2), 26-35. | 5. Equity Market II.5.17 The Indian equity market exhibited resilience during 2022-23 despite an environment characterised by heightened global uncertainties. Outperforming most of the EME peers during 2022-23, the BSE Sensex increased by 0.7 per cent to close at 58,992 and the Nifty 50 decreased by 0.6 per cent to close at 17,360 (Chart II.5.6a and Chart II.5.6b). The India VIX, which captures short-term volatility of Nifty 50, averaged 17.5 during 2022-23 as compared with an average of 17.8 during 2021-22. II.5.18 The Indian equity market registered losses in Q1:2022-23 amid concerns over rising global inflation, monetary policy tightening in the US and COVID-19 related lockdowns in China. Hawkish commentaries by the US Fed fuelled broad based risk-off sentiments. Domestic equities plunged in June 2022 as policy rate hike by the US Fed coupled with unrelenting inflation pressures raised fears of a global economic slowdown triggering sell-offs across the markets. II.5.19 The benchmark indices bounced back in July 2022, as the decline in global commodity prices and moderating inflation concerns lifted risk appetite, leading to a fall in global bond yields and rise in equity prices. Further, release of robust Q1:2022-23 earnings results of Indian corporates restored investors’ confidence. FPIs turned net buyers in Indian equity market in July 2022 after a gap of nine months. Notwithstanding weak cues from global markets, Indian equities gained further in August 2022 supported by strong macro-economic data releases and softening of domestic inflation. II.5.20 The uptrend, however, reversed in September 2022 as increase in policy rate by the US Fed and major global central banks led to another round of sell-off in global equity markets, with FPI flows turning negative in Indian equities during the month. The decline in Indian equity indices was, however, mild relative to other global equity markets. II.5.21 Indian equities rebounded in October 2022 as global risk appetite improved with the positive economic data releases and FPIs turned net buyers in the Indian equity market. Furthermore, strong Q2: 2022-23 earnings results from the Indian banking and financial sector corporates boosted the market sentiment. The benchmark Indian equity indices scaled fresh peaks during November 2022, supported by improved risk sentiments amidst moderating global and domestic inflation prints coupled with less hawkish US Federal Open Market Committee (FOMC) minutes. II.5.22 The Bombay Stock Exchange (BSE) Sensex closed at a new all-time high of 63,284 on December 1, 2022 but declined subsequently tracking weak cues from global markets. The risk appetite was dented by indications of further tightening of monetary policy by major global central banks coupled with a resurgence of COVID-19 cases in China. II.5.23 After remaining range bound in the first half of January 2023, domestic equity markets initially moved higher in the second half tracking positive corporate earnings releases and reduction in windfall tax on crude oil. However, sentiments turned negative towards the end of the month, following the unusual price movement in the stocks of a business conglomerate. II.5.24 The Union Budget 2023-24 announcements relating to increase in capital expenditure and select direct tax reliefs, statements by financial sector regulators re-affirming soundness of domestic financial and macroeconomic conditions helped boost market sentiments in early February. However, markets came under pressure in the second half amid weak global cues. The risk appetite was dented, following release of the hawkish minutes of the FOMC meeting which stated concerns over elevated inflation and reaffirmed its commitment to bring inflation under control, which led to a sharp rise in the US Treasury yields. II.5.25 Domestic equities gained in early March 2023 buoyed by positive domestic and global economic data releases. Subsequently, concerns over financial stability in the wake of rapid monetary policy tightening came to the forefront amid banking sector turmoil in the US and Europe. However, markets recovered towards month-end, as contagion fears receded on assurances from several stakeholders and regulators regarding the health of the global banking sector. II.5.26 On a sectoral basis, companies across industrials, capital goods, fast moving consumer goods, auto and banking outperformed others during the period 2022-23 (Chart II.5.7.a). II.5.27 FPI flows remained volatile during the year. FPIs made net sales of ₹43,943 crore in the Indian equity market during 2022-23 in comparison with net sales of ₹1.3 lakh crore in the previous financial year. Flows from mutual funds, however, remained supportive. Mutual funds made net purchases of ₹1.7 lakh crore on Indian stock exchanges in 2022-23 (Chart II.5.7.b). The ownership of FPIs in Indian equities (NSE-listed companies) has been declining from the peak share of 23.3 per cent in March 2015 to 20.6 per cent by end-March 2023 as domestic institutional investors (DII) inflows have outpaced FPI inflows (Chart II.5.7.c). II.5.28 The share of domestic institutional investors (including domestic mutual funds, insurance companies and pension funds) in market capitalisation of Indian equities increased further to 16.4 per cent at end-March 2023 from 13.7 per cent at end-March 2022. The share of retail and high net-worth individuals in Indian equities, however, moderated to 9.4 per cent at end-March 2023 from 9.6 per cent at end-March 2022. Primary Market Resource Mobilisation II.5.29 The primary segment of the equity market witnessed moderation in fundraising during 2022-23 amid volatile market conditions. Resource mobilisation through initial public offers (IPOs), follow-on public offers (FPOs) and rights issues declined by over 50 per cent to ₹0.66 lakh crore during 2022-23 as against ₹1.39 lakh crore mobilised during the previous year (Chart II.5.8.a and Appendix Table 5). During 2022-23, mobilisation of ₹59,072 crore were made through 165 IPO/ FPO issues, including the Life Insurance Corporation’s mobilisation of ₹20,557 crore via IPO. The small and medium enterprises (SME) segment of the BSE and NSE witnessed significant traction in 2022-23, with 125 SME IPO issues garnering ₹2,333 crore as against 70 SME IPO/ FPO issues mobilising ₹958 crore during 2021-22. Resource mobilisation through rights issues decreased to ₹6,751 crore during 2022-23 as compared with ₹26,327 crore during the previous year. Resource mobilisation through preferential allotment and qualified institutional placement (QIP) decreased marginally to ₹92,044 crore during 2022-23 as against ₹92,135 crore during 2021-22. II.5.30 Net resources mobilised by mutual funds decreased by 69.1 per cent to ₹0.76 lakh crore during 2022-23 as against ₹2.47 lakh crore mobilised during the previous financial year. Equity-oriented mutual fund schemes witnessed net mobilisation of ₹1,44,775 crore in 2022-23 as against net mobilisation of ₹1,54,094 crore in the previous year. Average monthly contributions to mutual funds through systematic investment plan (SIP) increased to ₹12,998 crore in 2022-23 from ₹10,381 crore in the previous financial year. Assets under management (AUM) of equity-oriented mutual funds increased by 10.9 per cent to ₹15.2 lakh crore at end-March 2023 from ₹13.7 lakh crore at end-March 2022. Debt-oriented schemes, however, witnessed net redemptions of ₹2.1 lakh crore during 2022-23 as investors withdrew to avoid price risk amid hardening bond yields (Chart II.5.8.b). 6. Foreign Exchange Market II.5.31 In the foreign exchange market, turnover increased across both interbank and merchant segments as compared to the previous year. II.5.32 The Indian rupee remained under pressure during Q1:2022-23 amid risk-off sentiments emanating from geopolitical tensions in the Eastern Europe and strengthening of US dollar, as the US Fed stepped up its monetary tightening and began trimming its balance sheet in June 2022. In June 2022, the US Fed raised its benchmark rate by an outsized 75 bps, first time since 1994. US financial conditions tightened as US treasury yields rose to multi-year highs, equities plummeted, and US dollar gained on safe haven demand. The US dollar Index rose by 6.5 per cent during the quarter, its best quarter since 2016. The Indian rupee was under pressure as Brent crude oil remained elevated and volatile during the quarter, averaging around US$ 112 per barrel. The FPIs withdrew around US$ 14 billion during the quarter which also weighed on the Indian rupee. Overall, the Indian rupee weakened by 4.0 per cent during the quarter. II.5.33 In Q2:2022-23, the US Fed continued to tighten monetary policy with outsized rate hikes to tackle sticky and persistently high inflation, exacerbating volatility across asset classes. The US dollar made strong advances amid growing energy security concerns in Europe and hawkish US Fed commentary at Jackson Hole symposium. A massive sell-off in the United Kingdom assets, triggered by sweeping unfunded tax cuts in a bid to boost economic growth, saw the British pound sinking to record lows, while the US dollar Index surged to a fresh two-decade high of 114.78 on September 28, 2022, amid safe haven demand. India’s widening trade deficit put further pressure on the rupee. However, this quarter also witnessed a halt and somewhat reversal of the nine successive months of equity related FPI outflows (October 2021 to June 2022). Softening in Brent crude oil prices by 23.0 per cent during Q2:2022- 23 provided support to the rupee. However, the rupee weakened by 2.9 per cent during the quarter ended September 2022. II.5.34 The US dollar strength continued during the first half of Q3:2022-23 amid resilient US labour market data and continuation of zero-COVID-19 policies in China. The Indian rupee came under pressure, broadly in line with other emerging market currencies and touched a fresh intra-day low of ₹83.29/USD on October 20, 2022. The MSCI emerging market currency Index slipped to its lowest level since June 2020. However, the US dollar depreciated in November 2022 as inflation in the US showed signs of peaking, spurring talks of a Fed pivot. US financial conditions eased significantly post release of CPI data showing moderation. Further, risk assets got a reprieve as the US Fed moderated its pace of hiking to 50 bps in December 2022 after four consecutive 75 bps hikes. The Brent crude oil prices softened further in December giving up gains made in 2022 weighed by demand concerns as reopening of China was marred by a surge in COVID-19 cases. The rupee recovered from its lows and traded largely range bound for the rest of the quarter and closed lower by 1.7 per cent (Chart II.5.9). II.5.35 In Q4:2022-23, the US dollar Index continued to soften and touched a low of 100.82 on February 2, 2023, amid improved risk on sentiments following slowing of the pace of rate hikes by US Fed to 25 bps. However, tight labour market conditions and inflation remaining more persistent than previously anticipated, renewed concerns over rates rising higher, leading to strengthening of the US dollar Index. However, Indian rupee remained supported as the current account deficit improved and Brent crude oil prices remained range bound. During the quarter, Indian rupee gained 0.7 per cent. II.5.36 During 2022-23, forward premia has trended lower as interest rate differential between India and US narrowed amid aggressive rate hikes by the US Fed. The difference between policy rates shrunk by 200 bps during 2022-23 with the US Fed hiking rates by 450 bps during the period vis-à-vis a hike of 250 bps by the Reserve Bank. II.5.37 In tandem with the movements in nominal exchange rate of the Indian rupee, the 40-currency nominal/real effective exchange rate (NEER/ REER) moved with a depreciating bias during 2022-23. On an average basis, the 40-currency NEER and REER depreciated by 2.0 per cent and 1.8 per cent, respectively, during the year. 7. Conclusion II.5.38 Domestic financial market movements remained orderly, notwithstanding persisting impact of global spillovers during the year. Relentless strengthening of the US dollar and aggressive tightening of monetary policy by the US Fed impacted portfolio flows, as in other EMEs. Indian equity market exhibited signs of decoupling, on sustained support from domestic institutional investors; the INR exhibited orderly adjustment with lower volatility relative to many other EMEs. The money market trends moved in alignment with the tightening of policy rate cumulatively by 250 bps and the change in policy stance towards withdrawal of accommodation. Notwithstanding initial concerns about the size of the combined borrowing programme of the centre and the states, the movements of yields in the G-sec market remained range bound. Going forward, financial markets will be conditioned by domestic macroeconomic outlook as also the future path of US monetary policy and the strength of the US dollar. II.6 GOVERNMENT FINANCES II.6.1 The escalation of geopolitical conflict following the war in Ukraine led to a sharp rise in food and energy prices, prompting governments across the world to implement targeted measures, including energy tax cuts, price subsidies and cash transfers, to mitigate the impact of the cost of living crisis on households and businesses. Fiscal deficit and debt, however, moderated in most of the G20 countries in 2022, reflecting the unwinding of pandemic-related measures (Fiscal Monitor, October 2022, IMF) [Chart II.6.1]. In India, extensive targeted fiscal measures were undertaken to contain inflation during 2022-23, while pursuing fiscal consolidation accompanied by large increase in capex aimed at bolstering macro-economic stability and supporting growth and investment activity. 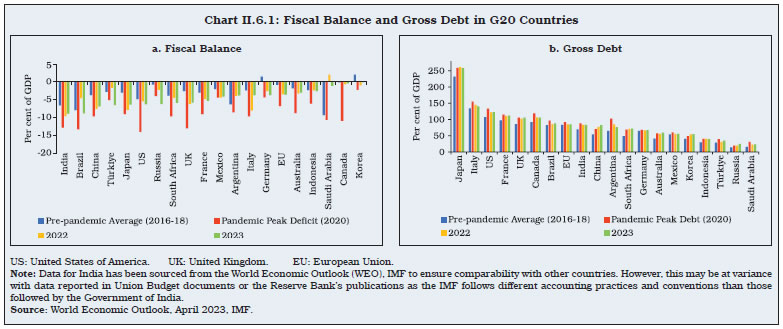 II.6.2 Against this backdrop, sub-sections 2 and 3 present the position of central government finances in 2022-23 and 2023-24, respectively. Sub-sections 4 and 5 outline the developments in state government finances during 2022-23 and 2023-24. General government finances are discussed in sub-section 6. The final section sets out concluding remarks. 2. Central Government Finances in 2022-23 II.6.3 The gross fiscal deficit (GFD) of the Union government declined from 6.75 per cent of GDP in 2021-22 to 6.45 per cent of GDP in 2022-23 revised estimates (RE)32, in line with the budgeted target of 6.44 per cent. There were, however, sizeable deviations in revenues and expenditure from their budgeted levels (Chart II.6.2). II.6.4 On the back of soaring crude oil and commodity prices, the central government announced several measures during April-May 2022 to shield domestic consumers from high prices - additional fertiliser subsidy was approved for the period from April to September 2022; excise duty on petrol and diesel was reduced by ₹8 and ₹6 per litre, respectively; LPG subsidy of ₹200 per 14.2 kilogram LPG cylinder was announced for Pradhan Mantri Ujjwala Yojana (PMUY) beneficiaries; and customs duties on plastics and iron and steel products were rejigged33. Further, the Pradhan Mantri Garib Kalyan Anna Yojana was extended - Phase VI (April - September 2022) and Phase VII (October - December 2022) while free foodgrains to about 81.4 crore beneficiaries under the National Food Security Act (NFSA) for one year from January 1, 2023 was announced. As a result, subsidy expenditure overshot budget estimates (BE) by ₹2.1 lakh crore (food subsidy increased by ₹0.8 lakh crore and fertiliser subsidy increased by ₹1.2 lakh crore), leading to an increase in revenue expenditure by 1.0 per cent of GDP (₹2.6 lakh crore) in 2022-23 (RE)34 over BE. 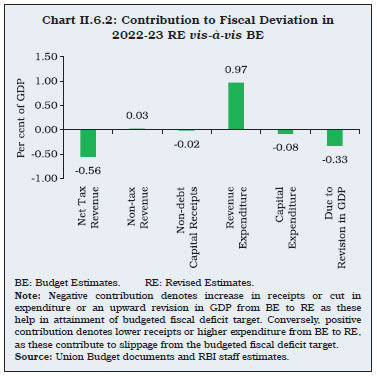 II.6.5 Meanwhile, the government remained committed to capital spending, and as a result capital outlay (capital expenditure less loans and advances) exceeded budget estimates by around ₹10,000 crore. Loans and advances, however, witnessed a shortfall of around ₹32,000 crore, resulting in a marginal shortfall in overall capex by 0.1 per cent of GDP (around ₹22,000 crore) in 2022-23 (RE) vis-à-vis the BE. II.6.6 On the receipts side, tax revenues remained robust, surpassing BE by 0.6 per cent of GDP (₹1.5 lakh crore) as an increase in corporation tax, income tax and goods and services tax (GST) revenues outweighed lower excise and customs collections. Non-tax receipts fell short of budgeted targets in 2022-23 (RE) due to lower dividend transfers by the Reserve Bank, but the shortfall was capped at 0.03 per cent of GDP (₹7,900 crore) on the back of higher interest receipts, spectrum revenues and dividend transfers from public sector enterprises (Chart II.6.3). Disinvestment receipts are estimated at ₹50,000 crore in 2022-23 (RE) vis-à-vis the budgeted target of ₹65,000 crore. 3. Central Government Finances in 2023-24 II.6.7 For 2023-24, the Union Budget has prioritised capital expenditure to accelerate growth while maintaining fiscal prudence to strengthen macroeconomic stability. Reiterating its commitment to reduce gross fiscal deficit (GFD) below 4.5 per cent of GDP by 2025-26, the government has budgeted GFD at 5.9 per cent of GDP35 in 2023-24, a consolidation of 53 basis points over 2022-23 (RE). This consolidation is sought to be achieved through containment of revenue expenditure at 11.6 per cent of GDP, even as capital expenditure is budgeted to rise to 3.3 per cent of GDP, from an average of 1.7 per cent of GDP during 2010-20 (Table II.6.1). | Table II.6.1: Central Government's Fiscal Performance | | (Per cent of GDP) | | Item | 2004-08 | 2008-10 | 2010-15 | 2015-16 | 2016-17 | 2017-18 | 2018-19 | 2019-20 | 2020-21 | 2021-22 | 2022-23 (BE) | 2022-23 (RE) | 2023-24 (BE) | | 1 | 2 | 3 | 4 | 5 | 6 | 7 | 8 | 9 | 10 | 11 | 12 | 13 | 14 | | I. Non-debt Receipts | 11.0 | 9.7 | 9.5 | 9.1 | 9.4 | 9.1 | 8.8 | 8.7 | 8.5 | 9.4 | 8.9 | 8.9 | 9.0 | | II. Gross Tax Revenue (a+b) | 10.7 | 10.4 | 10.2 | 10.6 | 11.1 | 11.2 | 11.0 | 10.0 | 10.2 | 11.5 | 10.7 | 11.2 | 11.1 | | a) Direct Tax | 5.1 | 6.0 | 5.7 | 5.4 | 5.5 | 5.9 | 6.0 | 5.2 | 4.8 | 6.0 | 5.5 | 6.1 | 6.0 | | b) Indirect Tax | 5.6 | 4.4 | 4.5 | 5.2 | 5.6 | 5.4 | 5.0 | 4.8 | 5.5 | 5.5 | 5.2 | 5.1 | 5.1 | | III. Net Tax Revenue | 7.9 | 7.6 | 7.3 | 6.9 | 7.2 | 7.3 | 7.0 | 6.7 | 7.2 | 7.7 | 7.5 | 7.7 | 7.7 | | IV. Non-tax Revenue | 2.2 | 1.8 | 1.8 | 1.8 | 1.8 | 1.1 | 1.2 | 1.6 | 1.0 | 1.6 | 1.0 | 1.0 | 1.0 | | V. Non-debt Capital Receipts | 0.9 | 0.3 | 0.4 | 0.5 | 0.4 | 0.7 | 0.6 | 0.3 | 0.3 | 0.2 | 0.3 | 0.3 | 0.3 | | VI. Total Expenditure | 14.5 | 16.1 | 14.4 | 13.0 | 12.8 | 12.5 | 12.2 | 13.4 | 17.7 | 16.2 | 15.3 | 15.4 | 14.9 | | VII. Revenue Expenditure | 12.1 | 14.4 | 12.6 | 11.2 | 11.0 | 11.0 | 10.6 | 11.7 | 15.5 | 13.6 | 12.4 | 12.7 | 11.6 | | VIII. Capital Expenditure | 2.4 | 1.7 | 1.8 | 1.8 | 1.8 | 1.5 | 1.6 | 1.7 | 2.1 | 2.5 | 2.9 | 2.7 | 3.3 | | IX. Revenue Deficit | 2.0 | 5.0 | 3.5 | 2.5 | 2.1 | 2.6 | 2.4 | 3.3 | 7.3 | 4.4 | 3.8 | 4.1 | 2.9 | | X. Gross Fiscal Deficit | 3.5 | 6.3 | 4.9 | 3.9 | 3.5 | 3.5 | 3.4 | 4.6 | 9.2 | 6.8 | 6.4 | 6.5 | 5.9 | BE: Budget Estimates. RE: Revised Estimates.
Note: Going by the principle of using latest available GDP data for any year, the nominal GDP for 2022-23 (RE) is as per the SAE released on February 28, 2023. In view of this, the fiscal indicators as per cent of GDP given in this section, may vary from those reported in the Union Budget documents. Also refer to footnote 1 of Chapter I of this Report.
Source: Union Budget documents. | II.6.8 On the expenditure front, a rollback of spending on subsidies is envisaged in 2023-24, on expectations of softening urea prices and scaling down of pandemic related food subsidies. Food and fertiliser subsidies are budgeted to contract by 31.3 per cent and 22.3 per cent, respectively, in 2023-24 (BE), thereby capping revenue spending growth at 1.2 per cent. On the other hand, capital expenditure is budgeted to increase by 37.4 per cent with the Ministries of Road and Railways accounting for almost half of the budgeted capex (Chart II.6.4). Under capital expenditure, the scheme for providing financial assistance to states for capital investment has been extended to 2023-24 (BE) with an enhanced allocation of ₹1.3 lakh crore. Capital expenditure excluding loans and advances, i.e., capital outlay is budgeted to rise to 2.8 per cent of GDP in 2023-24 (BE), the highest ever in the post-liberalisation period, reflecting a sustained improvement in the quality of spending (Chart II.6.5). 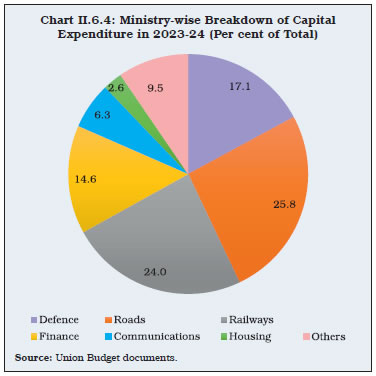
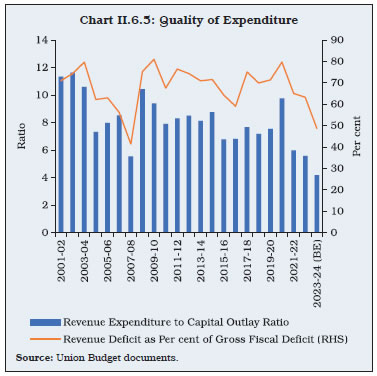 II.6.9 On the receipts side, gross tax revenue is budgeted to increase by 10.4 per cent, with a budgeted buoyancy of 0.96 that is close to the trend level (proxied by the average from 2010-11 to 2018-19) [Table II.6.2]. GST collections have been steadily improving on the back of efforts to improve compliance and have been budgeted at 3.2 per cent of GDP in 2023-24, the highest since the inception of GST (Chart II.6.6). Non-tax receipts are budgeted to increase by 15.2 per cent, while the disinvestment target has been set at ₹51,000 crore. II.6.10 The Union Budget 2023-24 envisages restrained market borrowings, which will open up space for private investment. Gross market borrowings for 2023-24 are pegged at ₹15.43 lakh crore (5.1 per cent of GDP) as against ₹14.21 lakh crore in 2022-23 RE (5.2 per cent of GDP). Market borrowings (net) are the main source of financing GFD (66.1 per cent) in 2023-24 (BE) followed by small savings (26.4 per cent) [Chart II.6.7]. Further, a build-up of cash balances has been budgeted, which provides a financing buffer to the Government of India. | Table II.6.2: Tax Buoyancy | | | Average Tax Buoyancy (2010-11 to 2018-19) | 2022-23 (BE) | 2022-23 (RE) | 2023-24 (BE) | | 1 | 2 | 3 | 4 | 5 | | 1. Gross Tax Revenue | 1.11 | 0.86 | 0.77 | 0.96 | | 2. Direct Taxes | 1.03 | 1.22 | 1.08 | 0.96 | | (i) Corporation Tax | 0.92 | 1.20 | 1.09 | 0.96 | | (ii) Income Tax | 1.27 | 1.28 | 1.09 | 0.96 | | 3. Indirect Taxes | 1.25 | 0.51 | 0.44 | 0.95 | | (i) GST | - | 1.40 | 1.40 | 1.10 | | (ii) Customs Duty | 0.31 | 1.14 | 0.32 | 1.01 | | (iii) Excise Duty | 0.91 | -1.34 | -1.19 | 0.54 | - : Not available. GST: Goods and Services Tax.
Note: Tax buoyancy is defined as the responsiveness of tax revenue to changes in nominal GDP and to discretionary changes in tax policies. Calculations for 2022-23 (BE) are made over 2021-22 (RE).
Source: RBI staff calculations based on Union Budget documents for various years. |
4. State Finances in 2022-23 II.6.11 States and Union Territories (UTs) have budgeted for a consolidated GFD of 3.4 per cent of GDP for 2022-23 (Table II.6.3). The ratio is lower than that in 2021-22 (RE) and is within the indicative target of 4 per cent set by the Centre. States have budgeted for higher revenue collections, primarily in states’ goods and services tax (SGST), excise duties and sales tax/VAT. States’ revenue spending and capital outlay are also budgeted to increase. II.6.12 As per the data available till February 2023, states’ GFD during April-February 2022-23 was marginally higher than the corresponding period of the previous year. States’ revenue receipts posted a strong y-o-y growth of 14.1 per cent, primarily driven by robust tax collections. In November 2022, the central government released two instalments of tax devolution amounting to ₹1.16 lakh crore as against the usual monthly devolution of ₹0.58 lakh crore. The Centre also released ₹0.17 lakh crore to the states/UTs as GST compensation for April-June 2022. Overall, while the rise in revenue expenditure during April-February, 2022-23 was higher than a year ago, the growth in capex is lower despite the Centre augmenting states’ resources by ₹1 lakh crore through 50-year interest-free loan. | Table II.6.3: Fiscal Position of States/UTs | | (Amount in ₹ lakh crore) | | Item | 2018-19 | 2019-20 | 2020-21 | 2021-22 (RE) | 2022-23 (BE) | | 1 | 2 | 3 | 4 | 5 | 6 | | I. Revenue Receipts | 26.2 | 26.7 | 25.9 | 33.5 | 38.6 | | (13.9) | (13.3) | (13.1) | (14.2) | (14.9) | | II. Capital Receipts | 0.42 | 0.57 | 0.23 | 0.27 | 0.2 | | (0.2) | (0.3) | (0.1) | (0.1) | (0.1) | | III. Revenue Expenditure | 26.4 | 27.9 | 29.6 | 35.7 | 39.4 | | (14.0) | (13.9) | (14.9) | (15.1) | (15.3) | | IV. Capital Expenditure | 4.9 | 4.6 | 4.6 | 6.9 | 8.2 | | (2.6) | (2.3) | (2.3) | (2.9) | (3.2) | | a. Capital Outlay | 4.4 | 4.2 | 4.1 | 6.3 | 7.5 | | (2.3) | (2.1) | (2.1) | (2.7) | (2.9) | | b. Loans and Advances by States | 0.5 | 0.4 | 0.4 | 0.6 | 0.6 | | (0.2) | (0.2) | (0.2) | (0.3) | (0.3) | | V. Fiscal Deficit | 4.6 | 5.2 | 8.0 | 8.8 | 8.8 | | (2.4) | (2.6) | (4.1) | (3.7) | (3.4) | | VI. Revenue Deficit | 0.2 | 1.2 | 3.7 | 2.2 | 0.8 | | (0.1) | (0.6) | (1.9) | (0.9) | (0.3) | Note: Figures in parentheses are per cent of GDP.
Source: Budget documents of state governments and CAG. | 5. State Finances in 2023-24 II.6.13 The Centre has put limit to state’s fiscal deficit at 3.5 per cent of gross state domestic product (GSDP) for 2023-24, of which 0.5 per cent is tied to power sector reforms. As per information available for 26 states/UTs, the gross fiscal deficit for 2023-24 is estimated to be 3.2 per cent of GSDP, well within the Centre’s target (Table II.6.4). The gross transfer to the states is budgeted to increase in 2023-24 (BE), largely due to enhanced tax devolution and an increase in allocation for special assistance (as loans) to states for capex. Finance Commission grants are expected to decline in 2023-24, primarily due to lower transfers under post devolution revenue deficit grants, while the budgeted transfers to the local bodies and health sector have seen a sharp rise. | Table II.6.4: State Government Finances 2023-24*: Key Indicators | | (Per cent of GSDP) | | Item | 2021-22 | 2022-23 (RE) | 2023-24 (BE) | | 1 | 2 | 3 | 4 | | Revenue Deficit | 0.4 | 0.6 | 0.2 | | Gross Fiscal Deficit | 2.7 | 3.5 | 3.2 | | Primary Deficit | 0.5 | 1.4 | 1.1 | *: Data pertain to twenty-six states/UTs that have presented their final budgets for 2023-24.
Source: Budget documents of state governments. | II.6.14 To spur states’ investment in infrastructure and incentivise them for complementary policy action, the Centre has decided to continue with the 50-year interest-free loan to states for one more year with an enhanced allocation of ₹1.3 lakh crore. The entire loan amount will have to be spent in 2023-24. A part of these loans will be contingent on states increasing their actual capital expenditure. A portion of the outlay will also be allocated for scrapping old government vehicles, urban planning reforms and actions, financing reforms in urban local bodies, housing for police personnel, constructing Unity Malls36, libraries and digital infrastructure for children and adolescents, and states’ share of capital expenditure of central schemes. Furthermore, through property tax governance reforms and ring-fencing user charges on urban infrastructure, cities will be incentivised to improve their credit worthiness for municipal bonds. Additionally, an Urban Infrastructure Development Fund (UIDF) will be established through priority sector lending shortfall. The fund will be managed by the National Housing Bank (NHB) and will be used by public agencies to create urban infrastructure in tier 2 and tier 3 cities. 6. General Government Finances II.6.15 The general government deficit and debt moderated to 9.4 per cent and 86.5 per cent of GDP, respectively, in 2022-23 (BE) from the peak levels of 13.1 per cent and 89.4 per cent in 2020-21, respectively (Appendix Table 7). 7. Conclusion II.6.16 While committing to credible fiscal consolidation, the government has led the revival in investment cycle through augmented capital expenditure, recognising its multiplier effects by crowding-in private investment and lifting the economy’s growth potential. Going forward, fiscal consolidation will need to be sustained to rebuild policy buffers and ensure debt sustainability. Continued thrust on digitisation could aid in greater formalisation of the economy and thereby higher tax base, generating the necessary resources to undertake developmental expenditure. II.7 EXTERNAL SECTOR II.7.1 India’s external sector was buffeted by deteriorating global macro-financial conditions following the war in Ukraine that impacted trade and capital flows. Even as domestic economic recovery kept import demand high, a slowdown in global demand weighed on India’s exports. These, together with the adverse net terms of trade shock associated with record high global commodity prices, expanded India’s merchandise trade deficit during the year. Notwithstanding a robust growth in services exports and higher remittance receipts, the widening of merchandise trade deficit and a higher outgo on the primary income account led the current account deficit (CAD) to widen during the year, which peaked in Q2. While net capital inflows dominated by foreign direct investment (FDI) and banking capital supported financing of CAD, significant foreign portfolio outflows during the year necessitated the drawdown of foreign exchange reserves. Valuation losses, primarily due to a large appreciation of the US dollar against non-dollar reserve currencies, constituted a major part of the depletion of foreign exchange reserves during the year. Nonetheless, the external sector stood resilient against global spillovers, with India’s vulnerability indicators faring better than its peer emerging market economies (EMEs). II.7.2 Set against this backdrop, sub-section 2 presents a brief overview of the global economic and financial conditions against which these shifts in external balances occurred. This is followed by a discussion on merchandise trade and invisibles in sub-sections 3 and 4, respectively. Sub-section 5 presents an analysis of capital flows. An assessment of external vulnerability indicators is provided in sub-section 6, followed by concluding observations. 2. Global Economic Conditions II.7.3 With the war in Ukraine continuing longer than initially thought and entering its second year, the global macroeconomic conditions deteriorated during 2022-23. As a result, the IMF revised down its global GDP and trade growth estimates for 2022 in successive rounds between October 2021 and October 2022 (Chart II.7.1a). Global financial conditions tightened, reflecting synchronised monetary policy tightening to contain rising inflation amidst repricing of risks in an atmosphere of global spillovers and country-specific factors, sparking-off scrambles for safe havens and relentless appreciation of the US dollar. Notwithstanding initial fears of an imminent global recession, and possibility of a hard landing, the global economy exhibited resilience, prompting the IMF to revise its global growth estimate upward to 3.4 per cent in January 2023, which remained unchanged thereafter. On similar lines, projection for global trade (goods and services) growth was also revised upward by the IMF to 5.1 per cent in April 2023 from 4.3 per cent in October 2022 (Chart II.7.1b). 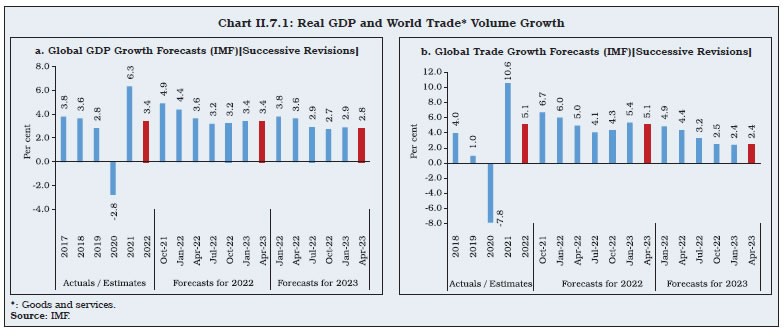
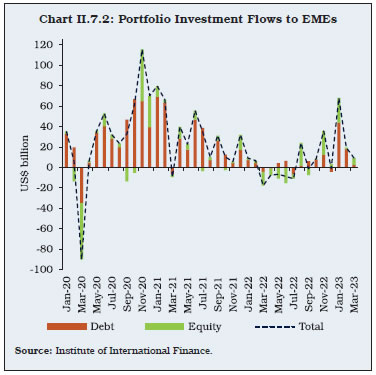 II.7.4 With risk-off sentiment dominating markets, emerging market economies (EMEs) experienced portfolio outflows during the year (Chart II.7.2). World foreign exchange reserves also declined, reflecting the impact of both central bank interventions on the foreign exchange market as also valuation losses on account of the appreciation of the US dollar, the principal reserve currency (Chart II.7.3). 3. Merchandise Trade II.7.5 The global slowdown has dampened India’s merchandise exports. Nevertheless, merchandise exports at US$ 450.4 billion in 2022-23 grew by 6.7 per cent as compared with 44.6 per cent in the previous year. Merchandise imports at US$ 714.0 billion grew at a higher pace of 16.5 per cent during the same period (Table II.7.1). II.7.6 Petroleum products were the major driver of export growth as non-oil exports declined marginally in 2022-23. Among non-oil products, electronic goods, rice, organic and inorganic chemicals, and drugs and pharmaceuticals drove exports whereas engineering goods, cotton yarn/ fabrics, plastic and linoleum, iron ore, and gems and jewellery dragged down the overall export performance (Chart II.7.4). 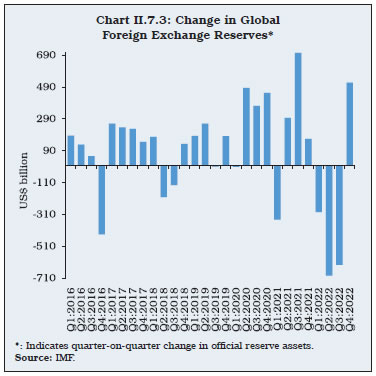
| Table II.7.1: India’s Merchandise Trade | | | Value in US$ Billion | Growth Rate (Y-o-Y) | | 2019-20 | 2020-21 | 2021-22 | 2022-23 | 2019-20 | 2020-21 | 2021-22 | 2022-23 | | 1 | 2 | 3 | 4 | 5 | 6 | 7 | 8 | 9 | | Exports | | Q1 | 80.9 | 51.5 | 95.5 | 121.0 | -1.4 | -36.4 | 85.7 | 26.6 | | Q2 | 78.3 | 74.2 | 102.7 | 110.7 | -3.9 | -5.2 | 38.5 | 7.8 | | Q3 | 79.1 | 75.8 | 106.8 | 104.6 | -1.9 | -4.2 | 41.0 | -2.1 | | Q4 | 75.1 | 90.4 | 117.0 | 114.1 | -12.7 | 20.4 | 29.3 | -2.4 | | Annual | 313.4 | 291.8 | 422.0 | 450.4 | -5.1 | -6.9 | 44.6 | 6.7 | | Imports | | Q1 | 130.1 | 61.3 | 127.0 | 183.5 | 1.1 | -52.9 | 107.2 | 44.5 | | Q2 | 118.0 | 90.7 | 147.5 | 189.0 | -11.3 | -23.1 | 62.7 | 28.1 | | Q3 | 116.1 | 110.8 | 167.0 | 176.1 | -11.2 | -4.6 | 50.7 | 5.4 | | Q4 | 110.5 | 131.7 | 171.6 | 165.4 | -9.2 | 19.1 | 30.3 | -3.6 | | Annual | 474.7 | 394.4 | 613.1 | 714.0 | -7.7 | -16.9 | 55.4 | 16.5 | | Trade Balance | | Q1 | -49.2 | -9.8 | -31.4 | -62.6 | | | | | | Q2 | -39.7 | -16.5 | -44.8 | -78.3 | | | | | | Q3 | -37.0 | -35.1 | -60.2 | -71.5 | | | | | | Q4 | -35.4 | -41.2 | -54.6 | -51.3 | | | | | | Annual | -161.3 | -102.6 | -191.0 | -263.6 | | | | | | Source: DGCI&S and PIB. | II.7.7 Petroleum exports in value terms showed a robust growth of 44.4 per cent during 2022-23 though export volumes contracted marginally by 0.4 per cent, reflecting the gains made by the exporters on the back of elevated international prices (Chart II.7.5a). Refined oil export earnings increased particularly from the European market (Chart II.7.5b). As exports became increasingly remunerative owing to the sharp rise in international crude prices, the government imposed a cess on exports of diesel, petrol, and aviation turbine fuel to ensure sufficient availability domestically, considering the recovery in domestic aggregate demand condition. This has been reviewed fortnightly and as per the latest revision, effective April 19, 2023, there is no export cess on any of the refined products. II.7.8 India’s engineering exports at US$ 107.0 billion contracted by 4.6 per cent during 2022-23, while engineering exports excluding iron and steel recorded a growth of 4.9 per cent (Chart II.7.6a). Commodity-wise, iron and steel (which account for about one-fifth of total engineering exports) plummeted by 41.5 per cent during 2022-23 as a consequence of subdued international demand and imposition of export duty on steel in May 2022, which was removed in November 2022. II.7.9 Major markets for engineering exports from India include the US, China, the UAE, Italy, and Germany. Subdued global demand impacted engineering goods exports from India to some of these countries (Chart II.7.6b). Strong US dollar and the high import content of engineering goods also contributed to the decline.
II.7.10 According to the World Steel Association, global steel demand is expected to increase by 2.3 per cent in 2023 as against a decline of 3.2 per cent in 2022. Demand for steel is expected to grow by 7.3 per cent in India and 2.0 per cent in China, and is expected to fall by 0.4 per cent in the Euro Area and the UK37. The extension of remission of duties and taxes on exported products (RoDTEP) scheme to articles of iron and steel, and also to pharmaceuticals and organic and inorganic chemicals will make these products competitive in the global market. II.7.11 In the face of rising input and logistics costs, organic and inorganic chemical exports grew by 3.3 per cent to US$ 30.3 billion during 2022-23. The Indian chemicals industry has potential to benefit from the China plus one strategy being pursued by industry players. II.7.12 Electronic goods exports at US$ 23.6 billion registered a robust growth of 50.4 per cent during 2022-23. The bulk of this growth was due to the 74.2 per cent increase in exports of telecom instruments during the same period (Chart II.7.7). The production-linked incentive (PLI) scheme for mobile manufacturing has helped relocation of smartphone supply chains to India, enhanced local value addition and attracted global manufacturers to set up facilities. Additionally, an import duty of 22.0 per cent on smartphones and tariffs on other components have been imposed by the government since 2020-21 to promote local manufacturing. 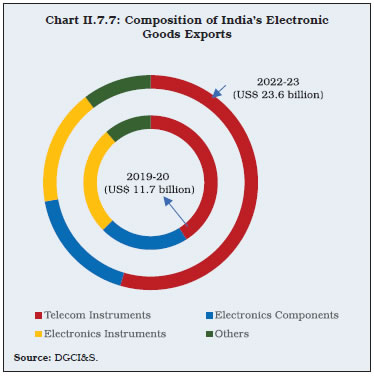
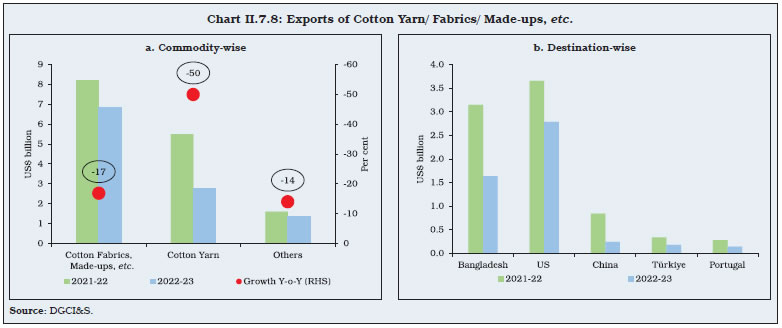 II.7.13 Exports of cotton yarn/fabrics, etc. contracted by 28.4 per cent during 2022-23. Commodity-wise, cotton yarn exports reduced to about half their level a year ago (Chart II.7.8a). Exports of cotton yarn/fabrics, etc. to Bangladesh, which alone constituted 42.0 per cent of cotton yarn exports of India in 2021-22, reduced to almost half in 2022-23. Stronger dollar and lower capacity utilisation amid power crisis and stockpiling of old yarn by textile manufacturers impacted cotton imports into Bangladesh, a net cotton importer. Exports to China also plunged significantly due to COVID-19 lockdowns and weak apparel demand (Chart II.7.8b). Additionally, a duty of 11.0 per cent on imported cotton amid lack of cheaper domestic raw material adversely impacted margins of spinners and manufacturers, leading to a fall in exports of cotton fabrics. II.7.14 With the objective of enhancing India’s trade at the bilateral/regional level, India’s trade agreements with the UAE and Australia came into effect during 2022-23. Negotiations are ongoing for agreements with the UK, the European Union, Canada, and the Gulf Cooperation Council (GCC). During 2022-23, detailed guidelines were also issued to facilitate international trade in the Indian Rupee. To help exporters in dealing with the volatile global economic and geopolitical situation, the foreign trade policy 2015-20 was extended till March 2023 (Box II.7.1). Box II.7.1
India’s Exports in an Adverse Global Environment Two major threats to future of global trade are the increasing geopolitical risks and protectionist policies (IMF, 2023). The increasing global trend towards fragmentation and protectionism have contributed to the rising geopolitical risk and trade policy uncertainty (Caldara and Lacoviello, 2022) [Chart 1]. An analysis of the effect of geopolitical risks and trade policy uncertainties on global trade is performed using a panel of 43 countries for which the indices are available. The following regression for the sample period Q2: 2010 to Q2:2022 is estimated:
Where, Exportit is service/merchandise/computer and business services (CBS) exports38 of country i in quarter t; GPRIit is country-specific quarterly geopolitical risk index of country i in quarter t; and TPUt is quarterly global trade policy uncertainty index. Global GDP and quarter fixed effects are also added as control variables. The results indicate trade policy uncertainty has a significant negative effect on merchandise trade, but strikingly a positive significant effect on overall service trade and also on CBS exports (Table 1). The effect of geopolitical risk index on either of the variables is not statistically significant. The empirical findings from the exercise support the contradictory patterns being observed in India’s export of goods and services. While India’s merchandise exports as per cent of global trade have remained more or less stable over the past decade, its services exports have been rising steadily, driven mostly by CBS exports (Chart 2). Table 1: Effect of Geopolitical and Trade Uncertainty on Exports
(Dependent Variable: Country-level Exports) | | Explanatory Variables | Services Exports Overall | Computer and Business Service Exports | Merchandise Exports | | 1 | 2 | 3 | 4 | | Geopolitical Risk Index (GPRIit) | 0.025 | 0.036 | -0.041 | | (0.042) | (0.029) | (0.034) | | Trade Policy Uncertainty Index (log TPUt) | 0.039** | 0.034** | -0.085*** | | (0.019) | (0.015) | (0.018) | | Global GDP (log Global GDPt) | 0.448** | 1.632*** | 0.922*** | | (0.166) | (0.168) | (0.110) | | Number of observations | 2074 | 1950 | 2107 | ***, **, and * indicate significance at 1 per cent, 5 per cent and 10 per cent level, respectively.
Note: Cluster robust standard errors are given in the parentheses. The model controls for quarter fixed effects and country fixed effects.
Source: RBI staff estimates. | References: 1. Caldara, D., and Lacoviello, M. (2022), ‘Measuring Geopolitical Risk’, American Economic Review, April, 1194-1225. 2. Caldara, D., Lacoviello, M., Molligo, P., Prestipino, A., and Raffo, A. (2020), ‘The Economic Effects of Trade Policy Uncertainty’, Journal of Monetary Economics, Vol.109 3. IMF (2023), ‘Geo-Economic Fragmentation and the Future of Multilateralism’, Staff Discussion Note SDN/2023/001, January, IMF, Washington DC. |
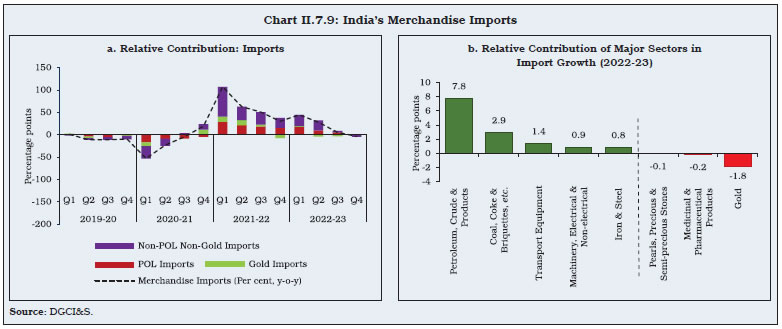 II.7.15 On the import side, India’s merchandise imports at US$ 714.0 billion recorded a growth of 16.5 per cent in 2022-23, witnessing a deceleration in the second half of the year on the back of moderation in commodity prices. At the disaggregated level, petroleum, oil and lubricants (POL) were the major drivers of imports, followed by coal, transport equipment, machinery, and iron and steel. Gold, on the other hand, contributed negatively to import growth (Chart II.7.9). II.7.16 India’s POL imports constituted the largest item in India’s import basket, accounting for 29.3 per cent of the overall imports in 2022-23. POL imports grew by 29.4 per cent in value terms and by 7.0 per cent in volume terms, reflecting the impact of higher prices (Chart II.7.10a). II.7.17 In 2022-23, there was a change in the sources of India’s crude imports. Russia’s share in India’s crude imports soared to 19.1 per cent from 2.0 per cent a year ago (Chart II.7.10b). II.7.18 Gold imports at US$ 35.0 billion declined by 24.2 per cent in 2022-23. To dampen demand and ease pressure on trade deficit, India raised the basic import duty on gold to 12.5 per cent from 7.5 per cent in July 2022, which was subsequently brought down to 10 per cent in February 2023. Further, as per the World Gold Council, retail demand is expected to face headwinds due to higher gold price. II.7.19 Coal imports in value terms surged 57.1 per cent in 2022-23, driven by elevated international prices and high demand for non-coking coal from the power sector. In the wake of a severe shortage due to rising power demand, the government mandated power plants to import 10.0 per cent of their coal requirement and blend it with domestic supply in May 2022. This emergency order was rolled back in August as domestic coal supply position improved. India imported coal primarily from Australia, Indonesia, Russia, the US and South Africa in 2022-23 (Chart II.7.11). II.7.20 India’s fertiliser imports, which account for around one-third of the annual domestic fertiliser consumption, grew in value terms by 21.4 per cent to reach US$ 17.2 billion in 2022-23. Complex fertilisers [e.g., Diammonium phosphate (DAP)], with a share of 46.6 per cent, contributed the most to the increase in fertiliser imports (Chart II.7.12). To ensure stable supplies and reduce exposure to market volatility, India has signed long-term agreements for fertiliser imports and is seeking investment from global companies as a long-term strategy. Further, to reduce India’s dependence on urea imports, the government is promoting the use of nano urea among farmers as an alternative to commercial urea. 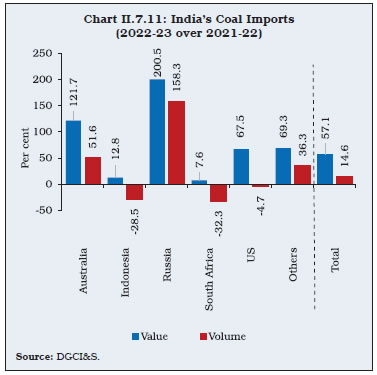 II.7.21 India is the largest importer of vegetable oil globally. With rising international edible oil prices, India’s import bill on vegetable oil rose to US$ 20.8 billion in 2022-23 from US$ 19.0 billion in the previous year. Composition-wise, palm oil has the largest share, accounting for about 63 per cent of total edible oil imports to India. According to the Solvent Extractors’ Association of India (SEA), India’s imports of edible oil in volume terms during the Oil Year so far (November 2022 to March 2023) was 70.6 lakh tonne, an increase of 22.0 per cent over the corresponding period of previous year. II.7.22 Electronic goods are the second largest import item in India’s import basket with a share of 10.8 per cent in 2022-23. Imports stood at US$ 77.3 billion growing by 4.9 per cent over the previous year. Over the past decade, the composition of electronic goods imports has shifted towards electronic components, which accounted for 32.5 per cent of total electronic goods imports in 2022-23 (Chart II.7.13a). After peaking at 41.3 per cent in 2017-18, the share of telecom instruments fell to 21.2 per cent in 2022-23, as domestic manufacturing increased aided by government’s initiatives to boost electronics manufacturing in India, reduce import dependence and boost exports39. China remains the largest source of import of electronic goods across all components (Chart II.7.13b). 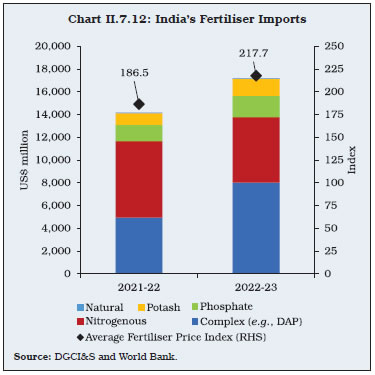
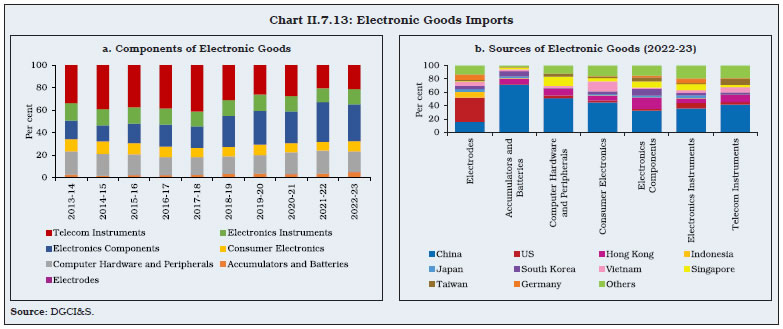 II.7.23 As imports grew faster than exports, trade deficit stood at US$ 263.6 billion in 2022-23, about 38.0 per cent higher than its level in the previous year. Oil deficit accounted for 42.5 per cent of the total deficit (Chart II.7.14a). On a bilateral basis, the deficit with major partner countries widened (Chart II.7.14b). 4. Invisibles II.7.24 Net receipts from invisibles, reflecting cross-border transactions in services, income and transfers, displayed resilience during April-December 2022. While demand for software and business services exports, which account for around 70.0 per cent of India’s services exports, surged sequentially during the year as well as over the previous year (Chart II.7.15), remittance receipts also remained strong. Meanwhile, net outgo on the primary income account increased during the year following a rise in net investment income outflows. II.7.25 After a significant recovery in 2021-22, global services trade in major services exporting economies displayed some weakening during 2022-23, barring the US and India (Chart II.7.16). In 2022, value of global commercial services trade grew by 15.0 per cent y-o-y (17.0 per cent in 2021), which was broad-based across sectors and regions, including North America, Europe and Asia. As per the forecasts on global information technology (IT) spending provided by Gartner, IT spending is expected to witness an increase to US$ 4.6 trillion in 2023 from US$ 4.4 trillion in 2022, which augurs well for India’s services exports going forward. Nonetheless, downside risks remain owing to recessionary fears primarily in the US and the EU, which are the key destinations for India’s services exports. 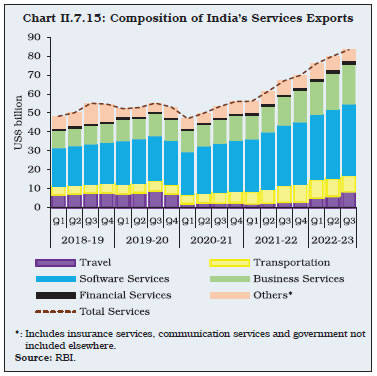
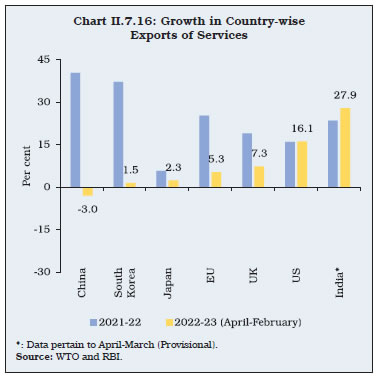 II.7.26 A rise in travel and transportation receipts alongside growth in computer, business and information services exports provided resilience to services exports globally in 2022 (Charts II.7.17a and II.7.17b). With the easing of pandemic-related restrictions on mobility, world transport and travel services rose by 25.0 per cent and 79.0 per cent, y-o-y, respectively, in 2022. II.7.27 After recovering fully to pre-pandemic levels by H1:2021-22, inward remittances to India recorded a sequential rise and stood at US$ 83.8 billion during April-December 2022, with US$ 30.8 billion during Q3:2022-23 (Chart II.7.18a). In 2022, India’s inward remittance receipts increased to US$ 107.5 billion from US$ 86.3 billion in 2021 (Chart II.7.18b). The rise in India’s remittances was driven by a host of factors, including elevated crude oil prices, fiscal stimulus packages benefitting Indian migrants in the advanced economies (AEs) and post-pandemic wage hikes. Moreover, the rollover of vaccinations and easing of travel restrictions helped Indian migrants in the middle-east to return to their workplaces and resume work in 2022, which also positively impacted remittance flows to India. The World Bank estimates that the average cost of sending remittances of US$ 200 to India declined from 5.5 per cent in Q4:2020 (highest since Q1:2019) to 4.7 per cent in Q3:2022. 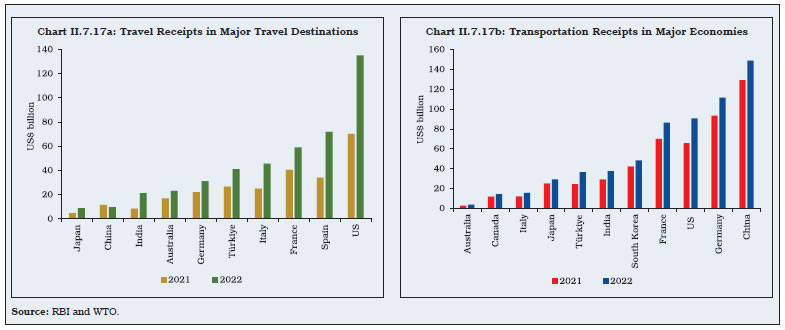 II.7.28 Under the income account, which relates to the income on cross-border investments and compensation of employees that domestic resident entities earn from (or pay to) the rest of the world, receipts rose during April-December 2022. However, payments were significantly higher than a year ago.
II.7.29 The widening of merchandise trade deficit and the rise in net outgo in the primary income account drove the sequential rise in India’s CAD from Q1:2022-23 to Q2:2022-23, before moderating in Q3. During April-December 2022, CAD stood at 2.7 per cent, higher than 1.1 per cent a year ago (Chart II.7.19a). Negative net terms of trade owing to elevated crude oil prices and the widening of the trade deficit on account of a deceleration in exports led by a slowdown in growth in India’s trading partners and higher imports owing to strong domestic demand recovery mainly contributed to the higher CAD during the year so far (Chart II.7.19b). 5. External Financing II.7.30 In April-December 2022, given the rise in India’s CAD, external financing needs went up significantly. Among the major components of financial flows, net FDI remained strong, while foreign portfolio investment (FPI) witnessed significant volatility during the year. Moreover, while loans in the form of trade credit and banking capital recorded net inflows during April-December 2022, external commercial borrowings (ECBs) recorded net outflows. Owing to the significant stress in the financial account, there was a depletion of US$ 14.7 billion from the foreign exchange reserves on a balance of payments (BoP) basis (excluding valuation changes) during April-December 2022 (Chart II.7.20 and Appendix Table 8).
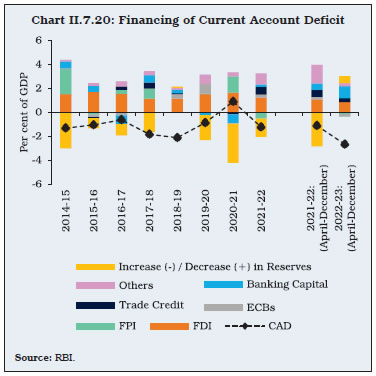
| Table II.7.2: Foreign Direct Investment Flows | | (US$ billion) | | | 2019-20 | 2020-21 | 2021-22 | 2022-23 | | 1 | 2 | 3 | 4 | 5 | | 1. Net FDI (1.1 - 1.2) | 43.0 | 44.0 | 38.6 | 28.0 | | 1.1 Net Inward FDI (1.1.1 - 1.1.2) | 56.0 | 54.9 | 56.2 | 41.6 | | 1.1.1 Gross Inflows | 74.4 | 82.0 | 84.8 | 71.0 | | 1.1.2 Repatriation/ Disinvestment | 18.4 | 27.0 | 28.6 | 29.3 | | 1.2 Net Outward FDI | 13.0 | 11.0 | 17.6 | 13.6 | | Source: RBI. | II.7.31 Within capital flows, net FDI (i.e., net inward minus net outward) remained strong during 2022-23 at US$ 28.0 billion (US$ 38.6 billion a year ago). During this period, while repatriation/disinvestment of FDI in India rose, outward FDI by India registered a decline (Table II.7.2). According to the UNCTAD’s World Investment Report (June 2022), India was the 7th largest recipient of FDI in 2021 (8th in 2020). Various government initiatives, viz., PM Gati Shakti, further enhancement of PLI scheme and a strong push for a transition to green energy, are expected to attract more FDI from foreign companies. During 2022-23, the top FDI source countries were Singapore, Mauritius, the US, the UAE and the Netherlands, contributing 76.5 per cent of total FDI equity (Chart II.7.21). Sector-wise composition indicates that the services sector, including financial services, computer services, communication services and business services, accounted for a major share of FDI equity in India during this period, followed by manufacturing, retail and wholesale trade, electricity and other energy, and education, research and development (Appendix Table 9). II.7.32 Outward FDI from India recorded a decline of 22.9 per cent during 2022-23 on a y-o-y basis. The UK, Singapore, the US, the UAE, and Mauritius were the major destinations of outward FDI from India. Financial, insurance and business services, manufacturing, wholesale and retail trade, and restaurants and hotels were the major sectors attracting India’s overseas direct investment during this period. II.7.33 As a result of monetary tightening by advanced economies to control high inflation, net foreign portfolio investments (FPI) in major EMEs, including India, recorded outflows in 2022-23. However, after being net sellers in Q1:2022-23, FPIs turned net purchasers in domestic markets, particularly in equities, since July 2022 (Chart II.7.22). II.7.34 FPI inflows in the equity market were primarily recorded in the financial services, automobile, consumer durables, chemicals and construction material sectors (Chart II.7.23). The investment limits for FPIs in debt market remained underutilised during 2022-23. As at end-March 2023, only 18.9 per cent of the limits (general route) in central government securities were utilised (26.3 per cent as at end-March 2022), while the utilisation rate for state government securities (SGSs) remained abysmally low at below one per cent. Of the total value of specified categories of central government securities opened fully for non-resident investors without any restrictions under the fully accessible route (FAR), 2.7 per cent was held by FPIs as at end-March 2023 (2.6 per cent as at end-March 2022). In the corporate bond segment, FPIs’ interest remained subdued, inter alia, due to rise in yields in the US (Box II.7.2). Only 15.5 per cent of the limit for FPIs in corporate bonds (in absolute terms) was utilised as at end-March 2023, down from 19.9 per cent as at end-March 2022. 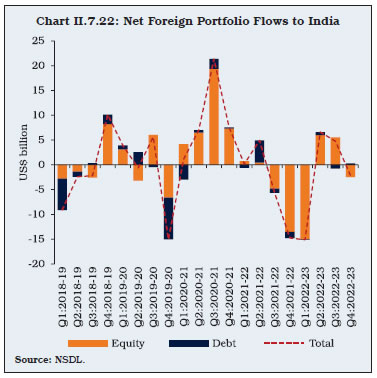
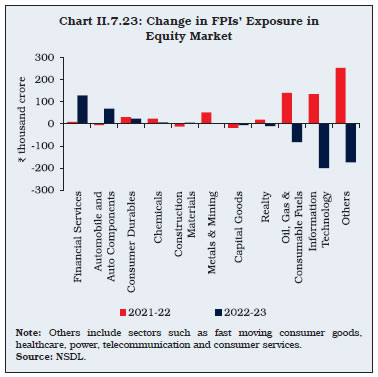
Box II.7.2
Interest Rate Sensitivity of Capital Flows: The Indian Experience Monetary policy changes in the US have been one of the key determinants of capital flows to EMEs (Koepke, 2019). The impact, however, varies across EMEs depending on their domestic macroeconomic policies, level of external debt, fiscal deficit and reserves. Though theoretically interest rate differential remains a key determinant of capital flows, in practice, the empirical findings tend to vary. Against this backdrop, an empirical analysis of the interest rate sensitivity of various components of India’s gross capital inflows is conducted, covering quarterly data from Q2:1999 to Q2:2022. Gross capital inflows, instead of net flows, have been used for the analysis as a country’s net position may often not be a reliable indicator of its financial vulnerabilities. In order to detect the sensitivity of gross capital inflows to interest rate differential (IRD), vector autoregression (VAR) models are estimated following Verma and Prakash (2011), and employing exogenous variables such as changes in INR-USD nominal exchange rate, domestic real GDP growth, and global GDP growth proxied by OECD GDP growth. Further, in examining the impact of IRD on various components of capital flows – foreign portfolio investment (FPI), short-term trade credit (STC), external commercial borrowings (ECB), banking capital (BC) flows and foreign direct investment (FDI) – appropriate proxies for IRD have been employed.40 Causality from IRD to various components of capital flows was found to be statistically significant as per Granger causality tests based on the VAR framework (Table 1).41 | Table 1: Causal Relationship between Change in Interest Rate Differential and Change in Gross Capital Inflows | | Null Hypothesis | Sample Period | Chi-sq | Probability | | IRD does not Granger Cause FPI | 2010Q4-2022Q2 | 4.89 | 0.09 | | FPI does not Granger Cause IRD | 2010Q4-2022Q2 | 1.47 | 0.48 | | IRD does not Granger Cause STC | 2010Q4-2022Q2 | 6.72 | 0.03 | | STC does not Granger Cause IRD | 2010Q4-2022Q2 | 0.34 | 0.84 | | IRD does not Granger Cause ECB | 1999Q2-2022Q2 | 7.09 | 0.03 | | ECB does not Granger Cause IRD | 1999Q2-2022Q2 | 2.71 | 0.26 | | IRD does not Granger Cause BC | 1999Q2-2022Q2 | 10.62 | 0.00 | | BC does not Granger Cause IRD | 1999Q2-2022Q2 | 1.42 | 0.49 | | IRD does not Granger Cause FDI | 1999Q2-2022Q2 | 0.65 | 0.72 | | FDI does not Granger Cause IRD | 1999Q2-2022Q2 | 5.51 | 0.06 | | Source: RBI staff estimates. | 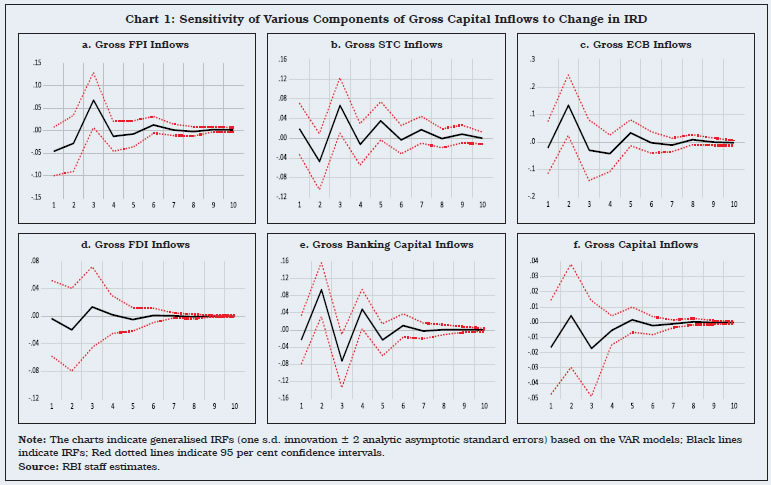 The generalised impulse response functions (IRFs) from the VAR models indicate: (i) a positive relationship between change in IRD and growth in gross FPI, STC, ECB and banking capital inflows with a lag of 1-2 quarters (Chart 1); (ii) a one standard deviation (s.d.) shock to change in IRD raises the growth in gross FPI inflows by 0.07 per cent, gross STC inflows by 0.07 per cent, gross ECB inflows by 0.13 per cent, and gross banking capital inflows by 0.09 per cent; (iii) gross FDI inflows do not seem to be sensitive to IRD; and (iv) a change in IRD does not seem to have a statistically significant impact on gross capital inflows at an aggregate level. To sum up, the analysis indicates that interest rate differential is an important factor in influencing portfolio, trade financing, banking capital and ECB flows, but not the overall gross capital inflows to India. References: 1. Koepke, R. (2019), ‘What Drives Capital Flows to Emerging Markets? A Survey of the Empirical Literature’, Journal of Economic Surveys, 33(2), 516-540. 2. Verma, R., and Prakash, A. (2011), ‘Sensitivity of Capital Flows to Interest Rate Differentials: An Empirical Assessment for India’, Reserve Bank of India Working Paper Series, May 2011. | II.7.35 ECBs recorded a fall in terms of the number of ECB agreements as well as amount during 2022-23 as compared with a year ago. Moreover, net external commercial borrowings to India recorded an outflow of US$ 5.0 billion in 2022-23 as against an inflow of US$ 7.4 billion a year ago (Chart II.7.24). On July 6, 2022, under the measures to liberalise forex flows to India introduced by the Reserve Bank, the borrowing limit under the ECB automatic route was raised from US$ 750 million or its equivalent per financial year to US$ 1.5 billion. Further, the all-in-cost ceiling under the ECB framework was also raised by 100 basis points, subject to the borrower being of investment grade rating. These measures were effective till December 31, 2022. II.7.36 ECB disbursements were largely used for on-lending/sub-lending, new projects, refinancing of earlier ECBs, import of capital goods, and rupee expenditure for local capital goods (Chart II.7.25). Within ECBs, rupee-denominated loans and rupee-denominated bonds (RDBs) accounted for 8.0 per cent of the total agreement amount during 2022-23 as compared with 8.4 per cent a year ago. Furthermore, the share of hedged foreign exchange loans stood at 49.3 per cent during the year, higher than 51.6 per cent during 2021-22. II.7.37 The net inflow of short-term trade credit stood at US$ 8.1 billion during April-December 2022 as compared with a net inflow of US$ 13.3 billion a year ago. Around 36.0 per cent of the trade credit was raised for imports of crude oil, gold, coal and copper. II.7.38 Non-Resident (External) Rupee (NRE) deposits, which constituted 69.2 per cent of the total outstanding non-resident deposits, witnessed net inflows of US$ 2.1 billion during 2022-23, lower than US$ 3.3 billion a year ago (Table II.7.3). Net inflows in the Foreign Currency Non-Resident (Bank) [FCNR(B)] accounts stood at US$ 2.4 billion against net redemptions to the tune of US$ 3.6 billion a year ago. Furthermore, Non-Resident Ordinary (NRO) accounts also registered robust net inflows during the year. On the whole, non-resident accounts registered higher accretions to the tune of US$ 8.0 billion during 2022-23 as compared with US$ 3.2 billion a year ago. Furthermore, the capital flow measures adopted by the Reserve Bank on July 6, 2022 with regard to the non-resident accounts relating to the deregulation of interest rates and exemption from cash reserve ratio (CRR) and statutory liquidity ratio (SLR) maintenance on the FCNR(B) and NRE accounts also aided in the higher net inflows to these accounts. 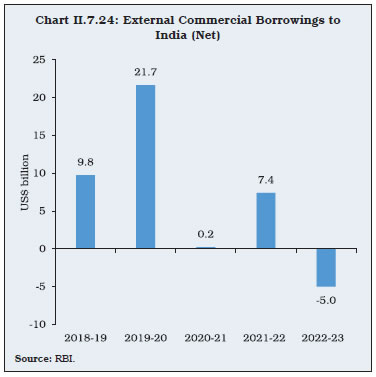
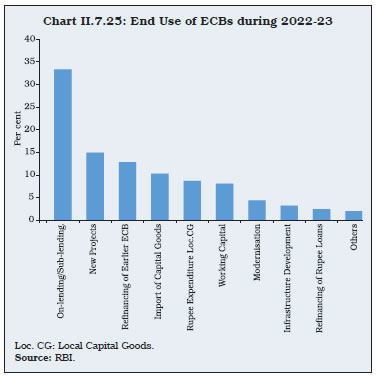 6. Vulnerability Indicators II.7.39 India’s external debt recorded a decline of US$ 6.0 billion (i.e., 1.0 per cent) at end-December 2022 over end-March 2022; as a ratio to GDP, it moderated to 19.1 per cent from 20.0 per cent during the same period (Table II.7.4). India’s external debt (as a ratio to GDP) also remained lower than most emerging market peers. Commercial borrowings remained the largest component of external debt, with a share of 35.4 per cent, followed by non-resident deposits (21.9 per cent) and short-term trade credit (20.5 per cent). Sector-wise composition of external debt indicates that non-financial corporations were the largest category of borrowers with a share of 41.1 per cent, followed by deposit-taking corporations, except the central bank (25.1 per cent) and general government (21.0 per cent). Foreign exchange reserves in India also provided a buffer for mitigating external risks and spillovers. At the end of December 2022, foreign exchange reserves were more than two times that of short-term external debt on residual maturity basis and provided cover of 9.4 months of imports projected for 2022-23. | Table II.7.3: Flows under Non-Resident Deposit Accounts | | (US$ billion) | | | 2019-20 | 2020-21 | 2021-22 | 2022-23 | | 1 | 2 | 3 | 4 | 5 | | 1. Non-Resident External (Rupee) Account | 5.6 | 8.8 | 3.3 | 2.1 | | 2. Non-Resident Ordinary Account | 2.0 | 2.3 | 3.5 | 3.4 | | 3. Foreign Currency Non-Resident(B) Account | 1.1 | -3.8 | -3.6 | 2.4 | | Non-Resident Deposits (1+2+3) | 8.6 | 7.4 | 3.2 | 8.0 | | Source: RBI. |
| Table II.7.4: External Vulnerability Indicators (End-March) | | (Per cent, unless indicated otherwise) | | Indicator | 2013 | 2021 | 2022 | End-December 2022 | | 1 | 2 | 3 | 4 | 5 | | 1. External Debt to GDP Ratio | 22.4 | 21.2 | 20.0 | 19.1 | | 2. Ratio of Short-term Debt (Original Maturity) to Total Debt | 23.6 | 17.6 | 19.7 | 21.1 | | 3. Ratio of Short-term Debt (Residual Maturity) to Total Debt | 42.1 | 44.1 | 43.2 | 44.5 | | 4. Ratio of Concessional Debt to Total Debt | 11.1 | 9.0 | 8.3 | 8.1 | | 5. Ratio of Reserves to Total Debt | 71.3 | 100.6 | 98.1 | 91.8 | | 6. Ratio of Short-term Debt (Original Maturity) to Reserves | 33.1 | 17.5 | 20.0 | 23.0 | | 7. Ratio of Short-term Debt (Residual Maturity) to Reserves | 59.0 | 43.8 | 44.0 | 48.5 | | 8. Reserve Cover of Imports (in Months)* | 7.0 | 17.4 | 11.8 | 9.3 | | 9. Debt Service Ratio (Debt Service to Current Receipts) | 5.9 | 8.2 | 5.2 | 5.3 | | 10. External Debt (US$ billion) | 409.4 | 573.7 | 619.1 | 613.1 | | 11. Net International Investment Position (NIIP) [US$ billion] | -326.7 | -355.1 | -358.3 | -374.5 | | 12. NIIP/GDP Ratio | -17.8 | -13.2 | -11.7 | -11.8 | | 13. CAB/GDP Ratio# | -4.8 | 0.9 | -1.2 | -2.7 | *: Based on merchandise imports of latest four quarters, published in BoP statistics.
#: CAB/GDP ratio in column 5 pertains to April-December 2022.
Source: RBI and Government of India. | II.7.40 India’s foreign exchange reserves at US$ 578.4 billion as at end-March 2023, registered a decline of US$ 28.9 billion since end-March 2022, of which US$ 19.7 billion decline was due to valuation changes. 7. Conclusion II.7.41 Notwithstanding the market concerns in the first half of the year about a widening CAD in an environment of risk-off sentiment depressing capital inflows, India’s CAD remained within sustainable level after peaking in Q2, and the exchange rate movement was orderly. External vulnerability indicators exhibited resilience and strengthening domestic macroeconomic fundamentals helped the economy withstand spillovers from adverse global macro-financial shocks. Significant downside risks to India’s external sector, however, persist from the likely slowing of growth in major advanced economies and EMEs, particularly in India’s key trading partners, still elevated energy prices, future stance of monetary policy by the US Fed and supply-side disruptions in a conflict-ridden geopolitical environment.
|