The Reserve Bank successfully achieved the objectives of the debt management by ensuring that the government’s financing needs and its payment obligations were met at the lowest possible cost. Notwithstanding the multiple challenges emanating from the glide path for reduction in Held to Maturity (HTM) category of banks’ investment portfolio and Statutory Liquidity Ratio (SLR), the Reserve Bank managed the borrowing requirements of the central and the state governments for 2017-18 within the overall contours of the debt management strategy of low cost, risk mitigation and market development while factoring in domestic and global economic and financial conditions. On the macroeconomic front, the tilting risks to inflation, pressure emanating from the fiscal slippages, event-specific announcements, viz., farm loan waivers coupled with global factors such as the increasing crude oil prices and the monetary policy normalisation in major economies were the pre-dominant factors that impacted the yields. VII.1 The Internal Debt Management Department (IDMD) of the Reserve Bank manages the domestic debt of the central government by statute, vide Sections 20 and 21 of the RBI Act, 1934, and that of 29 state governments and the Union Territory of Puducherry in accordance with bilateral agreements as provided in Section 21A of the said Act. Further, short-term credit is provided up to three months to both central and state governments in the form of Ways and Means Advances (WMA) to bridge temporary mismatch in their cash flows, as laid down in terms of Section 17(5) of the RBI Act, 1934. Agenda for 2017-18: Implementation Status VII.2 The borrowing programme was conducted within the overall contour of the debt management strategy outlined by low cost, risk mitigation and market development, while also factoring in domestic and global economic conditions. Notwithstanding the challenges posed by the glide path for reduction in securities maintained in HTM category and for SLR requirements of the banks, the Reserve Bank successfully managed the market borrowing programme of the central government and state governments in 2017-18. On the macroeconomic front, the tilting risks to inflation, pressure emanating from the fiscal slippages, event-specific announcements, viz., farm loan waivers and global factors such as increasing crude oil prices and monetary policy normalisation of the major economies were the major factors that impacted the yields. The combined gross market borrowings of central and state governments during 2017-18 increased by 4.5 per cent over the previous year to ₹ 10,071 billion. VII.3 Following the strategy of consolidation and increase in the issuance limit per security, during 2017-18, 156 out of 159 issuances of the Government of India (GoI) securities were re-issuances, whereas during 2016-17, 156 were reissued out of the total 164 issuances. In continuation of the foregoing objective, the strategy of front-loading of issuances1 continued to be followed in 2017-18 to even out the borrowing pressures throughout the year. Active consolidation of debt was undertaken in the form of buyback/switches (₹ 415.55 billion/₹ 580.75 billion) that spread across 2017-18, totalling ₹ 996.30 billion as compared to ₹ 1,046.43 billion in the previous year. Further, with a view to improving flexibility in borrowing, the GoI introduced the greenshoe option of up to ₹ 10 billion in September 2017 within each maturity bucket such that the aggregate amount accepted in the auction does not exceed the total notified amount. The share of Floating Rate Bonds (FRBs) in total issuances during 2017-18 stood at 10.2 per cent. VII.4 Reflecting the strategy of maturity elongation, the weighted average maturity (WAM) of primary issuance of government securities (G-sec) was at 14.13 years during 2017-18. This was, however, lower than 14.76 years for the previous year, as the government decided to borrow more in the maturity buckets of under 15 years to contain cost of borrowings in the volatile market conditions. The rollover risk for GoI dated securities continued to be low as the WAM of outstanding dated securities remained at 10.62 years in 2017-18, marginally lower than 10.65 years recorded in the previous year, reflecting higher issuances in the lower maturity buckets especially in the last quarter of 2017-18. Following the strategy of diversification of investor base for G-sec and in line with the fourth bi-monthly monetary policy statement on October 4, 2017, specified stock exchanges were permitted to act as aggregators/ facilitators for submitting retail investor bids, in non-competitive segments of G-sec and T-Bill primary auctions. In order to make the Sovereign Gold Bond (SGB) Scheme further appealing to investors, a new pattern of weekly issuances was introduced on October 6, 2017. Along with the calendar of issuances, the scheme was available for weekly subscription up to December 27, 2017. Effective management of cash flows is critical for planning the market borrowings of the states. In order to assist the states in this regard, a study on best practices was presented in the 30th State Finance Secretaries (SFS) Conference. The draft recommendations of the Working Group on Monitoring and Reporting of Contingent Liabilities (CLs) of State Governments were also deliberated in the SFS conference, covering aspects relating to better management, monitoring and reporting of CLs by state governments. Further, efforts to sensitise the state governments on cash and debt management continued with capacity building programmes held for five state governments during 2017-18. Debt Management of the Central Government VII.5 The Union Budget 2017-18 had estimated gross market borrowing through dated G-sec at ₹ 5,800 billion. The actual gross market borrowings through dated G-sec in 2017-18 amounted to ₹ 5,880 billion on account of additional market borrowings by the GoI in Q3. Net borrowings through dated securities amounted to ₹ 4,484 billion, financing 75.3 per cent of the gross fiscal deficit (GFD) as against 76.2 per cent in the previous year. The gross market borrowing through the GoI dated securities during 2017-18 increased by 1.0 per cent while the net market borrowings increased by 9.8 per cent during the same period, on account of lesser repayments during the year (₹ 1,395.90 billion in 2017-18 against ₹ 1,738.02 billion in 2016-17). The net market borrowing of the central government through dated securities and T-Bills increased by ₹ 1,206 billion to ₹ 4,989 billion in 2017-18 (Table VII.1). | Table VII.1: Net Market Borrowings of the Central Government | | (₹ billion) | | Item | 2015-16 | 2016-17 | 2017-18 | 2018-19* | | 1 | 2 | 3 | 4 | 5 | | Net Borrowings | 4,559 | 3,783 | 4,989 | 1621 | | i. Dated Securities | 4,406 | 4,082 | 4,484 | 606 | | ii. 91-day T-Bills | 39 | -260 | 319 | 377 | | iii. 182-day T-Bills | 5 | 76 | 14 | 455 | | iv. 364-day T-Bills | 109 | -115 | 172 | 183 | *: Up to June 30, 2018.
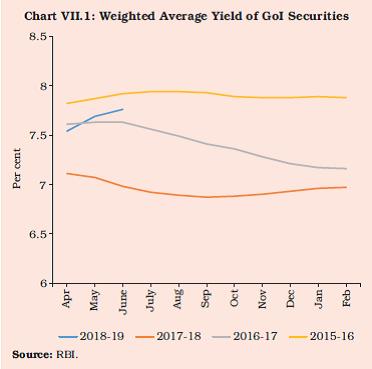
Source: RBI. | Debt Management Operations VII.6 Notwithstanding the volatility in the bond market conditions, the weighted average yield (WAY) for GoI dated securities issued during 2017-18 declined by 19 bps to 6.97 per cent from 7.16 per cent in 2016-17 (Chart VII.1). This helped bring down the weighted average cost of borrowings on the outstanding debt stock by 23 bps to 7.76 per cent in 2017-18. Following the decision of GoI not to borrow in the tenors above 15 years in the last quarter of the year, the WAM of issuances during 2017-18 slid to 14.13 years (14.76 years in 2016-17). Consequently, WAM on the outstanding debt decreased marginally to 10.62 years in 2017-18 from 10.65 years in 2016-17 (Table VII.2). VII.7 Among the factors driving the G-sec yields, the domestic factors outweighed the global factors in 2017-18. During most part of H1, the G-sec yields reflected a softening trajectory mainly driven by lower inflation, sustained demand from Foreign Portfolio Investors (FPIs) and a 25 bps cut in the policy repo rate in August 2017. The G-sec yields, however, hardened in Q3, mostly led by domestic factors, viz., informal communication by the government on higher GFD, increase in inflation forecast by the Monetary Policy Committee (MPC) and concerns over increase in supply of government paper in the form of bank recapitalisation bonds. Further, the announcement on December 27, 2017 that the fiscal slippages would be funded by additional market borrowings led to hardening of G-sec yields. Among global factors, the rising crude oil prices and an increase in the US Fed fund rate further impacted the G-sec yields. In Q4, notwithstanding the announcement of reduction in additional borrowings by the GoI, the upward pressure on yields resumed on the back of elevated crude oil prices and spillovers from global bond sell-off, accentuated by fears of oversupply of domestic government paper. Yields, however, softened considerably by end-March 2018 due to lower inflation print for February 2018 and the decision by the GoI not to front-load its borrowings in H1 of 2018-19. | Table VII.2: Market Loans of Central Government - A Profile* | | (Yield in per cent/Maturity in years) | | Years | Range of YTMs in Primary Issues | Issued during the Year | Outstanding Stock | | Under 5 years | 5-10 years | Over 10 years | Weighted Average Yield | Range of Maturities@ | Weighted Average Maturity | Weighted Average Maturity | Weighted Average Coupon | | 1 | 2 | 3 | 4 | 5 | 6 | 7 | 8 | 9 | | 2013-14 | 7.22-9.00 | 7.16-9.40 | 7.36-9.40 | 8.41 | 6-30 | 14.23 | 10.00 | 7.98 | | 2014-15 | - | 7.66-9.28 | 7.65-9.42 | 8.51 | 6-30 | 14.66 | 10.23 | 8.08 | | 2015-16 | - | 7.54-8.10 | 7.59-8.27 | 7.89 | 6-40 | 16.03 | 10.50 | 8.08 | | 2016-17 | 6.85-7.46 | 6.13-7.61 | 6.46-7.87 | 7.16 | 5-38 | 14.76 | 10.65 | 7.99 | | 2017-18 | 7.23-7.27 | 6.42-7.48 | 6.68-7.67 | 6.97 | 5-38 | 14.13 | 10.62 | 7.76 | | 2018-19** | 6.65-8.01 | 6.84-8.14 | 7.33-8.15 | 7.76 | 2-37 | 15.04 | 10.64 | 7.74 | *: Excluding buyback/switch in GoI securities and special securities.
**: Up to June 30, 2018.
@: Residual maturity of issuances.
Note: YTM: Yield To Maturity.
Source: RBI. |
 VII.8 During 2017-18, about 53.6 per cent of the market borrowings were raised through issuance of dated securities with a residual maturity of over 10 years as compared with 58.8 per cent in the previous year, which led to an increase in the share of securities with maturity under 10 years. To cater to the demand of long-term investors like insurance companies and pension funds, 29-year and 33-year tenor bonds were reissued during the year (Table VII.3). Issuance of Special GoI Securities VII.9 Issuance of Special GoI Securities (Non-Transferable) to the identified 20 public sector banks (PSBs) for a total amount of ₹ 800 billion, towards recapitalisation, was undertaken on March 27, 2018. The transaction was cash neutral, reflecting recapitalistion of PSBs and simultaneous investment by PSBs in the special securities issued to them by the GoI. Ownership of Securities VII.10 Commercial banks remained the largest holders of dated securities, accounting for 41.4 per cent as at end-June 2018, followed by insurance companies and provident funds holding 24.2 per cent and 5.8 per cent, respectively. The share of the Reserve Bank’s holding stood at 11.6 per cent while FPIs held 3.8 per cent. The other holders included the co-operative banks, mutual funds, financial institutions and corporates. | Table VII.3: Issuance of Government of India Dated Securities - Maturity Pattern | | (Amount in ₹ billion) | | Residual Maturity | 2016-17 | 2017-18 | 2018-19* | | Amount Raised | Percentage to total | Amount Raised | Percentage to total | Amount Raised | Percentage to total | | 1 | 2 | 3 | 4 | 5 | 6 | 7 | | Less than 5 years | 180 | 3.1 | 90 | 1.5 | 230 | 17.4 | | 5 -9.99 years | 2,220 | 38.1 | 2,640 | 44.9 | 400 | 30.3 | | 10-15.99 years | 1,710 | 29.4 | 1,600 | 27.2 | 280 | 21.2 | | 16 -19.99 years | 820 | 14.1 | 690 | 11.7 | 90 | 6.8 | | 20 years & above | 890 | 15.3 | 860 | 14.6 | 320 | 24.2 | | Total | 5,820 | 100 | 5,880 | 100 | 1,320 | 100 | *: Up to June 30, 2018.
Note: Figures in the columns might not add up to the total due to rounding off of numbers.
Source: RBI. | Primary Dealers and Devolvement VII.11 The share of primary dealers (PDs) in the subscription to primary auctions of central government securities stood at 53.7 per cent in 2017-18 as compared to 47.6 per cent in 2016-17. The underwriting commission paid to PDs during 2017-18 increased to ₹ 0.61 billion as compared to ₹ 0.36 billion during the previous year, mainly on account of volatile bond market conditions. There were three instances of devolvement in four central government securities on PDs for an amount of ₹ 102.97 billion as compared to four instances for ₹ 53 billion in 2016-17. All the PDs maintained capital to risk-weighted assets ratio (CRAR) above the minimum requirement of 15 per cent. In order to facilitate the Standalone Primary Dealers (SPDs) in providing comprehensive services to their FPI clients, it has been decided in the second bi-monthly monetary policy for 2018-19 to provide the SPDs a limited foreign exchange license. Sovereign Gold Bond Scheme VII.12 The SGB scheme launched by the GoI in November 2015 was improved upon further in 2017-18 for ease of access of investment and to widen the investor base. A series of weekly issuance of SGBs was introduced on October 6, 2017 and the maximum subscription limit for individuals and Hindu Undivided Families (HUFs) per fiscal year was raised to 4 kg and for Trusts to 20 kg. SGBs were issued at ₹ 50 per gram less than the nominal value for investors applying online and paying through digital mode. The Reserve Bank, in consultation with the GoI, issued 14 tranches of SGBs for an aggregate amount of ₹ 18.95 billion (6.52 ton) during 2017-18 as compared to ₹ 34.69 billion (11.44 ton) in 2016-17, reflecting low investor appetite. A total of ₹ 68.96 billion (23.53 ton) has been raised through the scheme since its inception until June 30, 2018. Debt Management Strategy VII.13 The government’s borrowing programmes are planned and executed in terms of the debt management strategy (DMS). The objective of DMS is to secure the government’s funding at all times at low cost over the medium/long term while avoiding excessive risk. The DMS has been articulated for the medium-term for a period of three years and is reviewed annually and rolled over for the next three years. The government published its first DMS on December 31, 2015 and thereafter in March 2018. The current scope of the Medium-Term Debt Strategy (MTDS) under DMS2 (2017-20) has been expanded to include other components such as external debt and small savings schemes in addition to internal marketable debt. The present debt profile is analysed with regard to cost, maturity and potential risk factors. The DMS revolves around three broad pillars, viz., low cost, risk mitigation and market development. The low-cost objective is attained by planned issuances and offer of appropriate instruments in the medium to long-run, taking into account market conditions and preferences of various investor segments. Low cost is also attained through improved transparency by way of a detailed issuance calendar for G-sec and T-Bills. Scenario analysis, under the MTDS has estimated the expected cost of debt based on the assumptions of future interest rates, exchange rates and future borrowing needs. The debt sustainability analysis has looked at indicators, such as, debt to GDP, average time to maturity and interest expense to GDP. Stress tests to ascertain debt sustainability by subjecting debt to economic and financial shocks have indicated a very low level of stress. The analysis confirms that the debt is stable and sustainable over the medium to long run. Treasury Bills VII.14 Treasury Bills (T-Bills) were issued during the year to manage the short-term cash requirements of the government. The net short-term market borrowing of the government through T-Bills increased to ₹ 504.81 billion in 2017-18 as against a net repayment of ₹ 298.92 billion in 2016-17 due to increased issuances during H1 of 2017-18, reflecting the pressures GoI witnessed during the period. The PDs individually achieved the stipulated minimum success ratio of 40 per cent in bidding for T-Bill. The PDs’ share in the T-Bill auctions during the year declined to 66.5 per cent as compared to 74.4 per cent in 2016-17, reflecting the increased demand for T-Bills from the other segments of the market. Cash Management of the Central Government VII.15 The government started the fiscal year 2017-18 with a cash balance of ₹ 1,303.50 billion. The WMA limit for the first and second quarter and second half of 2017-18 was fixed at ₹ 600 billion, ₹ 700 billion and ₹ 250 billion, respectively. The government’s cash position remained under stress during the first half of 2017-18 mainly on account of the advancement of the presentation of the Union Budget and front-loading of expenditure. Consequently, WMA increased to 106 days in 2017-18 as against 25 days during the previous year coupled with overdraft (OD) for 6 days in 2017-18 vis-à-vis 1 day during the previous year. The highest WMA/OD recorded was ₹ 980.04 billion on June 3, 2017. To manage the continuous stress amidst lower and uncertain tax revenue stream on account of introduction of Goods and Services Tax (GST) during the first half, the government also issued Cash Management Bills (CMBs) for ₹ 1,500 billion of tenors between 15 to 80 days. The cash position improved subsequently, as tax flows stabilised and disinvestment process accelerated. The government ended the fiscal year 2017-18 with a cash balance of ₹ 1,675.55 billion (Chart VII.2). The WMA limit for the first quarter of 2018-19 was fixed at ₹ 600 billion. 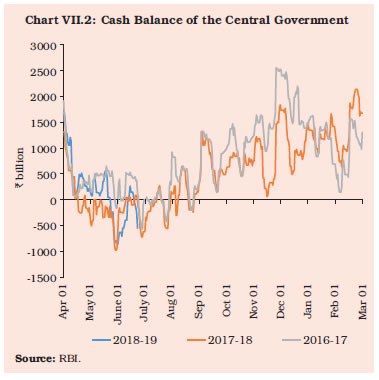 Debt Management of State Governments VII.16 States’ dependence on the market borrowing programme has increased significantly over the years. As per the recommendation of the 14th Finance Commission (FC), states opted out (barring Delhi, Madhya Pradesh, Kerala and Arunachal Pradesh) of the National Small Savings Fund (NSSF) financing facility from 2016-17. Consequently, market borrowings of states increased, also triggered by large redemption pressure from past borrowings, in the aftermath of the global financial crisis of 2008. The share of market borrowings in financing GFD increased from 64.1 per cent in 2016-17 to 66.1 per cent in 2017-18 (RE) mainly due to the termination of NSSF financing facility. This aggravated the impact on bond yields over market concerns on oversupply of sovereign paper. | Table VII.4: Market Borrowings of States through SDLs | | (Amount in ₹ billion) | | Item | 2015-16 | 2016-17 | 2017-18 | 2018-19* | | 1 | 2 | 3 | 4 | 5 | | Maturities during the year | 352 | 393 | 788 | 105 | | Gross sanction under article 293(3) | 3,060 | 4,000 | 4,824 | 3,554$ | | Gross amount raised during the year | 2,946 | 3,820 | 4,191 | 766 | | Net amount raised during the year | 2,594 | 3,427 | 3,403 | 661 | | Amount raised during the year to total Sanctions (per cent) | 96 | 96 | 87 | 22 | | Outstanding liabilities (at the end period)# | 16,389 | 20,896 | 24,298 | 24,959 | $ : April-December 2018.
#: Including UDAY and other special securities;
*: As on June 30, 2018.
Source: RBI. | VII.17 State governments raised market borrowings of ₹ 4,191 billion in gross and ₹ 3,403 billion in net during 2017-18, as compared to ₹ 3,820 billion and ₹ 3,427 billion respectively, raised in the previous year. The gross market borrowings of state governments in 2017-18 has increased by 9.7 per cent while the net borrowings declined by 0.7 per cent, due to higher repayments. There were 411 successful issuances in 2017-18, out of which 43 were re-issuances, reflecting the concerted efforts by the states towards consolidation of debt (Table VII.4). VII.18 The weighted average yield (WAY) of State Development Loans (SDLs) issued during 2017-18 stood higher at 7.67 per cent compared to 7.48 per cent in the previous year. Despite hardening of yields across securities, the weighted average spread of SDL issuances over comparable central government securities stood at 59 bps as compared to 60 bps in 2016-17. In 2017-18, nine states and the Union Territory of Puducherry issued non-standard securities of tenors ranging from 3 to 25 years. As a strategic response to higher spreads, ten states rejected all the bids received in some of the auctions conducted. Following the policy of passive consolidation, states like Maharashtra, Odisha and Tamil Nadu undertook reissuances amounting to ₹ 472.62 billion during 2017-18 to improve the liquidity of their securities in the secondary market. However, the inter-state spread at 6 bps in 2017-18 was marginally lower than 7 bps in 2016-17, reflecting that the relationship between the spread on SDLs and fiscal situation of individual states remained weak during 2017-18 as well. In this context, an inter-departmental group was set up to explore various options available to move towards appropriate pricing of SDLs. Accordingly, the monetary policy statement issued in October 2017 announced the following measures for implementation, viz.: (i) consolidation of state government debt to improve liquidity in SDLs through reissuances and buybacks; (ii) conducting of weekly auctions of SDLs; and (iii) publishing of high frequency data relating to finances of state governments available with the Reserve Bank. Consequently, with effect from October 2017, the data on Consolidated Sinking Fund (CSF), Guarantee Redemption Fund (GRF), held by the states, investments in Intermediate Treasury Bills (ITBs) and Auction Treasury Bills (ATBs) as well as financial accommodation in the form of WMA/OD are being published in the RBI Bulletin. In addition, weekly auctions of SDLs have commenced with effect from October 2017. VII.19 With a view to incentivising the state governments to get SDLs rated, it has been decided in the second bi-monthly monetary policy for 2018-19 to set the initial margin requirement for rated SDLs, submitted as collaterals in LAF Repo/MSF window, at 1.0 per cent lower than that of non-rated SDLs for the same maturity buckets, i.e., in the range of 1.5 per cent to 5.0 per cent. Further, to align the value of SDLs with the prevailing market price, the state government securities held by banks in their investment portfolio will, henceforth, be valued on observed prices, i.e., the price at which the securities have been traded in the market. In case of non-traded state government securities, valuation will be done based on the state-specific weighted average spread over the yield of the central government securities of equivalent maturity as observed at primary auctions. Cash Management of State Governments VII.20 As envisaged by the Advisory Committee on Ways and Means Advances Scheme for the State Governments, 2016 (Chairman: Shri Sumit Bose), a review of the current WMA limits was undertaken during 2017-18. Based on the trends in the utilisation of WMA facilities, it was decided to retain the existing limits (₹ 322.25 billion for all states together) of WMA until reviewed by the next committee (effective from 2020-21). In the year 2017-18, thirteen states resorted to WMA while seven states availed overdraft facility. VII.21 States have been accumulating sizeable cash surplus in recent years in the form of Intermediate Treasury Bills (ITBs) and Auction Treasury Bills (ATBs). As a result, liquidity pressures were confined only to a few states in 2017-18. Though positive cash balances indicate low intra-year fiscal pressures, it involves a negative carry of interest rates for the states, warranting improvement in cash management practices by states (Box VII.1). The outstanding investments of states in ITBs as at end-March 2018 stood at ₹ 1,508.71 billion as against ₹ 1,560.58 billion in the previous year, while outstanding investments of states in ATBs stood at ₹ 621.08 billion as against ₹ 366.03 billion at end-March 2017 (Table VII.5). The 69.7 per cent jump in investments in ATBs reflect the states’ efforts at reducing the negative carry. Investments in Consolidated Sinking Fund and Guarantee Redemption Fund VII.22 Investments in Consolidated Sinking Fund (CSF) and Guarantee Redemption Fund (GRF) are found attractive by the states as the annual incremental investments in these schemes are utilised as collateral for availing Special Drawing Facility (SDF) at a discounted rate. In order to further incentivise maintenance of adequate funds by state governments in CSF and GRF, and to encourage them to increase the corpus of these funds, the rate of interest on SDF against CSF/GRF has been lowered to 200 bps (as against 100 bps earlier) below the repo rate vide the second bi-monthly monetary policy statement of 2018-19. Outstanding investment by states in the CSF and GRF as at end-March 2018 stood at ₹ 992.71 billion and ₹ 54.38 billion, respectively. Total investment in CSF/GRF was ₹ 194.42 billion in 2017-18 and total disinvestment from the funds stood at ₹ 4.27 billion. | Table VII.5: Investments in ITBs and ATBs by State Governments/UT | | (₹ billion) | | Item | Outstanding as on March 31 | | 2015 | 2016 | 2017 | 2018 | 2018* | | 1 | 2 | 3 | 4 | 5 | 6 | | 14-Day (ITBs) | 842 | 1,206 | 1,561 | 1,509 | 1162 | | ATBs | 394 | 383 | 366 | 621 | 1220 | | Total | 1,236 | 1,589 | 1,927 | 2,130 | 2382 | *: As on June 30, 2018.
Source: RBI. |
Box VII.1
States’ Market Borrowings and Increasing Cash Surplus With most states opting out of National Small Saving Fund (NSSF) and other sources being often project-linked, states, reliance on market borrowings to finance their rapidly increasing gross fiscal deficits has increased considerably. Interestingly, the cash build up has also been rising with a sharp rise in gross borrowings, which has left them with large cash surplus as at end-March. The surplus, however, is generally seen to be concentrated with few states. The cash surplus would show up when states mobilise resources in excess of their fiscal deficit requirements. Also, if expenditures ear-marked for the identified purpose or allocated to lower parastatals/agencies/schemes do not take place or are not utilised, unutilised funds would boost the surplus with the states. While the central government issues both T-Bills and dated securities for its financing needs, state governments issue only dated securities, which makes them vulnerable at times of financial stress. For efficient cash management, it is prudent to keep a cash buffer/float to smooth expenditure/ meet any sudden unanticipated outflow. This threshold cash buffer, however, needs to be arrived at on the basis of some set criteria/historic trend, for instance, it could be a month’s expenditure cover. Ending the years with large unutilised cash balances due to such factors as given above, for continuous long periods, puts unnecessary and avoidable interest burden that results from the negative carry if such surpluses have been built from borrowed sources and are invested in Intermediate Treasury Bills/ Auction Treasury Bills at lower rates (Chart 1). While market borrowings by the centre have largely stagnated in recent times, states’ increased reliance on market borrowings in the wake of a limited resource base and constrained internal fund mobilisation against rising fiscal gap, has led to an oversupply of government paper in the G-sec market pushing up the yield. In particular, large market borrowings by the states, which they do not immediately need, increase the yield for the 10-year benchmark security, as most of the state borrowings till recently have been in the 10-year maturity bucket. Besides its impact on the cost of borrowing for the central government, the rise in consolidated debt as such has implications for the market interest and the economy at large. More importantly, higher supply of SDLs vis-à-vis central government dated bonds to finance the consolidated GFD would tend to increase consolidated government borrowing cost due to SDL illiquidity and premia over central G-sec. In such a situation when states are using up the space vacated by centre, it is necessary to recalibrate the incentives in order to make states resort to need-based market borrowings. 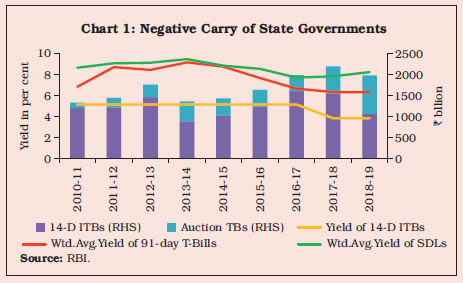 Foremost, states need to make efforts towards better expenditure management and cash forecasting for effective cash management. Effective expenditure management post allocation of budgetary funds is central to the government’s ability to control spending to deal with rising deficits and costs. This would obviate the need to keep more than prudent cash surplus which involves negative carry. Secondly, states’ reliance on market borrowings may also lessen if states find more ways to mobilise resources internally, for instance, by levying appropriate user charges for services provided by them/their undertakings. A shift from fortnightly issuances to weekly SDLs auctions, in addition to GoI providing sanction under article 293(3) of the Constitution for 9 months at a stretch at the beginning of the year, has given states the flexibility to enter the market at appropriate time and as required. In this regard, the 13th Finance Commission (FC) had recommended that ‘there should be a directed effort by states with large balances towards utilising their existing cash balances before resorting to fresh borrowings’. In other words, fresh borrowing can be linked to utilisation of previous releases. The 15th FC can also deliberate on the allocated but unutilised funds, perhaps due to capacity constraints that end-up as surplus for long periods of time in the hands of states, and how these can be gainfully utilised elsewhere and thereby, reduce the extent of fresh borrowings. Though most of the states are investing in long-term instruments by maintaining CSF/GRF, the liquidation is only for specific purposes. Other than non-marketable 14-days T-Bills that offer low returns, and Auction T-Bills that lock the funds for a longer tenor, states’ avenues for investment of their surplus in short maturities are limited. The 15th FC can explore the alternate short-term investment avenues for states to park funds till their utilisation at better returns and thereby, help reduce negative carry. The Reserve Bank is also taking steps towards consolidation of state debt through reissuances. Improving the availability of high-frequency data on state finances is a step forward towards improving market discipline which may restrain states from excessive borrowings at higher costs. | Agenda for 2018-19 VII.23 The Union Budget 2018-19 estimated the gross market borrowing through dated securities at ₹ 6,055 billion, higher by about 3 per cent as compared with ₹ 5,880 billion in 2017-18. Net market borrowing at ₹ 4,621 billion is envisaged to increase by 3 per cent during the same period. The Union Budget 2018-19 has also provided for net short-term borrowings of ₹ 170 billion. The net borrowing through dated securities has been estimated to fund about 74 per cent of GFD in 2018-19 (BE). VII.24 The market borrowing programme of the central and state governments would continue to be guided by the following strategic measures within the overall objective of developing a deep and liquid market for G-sec as well as SDLs: i. The overall liquidity in the G-sec market will be enhanced by consolidation of debt through active switches and buyback operations and the passive strategy of re-issuances. ii. The secondary market liquidity of G-sec is proposed to be enhanced through the PDs’ network in consultation with stakeholders and the existing secondary market turnover target for PDs will be reviewed. iii. Elongation of maturity profile of the government debt will be undertaken under conducive market conditions. The features of CPI linked Inflation Indexed Bonds (IIBs) will be examined to cater to diverse investor base. iv. Issuance of SGBs would be undertaken at greater regularity through calendar of issuances. v. The recommendations of the inter-departmental group on the expansion of PD activities will be examined with a view to strengthening their network. vi. Various options will be explored to reflect risk asymmetry among state governments in their cost of borrowings based on fiscal and economic parameters; capacity building programmes will be conducted for state governments and meetings between investors and state governments will be facilitated. vii. Investor base will be broadened by working with state governments to manage their State Disaster Response Funds (SDRFs) through investment in G-sec and T-Bills and also by greater participation of foreign central banks in the G-sec market. viii. A dashboard will be created to present information on the G-sec market covering important variables including gross and net borrowings of central and state governments.
|