Following a reduction in the policy rate by 25 basis points (bps) in August 2017, the policy rate was kept on hold until June 2018 when it was raised by 25 bps. The policy stance remained neutral from February 2017 onwards. Surplus liquidity in the system generated in the wake of demonetisation was gradually drained away by the Reserve Bank’s liquidity management operations. Transmission of policy impulses to deposit and lending rates improved further during the year, albeit with large variations across sectors and bank groups. III.1 The conduct of monetary policy in 2017-18 continued to be guided by the objective of achieving the medium-term target for consumer price index (CPI) inflation of 4 per cent within a tolerance band of +/- 2 per cent, while supporting growth. Although fluctuations in food prices imparted considerable intra-year volatility to headline inflation, it remained within the target, averaging 3.6 per cent for the year as a whole. Growth-inflation trade-offs accentuated during the course of the year, which was reflected in the voting pattern of members of the Monetary Policy Committee (MPC). The Reserve Bank continued to manage liquidity consistent with the monetary policy stance and carried out operations in the form of variable rate reverse repo auctions of various tenors to absorb the surplus liquidity unleashed by demonetisation. Monetary transmission from the policy rate to banks’ deposit and lending rates improved further during 2017-18, although it remained uneven across sectors/bank groups. Agenda for 2017-18: Implementation Status Monetary Policy III.2 In the first bi-monthly monetary policy statement for 2017-18 (April 6, 2017), the MPC unanimously voted to keep the policy repo rate unchanged at 6.25 per cent. Inflation was projected to average 4.5 per cent in the first half of 2017-18 and 5 per cent in the second half, with risks evenly balanced around this baseline trajectory. Growth was projected to strengthen in 2017-18 on the back of the fast pace of remonetisation, favourable capital expenditure stimulating proposals in the Union Budget and the upsurge in activity in the primary capital market. With underlying inflation pressures persisting, however, and the output gap gradually closing, the MPC stressed that aggregate demand pressures could build up, with implications for the inflation trajectory. III.3 By the second bi-monthly statement of the MPC of June 7, 2017, an abrupt and significant retreat of inflation imparted considerable uncertainty to the evolving inflation trajectory. The MPC observed that the transitory effects of demonetisation had lingered on in price formations relating to salient food items, entangled with excess supply conditions with respect to fruits and vegetables, pulses and cereals. At the same time, the effects of demonetisation on the broader economy were seen as sector-specific and transient. The MPC noted that in such an uncertain environment, premature action risked disruptive policy reversals later and the loss of credibility. Accordingly, the MPC decided to keep the policy repo rate unchanged and continued with the neutral stance. Five members of the MPC were in favour of the monetary policy decision, while one member favoured a reduction in the policy repo rate by 50 bps. III.4 In the run-up to the third bi-monthly statement of August 2, 2017, CPI inflation had plunged to its lowest reading (in the series with base 2012) in the print for June 2017. The MPC observed that even as inflation had fallen to a historic low, a conclusive segregation of transitory and structural factors driving disinflation was still elusive. Taking cognisance of the significant fall in inflation excluding food and fuel during Q1 of 2017-18 and fairly stable international commodity price outlook, the MPC noted that some of the upside risks to inflation had either reduced or not materialised: (i) the baseline path of headline inflation was projected lower than in the June policy to reach a little above 4 per cent by Q4, sans the impact of increase in house rent allowance (HRA) under the 7th Central Pay Commission (CPC); (ii) inflation excluding food and fuel had fallen significantly over the past three months; and (iii) the monsoon was normal. Given the dynamics of the output gap, the MPC noted that some space had opened up for monetary policy accommodation. Accordingly, the MPC decided to reduce the policy repo rate by 25 bps with four members voting in favour of the monetary policy resolution, one member voting for a larger cut in the policy repo rate of 50 bps and one member voting for status quo. The MPC, however, decided to keep the policy stance neutral and watch incoming data as the projected trajectory of inflation was expected to rise from the then prevailing lows. III.5 By the time, the MPC met for the fourth bi-monthly policy in early October, inflation had risen by around two percentage points from the level prevailing during its August meeting and the increase was across the board. These price pressures coincided with an escalation of global geo-political tensions and heightened volatility in international financial markets. While the outlook on food prices was largely stable, generalised momentum was building in prices of items excluding food. These developments, along with the possibility of fiscal slippages, called for a careful management of risks to inflation. The MPC acknowledged the likelihood of the output gap widening, but indicated that it required more data to better ascertain the transient versus sustained headwinds in the growth prints. Accordingly, the MPC decided to keep the stance neutral and the policy rate unchanged with a majority of 5 votes; one member voted for a reduction in the policy repo rate by at least 25 bps. III.6 Retail inflation recorded a seven-month high reading in October, driven by a sharp uptick in momentum. This inflation outcome was, however, broadly in line with the projection. The MPC in its resolution for the fifth bi-monthly policy review on December 6, 2017, noted that the evolving inflation trajectory needed to be carefully monitored in view of higher food and fuel inflation, rising input cost conditions, fiscal slippage risk [from implementation of farm loan waivers by select states, partial rollback of excise duty and value added tax in the case of petroleum products, and decrease in revenue on account of reduction in goods and services tax (GST) rates for several goods and services] with attendant implications for inflation. The expected seasonal moderation in prices of vegetables and fruits, and the lowering of tax rates by the GST Council were seen as mitigating factors. Accordingly, the MPC decided to keep the policy rate on hold with a majority of 5 votes; one member voted for a reduction in the policy repo rate by 25 bps. However, keeping in mind the output gap dynamics, the MPC decided to continue with the neutral stance. The MPC reiterated its commitment to keeping headline inflation close to the target on a durable basis. III.7 The increase in HRA for central government employees pulled up headline inflation in December. Food prices and fuel inflation also rose abruptly in November before reverting partly in December. Households’ inflation expectations rose in December and remained elevated, while firms reported input price pressures and increase in selling prices. In this backdrop, the sixth bi-monthly policy on February 7, 2018 projected inflation to remain elevated in H1 of 2018-19, before softening in H2 under the assumption of a normal monsoon and effective food supply management. The MPC noted that there were both upside risks and mitigating factors at play. On the one hand, several factors could impinge on the inflation outlook: staggered impact of HRA increases by state governments; pick-up in global growth that could harden crude oil and other commodity prices; the revised guidelines on minimum support prices (MSPs) for kharif crops; increase in customs duty on a number of items; and fiscal slippage as indicated in the Union Budget. On the other, subdued capacity utilisation, the possibility of oil prices softening from prevailing levels based on production responses, and moderate rural real wage growth provided some comfort to the inflation outlook. The MPC noted that there was a need for vigilance around the evolving inflation scenario and voted to keep the policy repo rate on hold while continuing with the neutral stance. One MPC member, however, voted for an increase in policy repo rate by 25 bps. III.8 In the first bi-monthly monetary policy statement for 2018-19 of April 5, 2018, the MPC held the policy repo rate unchanged, with five members voting in favour of the decision, and one member voting for an increase of 25 bps. Actual inflation outcomes in January-February were somewhat lower than those projected in the MPC’s February resolution. Although inflation projections for 2018-19 were revised downwards, MPC noted that there were several uncertainties surrounding the baseline inflation path such as increase in MSPs for kharif crops based on a revised formula announced in the Union Budget 2018-19, volatility in crude oil prices, and the risk of fiscal slippages at national and sub-national levels. The performance of the monsoon and volatility in food prices also imparted uncertainty to the inflation outlook. While the staggered impact of HRA revisions by state governments was seen as pulling up inflation, the MPC indicated that it would look through the direct statistical impact of the increase in HRAs while watching out for the second round impact. Against this backdrop, the MPC decided to keep the policy repo rate on hold and continued with the neutral stance. III.9 At the time of the MPC’s June 6, 2018 meeting, headline inflation had edged up driven mainly by inflation excluding food and fuel, suggesting hardening of underlying inflationary pressures. Inflation projection for H2 of 2018-19 was revised upward to 4.7 per cent vis-à-vis 4.4 per cent in the April statement. The MPC noted that a major upside risk to the baseline inflation path had materialised in the form of a sharp increase in crude oil prices that was seen to be durable. The MPC also flagged risks to inflation from global financial market developments, the significant rise in households’ inflation expectations, the staggered impact of HRA revisions by various state governments, and the revision in the MSP formula for kharif crops; the forecast of a normal monsoon which was expected to keep food inflation benign. Taking these into consideration, the MPC decided to increase the policy repo rate by 25 bps, while keeping the stance neutral and reiterating its commitment to achieving the medium-term target for headline inflation of 4 per cent on a durable basis. The Operating Framework: Liquidity Management III.10 The operating framework of monetary policy aims at aligning the operating target – the weighted average call rate (WACR) – with the policy repo rate through proactive liquidity management consistent with the stance of monetary policy. In pursuit of this objective and keeping in view the evolving liquidity situation, the Reserve Bank adopted a dual approach during 2017-18: (i) providing forward guidance on the scale and scope of liquidity management operations to be conducted during the year; and (ii) making subtle changes in the operating framework to minimise volatility in the inter-bank market. III.11 First, given the large liquidity overhang consequent upon demonetisation, liquidity management operations during 2017-18 were principally aimed at modulating system liquidity from a surplus mode to a position closer to neutrality, consistent with the stance of monetary policy. Anticipating that surplus liquidity conditions may persist through 2017-18, both on account of liquidity overhang and higher capital inflows, the Reserve Bank provided forward guidance on liquidity in April 2017 when it indicated it would conduct: (i) variable rate reverse repo auctions with a preference for longer term tenors to absorb the remaining post-demonetisation liquidity surplus; (ii) issuances of Treasury Bills (T-Bills) and dated securities under the market stabilisation scheme (MSS) to modulate liquidity from other sources; (iii) issuances of cash management bills (CMBs) of appropriate tenors in accordance with the memorandum of understanding (MoU) with the Government of India (GoI) to manage enduring surpluses due to government operations; (iv) open market operations (OMOs) to manage durable liquidity with a view to moving system level liquidity to neutrality; and (v) fine-tuning variable rate reverse repo/repo operations to modulate day-to-day liquidity. III.12 Second, in consonance with the recommendation of the Expert Committee to Revise and Strengthen the Monetary Policy Framework (Chairman: Dr. Urjit R. Patel), the width of the policy rate corridor was narrowed from 100 bps in April 2016 to 50 bps in April 2017 in a symmetric manner. Accordingly, the reverse repo rate under the liquidity adjustment facility (LAF) was placed 25 bps below the policy repo rate, while the marginal standing facility (MSF) rate was placed 25 bps above the policy repo rate. With the narrowing of the LAF corridor, volatility in the call money market reduced even as the volume remained broadly unchanged at less than 10 per cent of the total overnight market. Moreover, in order to provide operational flexibility and enhance the liquidity of collaterals, substitution of collateral by market participants in the term repos under the LAF was allowed, effective April 17, 2017. III.13 Demonetisation induced system-wide liquidity moderated gradually during 2017-18, impacted by the front-loading of government spending, advance tax outflows, foreign exchange market operations of the Reserve Bank and remonetisation, which was reflected in higher currency in circulation. Surplus liquidity conditions progressively moderated and turned into deficit mode in February and March. Nonetheless, easy liquidity conditions were reflected in the WACR trending below the policy repo rate throughout the year except towards the year-end (Chart III.1). This trend continued in Q1 of 2018-19 till the policy rate hike of June 6, 2018, post-which the WACR firmed up towards the repo rate. 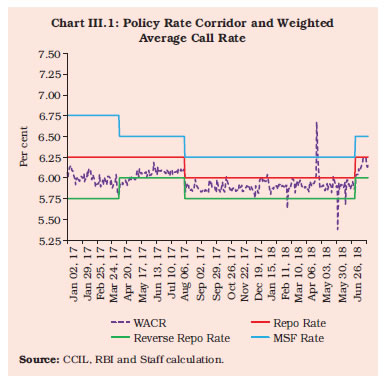 III.14 As liquidity absorption under the LAF moderated during the course of the year, the average spread between the WACR and the policy repo rate narrowed from (-) 32 bps in April 2017 to a mere (-) 5 bps by March 2018 (Chart III.2). At the end of June 2018, the spread, however, widened to (-) 12 bps reflecting easing of liquidity conditions since April. III.15 In Q1 of 2017-18, expansion in currency in circulation due to rapid remonetisation drained about ₹2 trillion of surplus liquidity from the system, which was, however, more than offset by front-loaded expenditure by the government and large redemption of government securities. To mop up the resulting surplus liquidity and consistent with its objective of moving towards liquidity neutrality, the Reserve Bank auctioned T-Bills (tenors ranging from 312 days to 329 days) aggregating ₹1 trillion under MSS in April and May 2017. The average daily net absorption of liquidity increased to ₹4.6 trillion (including reverse repo, MSS and CMBs) during Q1 of 2017-18 from ₹3.1 trillion at end-March 2017 (Chart III.3). 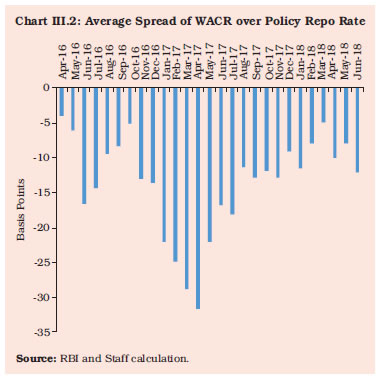 III.16 During Q2 of 2017-18, frequent recourse to ways and means advances (WMAs) and overdrafts (ODs) by the government augmented market liquidity even as currency in circulation absorbed up to ₹571 billion from the system. With the government’s cash balance position improving during August, the average daily net absorption of liquidity declined from ₹5.1 trillion (including LAF, MSS and CMBs) in the first week of August to ₹4.4 trillion by end-August 2017. With advance tax outflows in mid-September, surplus liquidity in the system declined to ₹2.8 trillion by end-September. Moreover, the Reserve Bank conducted open market sales consequent on forex intervention purchases to absorb ₹600 billion of durable liquidity (₹200 billion each in July, August and September) in addition to variable rate reverse repo auctions of various tenors. 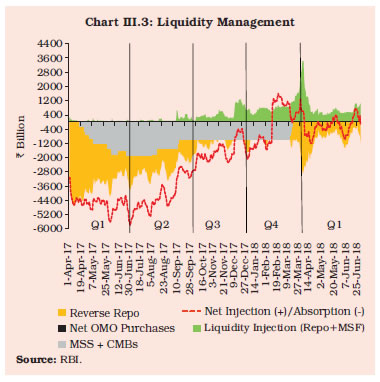 III.17 In Q3 of the year, average daily net liquidity absorbed under the LAF (mainly through variable rate reverse repo auctions of tenors ranging from overnight to 28 days) declined from ₹1.4 trillion in October 2017 to ₹718 billion in November, aided by the increase in currency in circulation and pick-up in credit growth. Moreover, the Reserve Bank conducted open market sales on three occasions to absorb ₹300 billion on a durable basis (₹200 billion in October and ₹100 billion in November) in order to mitigate the liquidity impact of forex purchases during the quarter. Liquidity conditions temporarily turned into deficit mode in the second half of December with the slowdown in government spending prolonging the shortfall created by the usual advance tax outflows. Accordingly, liquidity amounting to ₹1.3 trillion was injected by the Reserve Bank through variable rate repos of varying tenors in addition to regular 14-day term repos. III.18 During Q4, surplus liquidity declined and turned into deficit towards the year-end. The average daily net liquidity absorbed under LAF (including MSF) amounted to ₹353 billion in January. The liquidity situation, however, turned into deficit in February-March on account of the drying up of government spending and large tax collections, which necessitated average daily net injection of liquidity amounting to ₹140 billion by the Reserve Bank. III.19 Anticipating tightness in liquidity conditions in March and with a view to providing greater flexibility to the banking system to tide over the usual year-end liquidity mismatches, four additional variable rate repo operations (₹250 billion each) of longer tenors (24 to 31 days) were conducted and standalone Primary Dealers were allowed to participate within the usual notified amount of the regular term repo auction conducted on March 28, 2018. Furthermore, liquidity was augmented in March through redemption of T-Bills, which were issued under the MSS in April and May 2017. On the whole, average daily net liquidity absorbed under the LAF (including MSF) declined from ₹812 billion in Q3 to ₹30 billion in Q4. III.20 During Q1 of 2018-19, liquidity conditions generally remained in surplus mode, although it moderated during the quarter from an average daily surplus (under LAF) of ₹496 billion in April to ₹140 billion in June. The surplus liquidity mainly reflected the drawdown of government balances due to transfer of GST proceeds to states in April and higher budgetary spending by the GoI, especially in June 2018. In order to manage the surplus liquidity, the Reserve Bank conducted variable rate reverse repo auctions of various tenors while CMBs were again issued in June to address temporary mismatches in government balances. On the other hand, the Reserve Bank conducted variable rate repos of other tenors in addition to the regular 14-day term repos in June to tide over temporary tightness in systemic liquidity on account of advance tax outflows. During the quarter, the Reserve Bank also injected ₹200 billion through OMO purchases of ₹100 billion each in May and June. Overall, average daily net liquidity absorption under LAF during the quarter amounted to ₹258 billion. III.21 The Reserve Bank has been conducting OMOs to manage the enduring liquidity impact of forex interventions. Such sterilisation operations can, however, have their own interactions with other aspects of the economy and markets (Box III.1). Box III.1
Sterilisation of Capital Flows From the perspective of a central bank balance sheet, domestic liquidity conditions are mainly driven by autonomous factors, viz., currency in circulation, government cash balances and foreign exchange flows. While currency in circulation and government cash balances have a bearing mostly on domestic liquidity conditions (interest rates), foreign exchange flows can also have an impact on the exchange rate and the real economy. In a globalised world, volatile capital flows pose significant challenges to liquidity management and the conduct of monetary policy. Central banks, therefore, sterilise inflows to retain monetary control. Cross-country evidence suggests that the extent of sterilisation operations conducted by emerging market economies has increased significantly, commensurate with the magnitude of such flows (Aizenman and Glick, 2008). As in the South East Asian region, foreign exchange reserves also increased in India (Chart 1.a). Despite this, expansion in primary liquidity (reserve money) was kept in sync with the needs of the growing economy largely through sterilised interventions (Chart 1.b). Sterilisation operations, if undertaken through sale of domestic securities, can put upward pressure on domestic interest rates which, in turn, can widen interest rate differentials. In such a scenario, sterilisation operations can trigger higher capital inflows. Thus, the change in net domestic assets (NDA) can be nullified through a change in net foreign assets (NFA). Empirically, the extent and effectiveness of sterilisation operations undertaken by a central bank can be measured by computing sterilisation and offset coefficients, respectively, both varying between 0 and -1. The sterilisation coefficient measures the extent to which the NDA of a central bank change in response to a change in NFA, while the offset coefficient measures the extent to which a decrease/increase in NDA causes an increase/decrease in NFA. A value of -1 for the sterilisation coefficient suggests complete sterilisation, i.e., no impact of capital flows on the reserve money, a value of 0 would imply that forex intervention is not sterilised at all by the central bank. A value of -1 for offset coefficient suggests the complete ineffectiveness of the central bank in sterilising capital flows, i.e., complete attenuation of monetary control. An offset coefficient value of -1 can also be an indication of perfect capital mobility, while a value of 0 would imply no capital mobility. 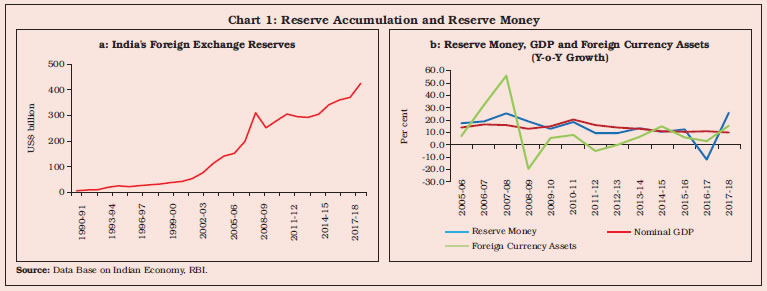 To assess the effectiveness of sterilisation operations in the Indian context, the sterilisation coefficient is estimated through a modified money demand function, while the offset coefficient is estimated from a modified equation on capital flows for the period July 1997 to October 2017 using monthly data and the two-stage least-squares (2SLS) method (Cavoli and Rajan, 2013). The variables used in equations: 1 and 2 are (i) NDA; (ii) NFA (adjusted for valuation changes); (iii) nominal GDP (quarterly data interpolated to monthly) (GDP); (iv) interest differential measured as the spread of the call rate over the effective federal funds rate (IF); (v) real effective exchange rate (REER); (vi) money multiplier (ratio of broad money to reserve money) (Mul); (vii) spread between the policy rate and the weighted average call rate (DS); and (viii) quantum of secondary market operations in government securities (GS). Recognising the endogeneity problem between NDA and NFA in both equations, relevant instrumental variables are used in estimation, i.e., REER and IF in the first equation for NFA, and DS and GS in the second equation for NDA. All variables are considered in the year-on-year difference form, which takes care of both seasonality as also stationary properties of the variables. GDP, REER and GS are taken in log form. The NDA and NFA are normalised by the log of reserve money of the previous year. 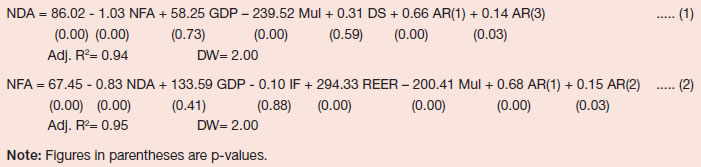 The sterilisation coefficient is estimated at -1.03 and the offset coefficient at -0.83. The sterilisation coefficient, being greater than the offset coefficient (in absolute terms), suggests some effectiveness of sterilisation operations in controlling liquidity (Raj et al., 2018). The Indian experience suggests that the Reserve Bank has been successful in retaining monetary policy independence, while dealing with capital flows. This reflects the use of multiple instruments available at its disposal to maintain domestic monetary and liquidity conditions consistent with the monetary policy stance. The standing deposit facility announced in the Union Budget 2018-19 and notified in April 2018 is expected to strengthen the array of instruments in the arsenal of the Reserve Bank to manage volatile capital flows more effectively, going forward. References: 1. Aizenman, J. and R. Glick (2008), “Sterilisation, Monetary Policy and Global Financial Integration”, NBER Working Paper, No. 13902, March. 2. Cavoli, T. and R. S. Rajan (2013), “Capital Inflows and Interest Premium Problem: Revisiting the Effects of Monetary Sterilisation in Asia”, Paper prepared for the International conference on Pacific Rim Economies and the Evolution of the International Monetary Architecture, City University of Hong Kong, December. 3. Raj, J., S. Pattanaik, I. Bhattacharya and Abhilasha (2018), “Forex Market Operations and Liquidity Management,” RBI Bulletin, August. | III.22 An amendment to Section 17 of the RBI Act, 1934 would allow the Reserve Bank to accept “money as deposits, repayable with interest, from banks or any other person under the standing deposit facility scheme, as approved by the Central Board, from time to time, for the purposes of liquidity management”. The standing deposit facility (SDF), as and when operationalised, will provide an additional mechanism for draining liquidity, particularly during periods of exceptional liquidity glut. Monetary Policy Transmission III.23 In response to the cumulative 200 bps decline in the policy rate during January 2015 to May 2018, banks lowered their deposit and lending rates (Table III.1). Banks passed a large part of the reduction in their cost of funding due to increase in the share of low cost current account and savings account (CASA) deposits to their new borrowers, with interest rates on fresh rupee loans exhibiting a faster decline than that on outstanding loans. However, the transmission from the policy repo rate to deposit and lending rates on fresh rupee loans slowed down during 2017-18 in comparison with the previous year, mainly due to deceleration in deposit growth and a modest revival in credit demand. Following the policy rate hike of 25 bps on June 6, 2018, the median term deposit rate and 1-year marginal cost of funds based lending rate (MCLR) increased by 5 bps and 3 bps, respectively. The weighted average lending rate (WALR) on fresh rupee loans also increased by 8 bps in June. | Table III.1: Transmission to Deposit and Lending Rates | | (Basis points) | | Period/Variation | Policy Repo Rate | Term Deposit Rates | Lending Rates | | Median Term Deposit Rate | WADTDR | Median Base Rate | 1-Year Median MCLR | WALR - Outstanding Rupee Loans | WALR - Fresh Rupee Loans | | 1 | 2 | 3 | 4 | 5 | 6 | 7 | 8 | | January 2015 to May 2018 | -200 | -159 | -193 | -80 | * | -172 | -205 | | June 2018 | 25 | 5 | -2 | 0 | 3 | 0 | 8 | | April 2016 to June 2018 | -50 | -84 | -104 | -20 | -93 | -108 | -99 | | April 2016 to March 2017 | -50 | -68 | -76 | -10 | -85 | -40 | -73 | | April 2017 to March 2018 | -25 | -25 | -30 | -10 | -20 | -65 | -40 | | Memo: | | | | | | | | | Pre-Demonetisation | | | | | | | | | January 2015 to October 2016 | -175 | -99 | -126 | -61 | * | -75 | -97 | | April 2016 to October 2016 | -50 | -29 | -35 | -1 | -17 | -11 | 1 | | Post-Demonetisation | | | | | | | | | November 2016 to June 2018 | 0 | -55 | -69 | -19 | -76 | -97 | -100 | | Post-August 2, 2017 Policy | | | | | | | | | August 2, 2017 to June 2018 | 0 | 1 | -6 | -3 | 2 | -47 | -32 | | August 2, 2017 to December 2017 | -25 | -15 | -22 | -3 | -20 | -32 | -39 | | January 2018 to June 2018 | 25 | 16 | 16 | 0 | 22 | -15 | 7 | WADTDR: Weighted Average Domestic Term Deposit Rate.
WALR: Weighted Average Lending Rate. MCLR: Marginal Cost of Funds based Lending Rate.
*: MCLR system was put in place on April 1, 2016.
Source: Special Monthly Return VIAB, RBI and banks’ websites. | III.24 Several large banks – in both public and private sectors – reduced their savings bank deposit rates beginning July 31, 2017. This was the first time that the median savings deposit rate declined after the Reserve Bank deregulated it in October 2011. The pace of the decline in term deposit rates was, however, lower during 2017-18 than in the previous year as the pace of accretion to term deposits decelerated. Significantly, the WALRs on fresh rupee loans declined more than the decline in term deposit rates during 2017-18 unlike in the previous year for two reasons. First is the reduction in the interest rates on savings account deposits of banks as stated earlier, which accounted for 31.3 per cent of aggregate deposits as at end-March 2018. Second, the share of low-cost CASA deposits of commercial banks (barring regional rural banks, small finance and payment banks) increased from 40.6 per cent in March 2017 to 41.1 per cent in March 2018. Unlike in the previous year, the WALR on outstanding rupee loans declined faster in 2017-18 – by 65 bps as against a decline of 40 bps in the WALR on fresh rupee loans – as banks reset interest rates at prevailing lower rates on the floating rate loans contracted in the past. III.25 Following the cut in the policy repo rate by 25 bps on August 2, 2017, the median MCLR declined across tenors and bank groups till December 2017, with the 1-year median MCLR declining by 20 bps. However, the gradual dissipating of surplus liquidity contributed to an upward pressure on money and bond market rates since Q3. This fed into the retail term deposit rates and eventually the 1-year median MCLR rose by 22 bps during January-June 2018. Despite this, the WALR on outstanding rupee loans continued to exhibit a downtrend reflecting the downward movements in lending rates as the old loans were reset at lower rates, as alluded to before. After rising by 14 bps during January-February 2018, WALR on fresh rupee loans declined sharply by 21 bps in March alone - a usual year-end seasonal phenomenon as banks doubled (rise of 98 per cent) sanctioning of fresh rupee loans over February, partly reflecting interest application and partly window dressing. Bank group-wise, both deposit and lending rates of public sector banks exhibited the largest decline (Chart III.4). Sectoral Lending Rates III.26 Monetary transmission is not uniform across sectors due to idiosyncratic factors. During 2017-18, lending rates on outstanding loans declined across the sectors in a wide range of 24-123 bps, with the largest decline occurring in the personal credit card segment (Table III.2). III.27 In line with the aggregates, the transmission of the policy rate to the lending rates on fresh rupee loans for housing and vehicle loan segments slowed down significantly during 2017-18 vis-à-vis a year ago (Table III.3). III.28 In order to improve transparency in lending rates, the MCLR system was introduced in April 2016 in place of the then prevailing base rate system. However, transmission during the MCLR regime has not been entirely satisfactory. In order to examine the various aspects of MCLR and to suggest refinements, an Internal Study Group (Chairman: Dr. Janak Raj) was constituted by the Reserve Bank. The report of the Group was placed in the public domain for feedback in October 2017. The feedback received and the responses of the Group to the suggestions/ comments received were placed in the public domain in the form of an addendum to the report in February 2018. The recommendations of the Group are under consideration of the Reserve Bank. Agenda for 2018-19 III.29 Under the agenda for 2017-18, studies on estimates of exchange rate pass-through to gauge non-linearity, asymmetry and time-varying nature of the pass-through; determinants of inflation in a Phillips curve framework to assess the role of demand conditions and supply shocks; effects of Basel III liquidity regulations on the operating target of monetary policy; the impact of increase in HRAs by the central government for its employees; the impact of farm loan waivers and fiscal slippages on inflation; and the role of asset quality of banks in the transmission of policy rate to bank lending rates were completed, as scheduled. | Table III.2: Sector-wise WALR of SCBs (Excluding RRBs) - Outstanding Rupee Loans | | (at which 60 per cent or more business is contracted) | | (Per cent) | | End-Month | Agriculture | Industry (Large) | MSMEs | Infrastructure | Trade | Professional Services | Personal Loans | Rupee Export Credit | | Housing | Vehicle | Education | Credit Card | Other $ | | 1 | 2 | 3 | 4 | 4 | 6 | 7 | 8 | 9 | 10 | 11 | 12 | 13 | | Dec-14 | 10.93 | 12.95 | 13.05 | 13.05 | 13.09 | 12.39 | 10.76 | 11.83 | 12.90 | 37.86 | 14.24 | 12.16 | | Mar-16 | 10.74 | 12.36 | 12.25 | 12.06 | 12.50 | 11.81 | 10.56 | 11.65 | 12.48 | 38.00 | 13.90 | 11.46 | | Oct-16 | 10.88 | 11.64 | 12.23 | 11.89 | 11.86 | 11.56 | 10.00 | 11.45 | 12.40 | 39.01 | 12.98 | 10.78 | | Mar-17 | 10.95 | 11.57 | 11.88 | 11.80 | 11.59 | 11.21 | 9.78 | 11.05 | 11.70 | 39.02 | 12.85 | 10.98 | | Jun-17 | 10.78 | 11.28 | 11.75 | 11.59 | 11.41 | 10.91 | 9.59 | 10.87 | 11.53 | 38.88 | 12.85 | 9.78 | | Sep-17 | 10.82 | 11.29 | 11.64 | 11.55 | 11.69 | 10.86 | 9.55 | 10.73 | 11.47 | 38.28 | 12.67 | 10.60 | | Dec-17 | 10.72 | 11.21 | 11.45 | 11.51 | 10.95 | 10.93 | 9.42 | 10.79 | 11.28 | 38.61 | 12.50 | 10.12 | | Mar-18 | 10.71 | 11.03 | 11.41 | 11.40 | 11.08 | 10.87 | 9.38 | 10.74 | 11.29 | 37.79 | 12.48 | 10.08 | | June-18 | 10.67 | 11.23 | 11.30 | 11.28 | 11.00 | 10.73 | 9.43 | 10.66 | 11.29 | 38.55 | 12.66 | 10.07 | | Variation (Percentage Points) | | June-18 over Dec-14 | -0.26 | -1.72 | -1.75 | -1.77 | -2.09 | -1.66 | -1.33 | -1.17 | -1.61 | 0.69 | -1.58 | -2.09 | | Mar-18 over Mar-17 | -0.24 | -0.54 | -0.47 | -0.40 | -0.51 | -0.34 | -0.40 | -0.31 | -0.41 | -1.23 | -0.37 | -0.90 | | Mar-17 over Mar-16 | 0.21 | -0.79 | -0.37 | -0.26 | -0.91 | -0.60 | -0.78 | -0.60 | -0.78 | 1.02 | -1.05 | -0.48 | $: Other than housing, vehicle, education and credit card loans.
MSMEs: Micro, Small and Medium Enterprises.
Source: Special Monthly Return VIAB, RBI. |
| Table III.3: WALR of Select Sectors of SCBs (Excluding RRBs) - Fresh Rupee Loans Sanctioned | | (Per cent) | | End-Month | Personal | Commercial | | Housing | Vehicle | Housing | Vehicle | | 1 | 2 | 3 | 4 | 5 | | Dec-14 | 10.53 | 12.28 | 11.73 | 12.53 | | Mar-16 | 9.78 | 11.98 | 11.14 | 11.21 | | Oct-16 | 9.55 | 11.50 | 10.70 | 11.79 | | Mar-17 | 8.94 | 10.77 | 10.03 | 10.24 | | Sep-17 | 8.85 | 10.51 | 9.76 | 10.50 | | Dec-17 | 8.84 | 10.33 | 9.96 | 10.14 | | Mar-18 | 8.80 | 10.61 | 9.45 | 10.05 | | June-18 | 8.77 | 11.06 | 9.60 | 10.75 | | Variation (Percentage Points) | | | | | | June-18 over Dec-14 | -1.76 | -1.22 | -2.13 | -1.78 | | Mar-18 over Mar-17 | -0.14 | -0.16 | -0.58 | -0.19 | | Mar-17 over Mar-16 | -0.84 | -1.21 | -1.11 | -0.97 | | Source: Special Monthly Return VIAB, RBI. | III.30 Since inflation forecast is the intermediate target in a flexible inflation targeting regime, the focus would be on a detailed assessment of the likely factors impinging upon the inflation outlook: (i) the impact of increase in HRA by state governments as it unfolds and influences the inflation path, with emphasis on tracking second round effects; (ii) demand pressures arising on account of strengthening of domestic growth impulses, especially in view of rising input price pressures and corporates gradually regaining pricing power; (iii) capturing the dynamics of crude oil prices and the channels through which they influence headline inflation in view of strengthening of global growth and elevated geo-political tensions; and (iv) assessing the impact of increases in MSPs being contemplated by the government. III.31 Studies would also be undertaken to improve the understanding of the factors driving growth, which is important under a flexible inflation targeting framework. A detailed empirical analysis of the investment cycle would be taken up to understand the duration of the investment cycles and inflexion points/structural breaks. Given the substantial backward and forward linkages of the real estate sector with the broader economy, examining the structural and cyclical dynamics of the sector assumes importance. The quarterly projection model1 that is applied for medium-term growth and inflation projections would be augmented by incorporating a fiscal block for an enhanced understanding of monetary-fiscal interface in the Indian context. Pro-active liquidity management is the key to the effectiveness of monetary policy. In this context, a detailed analysis of the liquidity impact of forex operations would be undertaken.
|