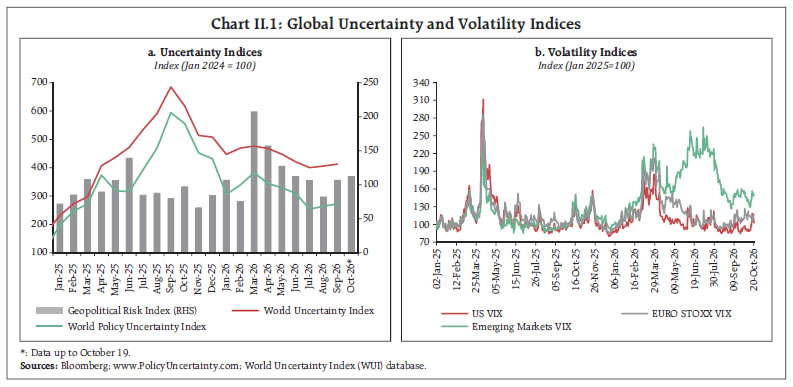
Renewed geopolitical frictions in West Asia and supply chain disruptions have amplified inflationary pressures, prompting major central banks to raise policy rates. Elevated sovereign bond yields in advanced economies (AEs) have also brought into focus concerns about fiscal sustainability and its implications for financial stability. The Indian economy continued to demonstrate strength as evidenced by high-frequency indicators across both industry and services. The headline Consumer Price Index (CPI) inflation edged up in September driven by a broad-based increase in food, fuel, and core components. Double-digit growth in merchandise exports during the first six months of 2026-27 helped in narrowing the trade deficit. FDI, ECB and remittance flows strengthened in August. Strong inflows under the FCNR(B) swap window augmented reserves. Introduction The West Asia conflict entered its eighth month, keeping energy prices elevated and supply chains constrained, amidst the ongoing uncertainties in trade policies and volatility in financial markets. These developments, combined with strengthening El Niño conditions globally have raised inflationary risks. Sharp rise in sovereign bond yields along with rising inflation expectations have led many central banks to tighten policy rates. Despite these pressures, the global economy demonstrated strength backed by rising AI-driven investments, shifting supply chains, inventory drawdowns and rerouting of international trade. The global financial system also withstood these shocks well. Taking these factors into account, the International Monetary Fund (IMF) revised its 2026 global growth projection upward by 10 basis points to 3.1 per cent.1 However, the resilience of economies has been uneven based on their exposure to geopolitical shocks and AI-related investments. As per high-frequency indicators, global business activity reached a 40-month high in September.2 Global financial market volatility remained largely contained through September for most of the major economies as the policy rate decisions by the key central banks were broadly priced in. By mid October, however, volatility increased amidst renewed conflict in West Asia, concerns over technology stock valuations, and heightened fiscal risk in the Euro area. Commodity markets exhibited divergent movements with crude oil and food prices firming up, whereas gold prices witnessed a correction. Equity markets exhibited mixed performance across major indices in September, before declining in October. The sovereign bond yields edged up globally driven by tighter financial conditions coupled with fiscal sustainability concerns in some major economies. The US Dollar Index strengthened in September and early October on rising treasury yields. The consequent hardening of external financing conditions drove portfolio outflows from EMEs, turning net flows negative. The Indian economy has withstood the shocks well. The IMF raised India’s growth projection for 2026-27 by 60 basis points (bps) to 7.0 per cent, from its July estimate, citing stronger-than-expected momentum, driven by resilient domestic demand and robust services activity. The high-frequency indicators maintained their upward trajectory. On the supply side, manufacturing grew at a robust pace, while services activity strengthened further on the back of buoyant domestic and external demand. The kharif sowing concluded with total acreage above its normal level amidst deficient and uneven southwest monsoon. The headline Consumer Price Index (CPI) inflation increased to 5.5 per cent (y-o-y) in September, driven by broad-based increase in food, fuel, and core components. Core (excluding food and fuel) inflation inched up to 4.3 per cent. Core inflation excluding precious metals also increased to 3.2 per cent. In the backdrop of elevated inflation expectations and early signs of inflation generalisation, the Monetary Policy Committee raised the policy repo rate by 25 basis points to 5.50 per cent and changed its stance from neutral to calibrated tightening. On the fiscal front, the Union Government’s key deficit indicators – as a percentage of full-year budget estimates – increased in April-August, while that of the state governments declined. The Union Government continued to prioritise infrastructure spending to support investment. Reserve money expanded in September, with currency in circulation recording its highest y-o-y growth in five years. Bank credit growth remained strong. During September and early October, system liquidity remained in surplus, supported by strong inflows under the foreign currency non-resident (bank) [FCNR(B)] deposits swap facility, although the surplus moderated later as the Reserve Bank conducted open market sales. The weighted average call rate (WACR) traded in the lower half of the policy corridor, with some hardening witnessed in the later half of October. Other short-term money market rates, viz., 3-month Treasury Bills, commercial papers (CPs) and certificates of deposit (CDs), hardened following the repo rate hike. The 10-year G-sec yield reached a three-year high, reflecting crude oil prices, US Treasury yields and monetary policy stance. Indian equity markets remained bearish in September and early October amidst escalating geopolitical tensions, elevated crude oil prices and rising global bond yields. India’s external sector remained resilient. India’s merchandise exports grew in double digits for the sixth consecutive month, while gold imports contracted sharply. Export growth was broad-based outpacing imports and trade deficit narrowed in September vis-a-vis the previous year. Services exports continued to record healthy growth in August, while capital flows improved, supported by sustained foreign direct investment (FDI) inflows and a surge in non-resident deposits following the FCNR(B) swap measures. Foreign portfolio investment (FPI) flows, however, remained volatile. External commercial borrowing (ECB) activity strengthened during April-August 2026, with both registrations and net inflows marking an improvement over the previous year. External sector vulnerability indicators remained contained, supported by adequate foreign exchange reserves. After a depreciating bias till early October, the Indian rupee gained following the Reserve Bank’s measures to curb speculative activity in the forex market. The remainder of the article is presented in four sections. Section II covers the evolving developments in the global economy. Section III provides an assessment of domestic macroeconomic conditions. Section IV presents the financial conditions prevailing in India, while Section V offers concluding observations. II. Global Setting Despite confronting a series of shocks during the year, the global economy held up well. IMF in its World Economic Outlook for October 2026 raised its global growth projection for 2026 by 10 basis points as compared to its July 2026 update. Growth is projected to pick up in 2027, assuming reopening of the Strait of Hormuz in March and a broad return to pre-war conditions by October 2027 (Table II.1). Driven by higher energy and food prices, global headline inflation is projected to rise from 4.1 per cent in 2025 to 4.7 per cent in 2026, before easing back to 4.1 per cent in 2027. However, the outlook remains clouded by the risk of prolonged tensions, disruptions to global supply chains, and worsening fiscal and external balances. Notwithstanding better than expected performance of global economy in the first half of 2026, the global uncertainty increased in September amidst renewed geopolitical tensions contributing to energy-price pressures, and heightened trade-policy related risks (Chart II.1a). Financial market volatility remained largely contained in most of the major economies in September. It rebounded in mid October on concerns over renewed conflict and tech stocks valuation. Markets in the Euro area witnessed a rise in volatility in early October amidst concerns over the public debt, particularly that of France. Volatility in emerging market economies (EMEs) edged up in September. After moderating in early October, it subsequently picked up amidst a correction in technology stocks (Chart II.1b). | Table II.1: IMF: GDP Growth Projections of Select AEs and EMDEs | | (Y-o-y, per cent) | | Projection for | 2026 | 2027 | | Month of Projection | July 2026 | October 2026 | July 2026 | October 2026 | | World | 3.0 | 3.1 | 3.4 | 3.4 | | Advanced Economies (AEs) | 1.7 | 2.1 | 1.8 | 1.8 | | US | 2.3 | 2.3 | 2.2 | 2.3 | | UK | 1.0 | 1.3 | 1.3 | 1.2 | | Euro Area | 0.9 | 1.1 | 1.2 | 1.2 | | Japan | 0.6 | 0.7 | 0.7 | 0.7 | | Emerging Market and Developing Economies (EMDEs) | 3.8 | 3.7 | 4.5 | 4.4 | | Russia | 1.1 | 0.9 | 1.1 | 0.9 | | Emerging and Developing Asia | 5.0 | 5.1 | 4.8 | 4.9 | | India* | 6.4 | 7.0 | 6.7 | 7.0 | | China | 4.6 | 4.5 | 4.1 | 4.0 | | Latin America and the Caribbean | 2.4 | 2.3 | 2.7 | 2.5 | | Mexico | 1.2 | 1.5 | 1.9 | 1.8 | | Brazil | 2.4 | 2.2 | 2.2 | 1.9 | | Middle East and Central Asia | 0.7 | -0.3 | 6.5 | 6.3 | | Sub-Saharan Africa | 4.3 | 4.5 | 4.5 | 4.5 | | South Africa | 1.1 | 1.0 | 1.3 | 1.3 | *: Data for India is on a fiscal year basis (April-March), while for all other countries is for calendar years.
Source: IMF World Economic Outlook, October 2026. |
 With the intensification of West Asia tensions, daily transit calls and transit crude volumes through the Strait of Hormuz continued to remain muted (Chart II.2). The expansion in global economic activity, as reflected in the composite Purchasing Managers’ Index (PMI), gathered momentum in September reaching 40-month high. Led by financial services, the services PMI marked sixth consecutive months of acceleration outperforming its manufacturing counterpart for the third consecutive month. New export orders expanded for the second successive month and at the fastest pace in over five years, supported by improved international trade flows (Table II.2). The business activity generally expanded at a faster pace in September, particularly in AEs as compared to EMEs.3 All major AEs, including the US, the UK, the Eurozone, and Japan, recorded expansion. Amongst major EMEs, India and China significantly outperformed others, while Brazil continued to record contraction (Chart II.3a). While new export orders continued to expand in Japan and the Eurozone, it remained unchanged in the US, whereas the UK recorded contraction. Among major EMEs, India and China continued to record expansion in export orders (Chart II.3b). Global commodity prices firmed up in September with the World Bank Commodity Price Index rising sharply, primarily driven by an increase in Brent crude oil prices. The Food and Agriculture Organization (FAO) Food Price Index edged up in September on higher sugar, cereal, and vegetable oil prices, although declining meat prices and stable dairy prices partly offset the rise (Chart II.4a).
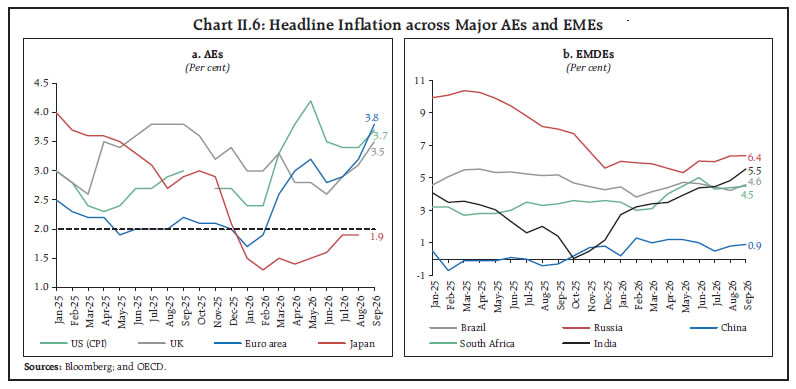
The commodity prices, as indicated by the daily Bloomberg Commodity Index, also edged up in October driven by rise in crude oil prices. Gold prices fell in September weighed by higher US Treasury yields and a stronger US dollar. However, it remained range bound in October as these downward pressures were offset by the uncertainty over the Fed’s policy path and US debt concerns (Chart II.4b). Brent price continued to remain volatile with crude futures reflecting rapidly evolving geopolitical developments (Chart II.4c). Aluminium prices eased to pre-conflict levels in October owing to alternate supplies, even as the supply pressures persisted in the Gulf region. Copper prices remained firm, though below their September peak, amidst low inventories, mine disruption risks and expectations of renewed demand (Chart II.5a). Jet fuel prices remained elevated while gasoline prices eased from their late-September highs (Chart II.5b). Urea prices faced downward pressure in September on increased availability from China, however, they marked a slight uptick during October (till 20th) [Chart II.5c]. LPG prices rose sharply amidst stronger global demand (Chart II.5d). Inflation across most major AEs and EMEs continued to edge upward in September. In the US, the UK and Euro Area, inflation accelerated, driven by higher energy prices (Chart II.6a). Among major EMEs, inflation rose in Brazil driven by cost pressures in food and transportation while it edged up marginally in Russia. Inflation in China inched up as higher energy prices offset deepening food deflation. South Africa’s inflation rate also increased marginally, mainly driven by increase in transportation costs (Chart II.6b). 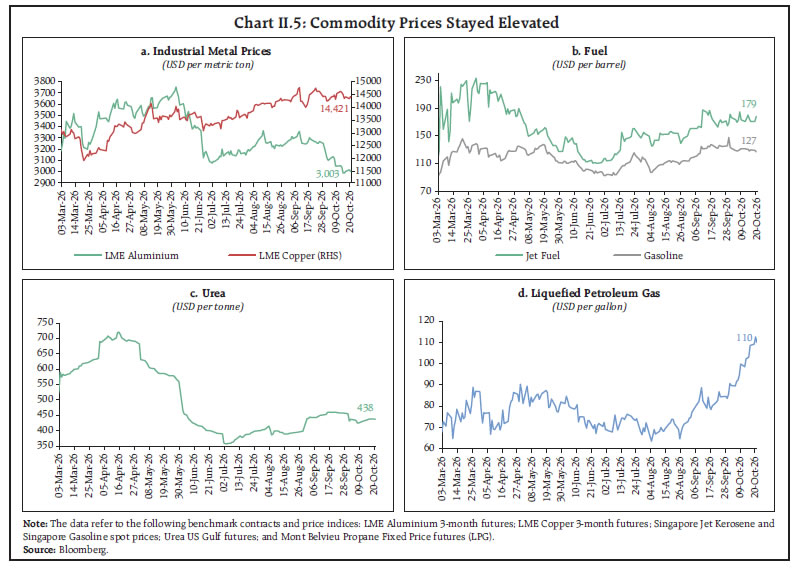
 Global equity indices recorded mixed performance across economies in September, reflecting divergent investor sentiment. Subsequently, equity markets across most of the major economies declined towards the middle of October, driven by a global sell-off in technology stocks and inflationary concerns. In the US, equities were supported by AI-driven technology stocks and optimism over corporate earnings during September. Japan benefited from a weaker yen supporting exporters alongside gains in AI-related stocks. European equities continued to remain under pressure–on rising sovereign bond yields, energy-driven inflation concerns and monetary tightening, weighed further by concerns over France’s fiscal outlook–before rebounding in early October on the back of stronger than expected corporate results. Emerging markets were under pressure amidst FPI outflows, stronger US dollar, elevated crude oil prices and tighter global financial conditions, with the magnitude of losses varying across countries (Chart II.7a). Treasury yields in major AEs rose in September and remained elevated in early October, reflecting expectations of further monetary tightening amidst resilient economic growth, rising debt, persistent inflation, and elevated oil prices (Chart II.7b). In EMEs, sovereign bonds showed a mixed trend reflecting country-specific inflation, fiscal, and monetary policy dynamics in addition to global financial conditions (Chart II.7c). The US Dollar Index strengthened in September and first half of October, supported by elevated treasury yields and tightening of US monetary policy (Chart II.8a). Against this backdrop, portfolio flows to EMEs turned negative, with outflows recorded in both equity and debt segments (Chart II.8b). The re-escalation of geopolitical tensions in West Asia continued to weigh on the growth-inflation trade-off faced by central banks across AEs and EMEs (Chart II.9). Amidst persistent inflationary risks, the US, Japan, Euro area and Australia raised their policy rates in September. Similarly, New Zealand raised its benchmark interest rate, citing higher fuel prices, while Canada, the UK, Sweden and Switzerland kept the rate unchanged. Amongst major EMEs, South Africa raised its policy rate on inflation concerns while Malaysia kept its policy rate unchanged, citing a continued momentum in economic growth. Russia amd Mexico held their policy rates steady. In October, China held the benchmark lending rates steady amidst a stronger Q3:2026 GDP growth. Indonesia kept the policy rate unchanged for the fourth consecutive month amidst equity market volatility and currency pressures.
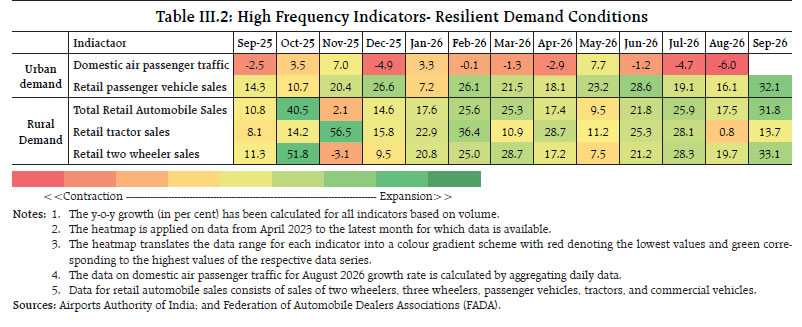
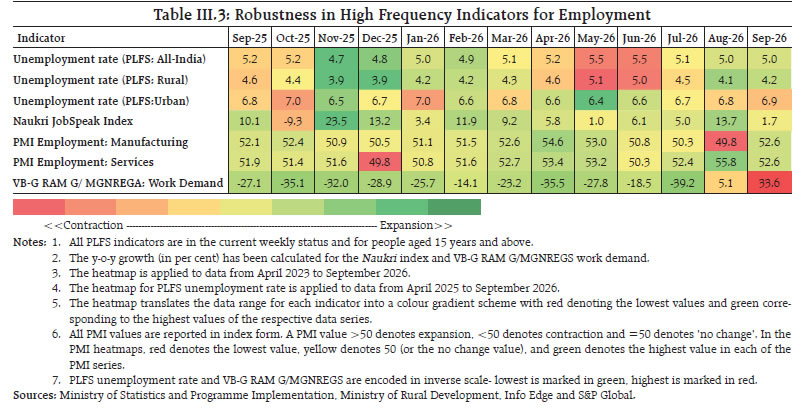
III. Domestic Developments The Indian economy continues to grow at a high rate despite a challenging global environment characterised by geopolitical conflicts, high and volatile crude oil prices, trade policy related uncertainties and tighter global financial conditions. The IMF in its World Economic Outlook for October 2026, revised India’s projected growth for 2026-27 upward to 7.0 per cent citing stronger-than-expected momentum, driven by resilient domestic demand and robust services activity. The monetary policy committee (MPC), raised real GDP growth projection for 2026-27 by 40 bps to 7.1 per cent, as Q1 growth came in higher than expected and momentum held up. CPI inflation projection was revised to 5.2 per cent, reflecting supply-side pressures from a deficient monsoon, El Niño conditions and high energy prices. Due to elevated inflation outlook and early signs of inflation generalisation, the Committee in its October 2026 review, voted unanimously to raise the policy repo rate by 25 bps to 5.50 per cent. The MPC also changed its stance from neutral to calibrated tightening. Aggregate Demand Economic activity remained robust in September as indicated by several high-frequency indicators. The GST revenue recorded double-digit growth for the fourth consecutive month, driven by higher import revenue and decline in refunds.4 The volume of GST E-way bills also increased suggesting sustained domestic trade activity. Toll collection maintained steady growth highlighting robust transport and logistics activity.5 The electricity demand continued to grow at double-digit amidst higher economic activity and prevailing above normal temperature.6 The growth in petrol consumption sustained in September, backed by higher automobile sales. Aviation turbine fuel (ATF) registered a flat growth on the back of elevated prices and subdued air traffic. The consumption of petroleum products recovered aided by the recovery in consumption of petroleum coke and liquefied petroleum gas (LPG).7 Digital payments registered high growth in transaction value, while the growth in transaction volume moderated (Table III.1). Domestic demand remained strong in September. Retail automobile sales in both urban and rural areas picked-up sharply, partially due to base effect.8 The recovery in tractor sales alongside sustained momentum in two-wheeler sales point to robust rural demand (Table III.2). The all-India unemployment rate (based on current weekly status) remained steady at 5.0 per cent in September.9 The overall labour force participation rate (LFPR) and worker population ratio (WPR) were broadly stable10 as improvements in urban areas were offset by weakness in rural areas. Naukri JobSpeak Index y-o-y growth moderated significantly in September, although remained in positive territory with higher growth in auto, information technology enabled services (ITES) and business process outsourcing (BPO) segments. The PMI employment for manufacturing went into an expansionary zone after contraction in the previous month. The PMI employment for services, despite some softening, remained in the expansionary zone. Demand for work under the Viksit Bharat–Guarantee for Rozgar and Ajeevika Mission (Gramin) [VB-G RAM G]11 increased sharply in September (Table III.3). 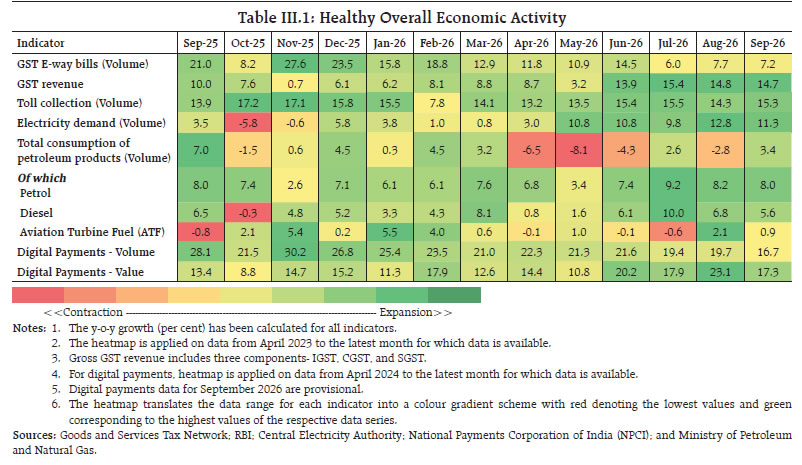
 The Union government’s key deficit indicators— as per cent of the budget estimates—were higher in April-August:2026-27 as compared to the corresponding period last year (Chart III.1a).12 The gross fiscal deficit (GFD) expanded on account of higher revenue expenditure, driven by increase in major subsidies, while interest expenses contracted.13 Non-tax revenue as per cent of budget estimates, also declined from the previous year. The capital expenditure, on the other hand, continued to record double-digit growth for the second consecutive year reflecting government’s thrust on infrastructure-led spending (Chart III.1b).14 During the same period, the States’ key deficit indicators, as a proportion of full year budget estimates, remained lower than the previous year (Chart III.2). The improvement in the GFD was primarily attributable to stronger growth in revenue receipts accompanied by a moderation in overall expenditure. Within revenue receipts, state GST— accounting for the highest share—recorded robust growth, while collections from other sources such as state excise, sales tax, stamp duty and land revenue remained strong. On the expenditure side, both revenue and capital expenditure growth moderated. Trade Both merchandise export and import growth remained robust in Q2:2026-27 as compared to the previous year,15 while trade deficit widened marginally.16 The merchandise trade deficit narrowed (y-o-y) in September over the year, although it expanded sequentially (Chart III.3).17 The trade deficit in electronic goods recorded the highest level in recent years, contributing roughly one-third of the deficit.18
Merchandise exports posted strong growth in September with double-digit growth for the sixth straight month.19 The expansion was broad-based, with ready-made garments, and gems and jewellery recording high growth besides electronic goods, engineering goods and petroleum products.20 The ready-made garments rebounded after a prolonged slack, while other commodities such as marine products, and leather and leather products grew at a modest pace.21 By destination, exports to the US sustained double-digit growth for the third consecutive month.22 Import growth in September was the lowest recorded during 2026-27 so far, driven largely by the slowdown of precious metals growth, with both gold and silver imports contracting in September 2026.23 In contrast, imports of petroleum, crude and products, and electronic goods continued to expand at double-digit.24 Imports from key oil suppliers such as Russia, Oman, Brazil and Nigeria remained robust.25 Net services exports continued to grow at a healthy pace in August, supported by strong growth in exports, even as imports increased at a faster pace (Chart III.4).26 The rise in services exports was primarily driven by business, software, and transport services, while transport, computer and business services supported the growth in services imports. Net transfer receipts, mainly representing remittances, rose by 20.1 per cent (y-o-y) during April-August 2026 despite the West Asia conflict. 27 Aggregate Supply Agriculture The south-west monsoon season (June- September) ended with rainfall of 87 per cent of the long period average (LPA) with uneven spatial28 and temporal distribution (Chart III.5a). Consequently, the reservoir position at the all-India level was at below the decadal average as well as the corresponding level in 2025 (Chart III.5b)29. The kharif sowing ended with the total acreage at one per cent lower than the previous year, but remained above normal levels.30 Across major crops, area sown was higher for pulses, coarse cereals, and oilseeds, and lower for rice, sugarcane, and cotton as compared to the previous year (Chart III.6). The deficient rainfall in certain regions is likely to adversely affect the yields of kharif crops.31
The stock of the staple cereals (i.e. rice and wheat) with the government remains high and comfortable32, reflecting strong procurement operations in the previous rabi and kharif seasons. The increase in minimum support prices (MSP) for the upcoming rabi marketing season (April 2027-March 2028), announced on September 30, 2026, seeks to ensure remunerative prices for farmers in general, while also making an attempt to incentivise crop diversification (Chart III.7).33 Industry and Services Monthly Indicators of Industrial Activity Based on high-frequency indicators, industrial activity remained resilient despite the geopolitical tensions in West Asia. During August, broad-based growth in manufacturing activity pulled up the overall index of industrial production (IIP), even as the mining activity contracted. Manufacturing PMI picked up in September driven by strong domestic and external demand, despite firming up of input cost pressures and output prices. Business confidence reached a four-month high in anticipation of higher demand. 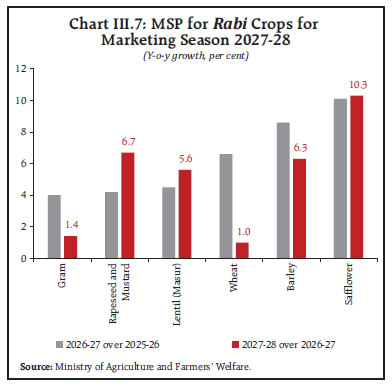 Electricity generation stayed strong. The renewable power’s share in total generation surpassed the 20 per cent mark in August 2026.34 Conventional power generation accelerated in September. Both power demand and the peak power demand reached the highest levels ever recorded in September driven by elevated cooling and irrigation demands. The peak demand in September was close to that in the summer months of May and July.35 Due to demand pressures and contraction in hydropower generation, the peak power deficit reached its highest level since January 2024 (Chart III.8).36 The index of core industries (ICI) picked up sharply in September supported by electricity and refinery products. Automobile production continued to register robust growth, led by passenger vehicles and three-wheelers. The import of capital goods continued its strong growth momentum, aided by electronic goods (Table III.4).
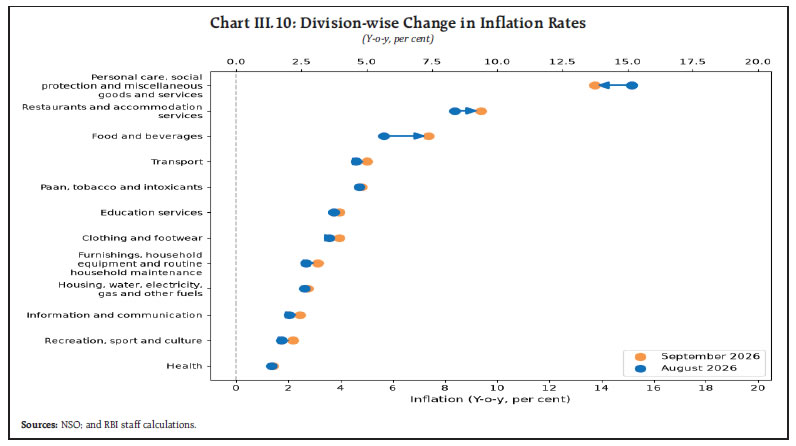
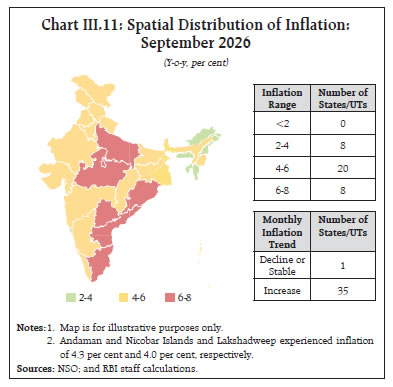
Monthly Indicators of Services Activity Service sector activity remained resilient in September. PMI Services reached a three-month high on the back of strong demand. Trade activity remained resilient with strong freight movement in August. The port cargo traffic in September also recorded its highest growth since December 2025 primarily on account of rise in the shipping of petroleum, oil and lubricant (POL) commodities as iron ore and fertilisers movement softened.37 Steel consumption remained strong suggesting steady construction activity. Retail commercial vehicle sales exceeded the one-lakh mark in September for the first time38, largely attributable to higher infrastructure and mining related activities (Table III.5). Inflation The headline Consumer Price Index (CPI) inflation39 rose to a 23-month high of 5.5 per cent (y-o-y) in September from 4.8 per cent in August, driven by a broad-based increase in food, fuel and core (CPI excluding food and fuel) components (Chart III.9).40 Eleven out of twelve divisions witnessed a sequential increase in inflation (Chart III.10). Within ‘food and beverages’ division, inflation pressures were evident across the board, with notable rise in vegetables, cereals, oils and fats, and sugar. The positive momentum in September was evident with indices for all sub-components of ‘food and beverages’ rising month-on-month (m-o-m) except animal protein (meat, fish and eggs) and fruits. Fuel inflation increased marginally in September over August.41 Inflation in rural areas has been higher than that in the urban areas.42 The majority of States/UTs has recorded inflation in the range of 4-6 per cent in September (Chart III.11).43 Core inflation inched up to 4.3 per cent in September from 4.2 per cent in August, persistently driven by ‘personal care, social protection and miscellaneous goods and services’ on account of high precious metal prices. The momentum also picked up in ‘restaurant and accommodation services’, ‘clothing and footwear’, ‘furnishings, household equipment and routine household maintenance’ and ‘recreation, sport and culture’, indicating broadening of price pressures. Core inflation excluding precious metals increased to 3.2 per cent in September from 2.9 per cent in August. Some estimates of diffusion indices44 reveal that the share of items recording above 4 per cent as well as above 6 per cent inflation went up in September indicating movement towards generalisation of inflation and rising cost pressures (Chart III.12). 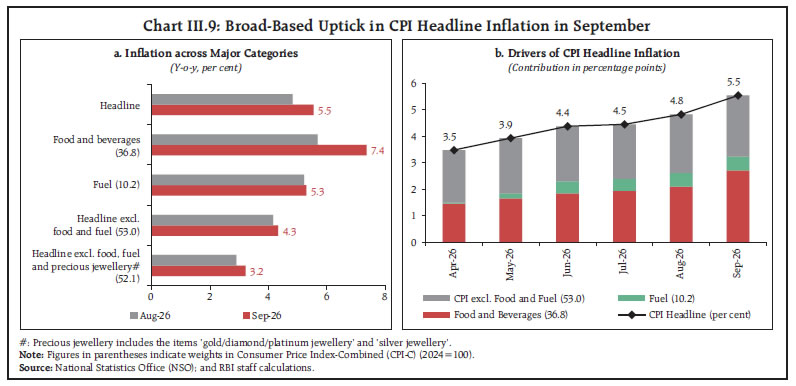
 In October so far (till 19th), high-frequency data suggest broad-based increase in food prices. Among cereals, rice and wheat prices continued to increase. Prices of major pulses also went up sequentially. Edible oil prices also recorded a slow and broad-based increase, led by mustard and palm oil. Among vegetables, while potato prices declined and the pace of onion price increases dropped, tomato prices picked up (Chart III.13). Retail prices of petrol, diesel, and domestic LPG remained unchanged in October so far (till 19th) (Table III.6). The price of the Indian basket crude oil45 increased to US$ 121.3 per barrel in October (till 16th) [Chart III.14]. WPI inflation recorded its first double-digit rate in the new series (Base 2022-23) at 11.4 per cent in September 2026 rising from 9.9 per cent in August, reflecting a broad-based increase in prices46. Industrial and farm input costs remained elevated.47 Inflation in Output Producer Price Index surged to 11.4 per cent in September 2026 from 9.8 per cent in August led by manufacturing products, and mining & quarrying. The pace of expansion in PMI input and output prices increased for manufacturing but moderated for services in September. The gap between input and output prices narrowed for manufacturing but increased for services (Chart III.15).
| Table III.6: Petroleum Product Prices Remained Unchanged in September and October | | Item | Unit | Domestic Prices | Month-over-month (per cent) | | Oct-25 | Sep-26 | Oct-26^ | Sep-26 | Oct-26^ | | Petrol | ₹/litre | 101.1 | 108.7 | 108.7 | 0.0 | 0.0 | | Diesel | ₹/litre | 90.5 | 98.1 | 98.1 | 0.0 | 0.0 | | Kerosene (subsidised) | ₹/litre | 45.4 | 46.8 | 46.8 | 0.0 | 0.0 | | LPG (non-subsidised) | ₹/cylinder | 863.3 | 952.3 | 952.3 | 0.0 | 0.0 | ^: For the period October 1-19, 2026.
Note: Other than kerosene, prices represent the average Indian Oil Corporation Limited (IOCL) prices in four major metros (Delhi, Kolkata, Mumbai and Chennai). For kerosene, prices denote the average of the subsidised prices in Kolkata, Mumbai and Chennai.
Sources: IOCL; Petroleum Planning and Analysis Cell (PPAC); and RBI staff calculations. |
IV. Financial Conditions System liquidity48 remained in surplus during September and early October supported by strong inflows under FCNR(B) swap facility.49 The surplus, however, moderated as the Reserve Bank conducted open market sales.50 The Reserve Bank also conducted fine-tuning variable rate reverse repo (VRRR) and variable rate repo (VRR) auctions to smoothen liquidity.51 The average daily deployment under the Standing Deposit Facility (SDF) declined and the banks’ reliance on the Marginal Standing Facility (MSF) remained low (Chart IV.1).52 Money Market The WACR traded in the lower half of the policy corridor during September and early October (Chart IV.2a).53 The Reserve Bank increased the minimum daily balance of the cash reserve ratio (CRR) to be maintained by scheduled commercial banks from 90 per cent of the required CRR on all days to 99 per cent, effective fortnight beginning October 16, 2026. Moderation in surplus liquidity on account of GST related outflows along with the change in CRR prescription pushed WACR into the upper half of the policy corridor in the second half of October. Overnight rates in the collateralised segment moved in tandem with the WACR. Other money market rates, i.e., 3-month Treasury Bills, CPs and CDs rose after the repo rate hike (Chart IV.2b).54 The spread between 3-month CP and 91-day treasury bill rate increased marginally.55 Government Securities (G-Sec) Market Government security (G-sec) yields firmed up through September and early October with the benchmark 10-year G-Sec yield rising to a three-year high, driven by pick-up in crude oil prices and US Treasury yields (Chart IV.3a).56 The Reserve Bank’s policy rate hike and change of stance to calibrated tightening alongside liquidity absorption measures also impacted expectations. The yield curve shifted upwards in October (up to October 19) compared to the end-September levels (Chart IV.3b).
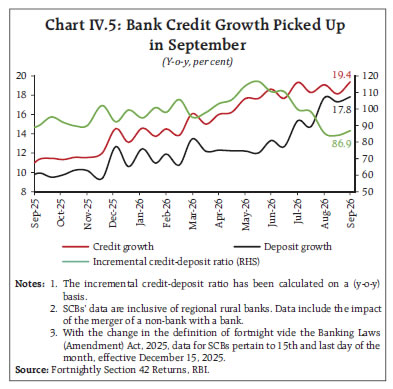
Corporate Bond Market Corporate bond issuances moderated in August as compared to July 2026 and the total issuance remained lower in the year so far.57 Though the corporate bond yields hardened, the spreads softened across tenors and the rating spectrum in October (till 16th) [Table IV.1]. Money and Credit Reserve money (adjusted for CRR) expanded at a robust pace with growth in currency in circulation recording its highest print over the past five years as on September 30, 2026.58 The money supply growth also increased (Chart IV.4).59 Growth in bank credit picked up in September, while deposit growth stayed elevated. The incremental credit-deposit ratio, which declined between June and August 2026, rose in September 2026 (Chart IV.5).60 | Table IV.1: Corporate Bond Yields Hardened and Spreads Softened | | | Yields
(Per cent) | Spread (bps)
(Over corresponding risk-free rate) | | Instrument | September 30, 2026 | October 16, 2026 | Variation
(bps) | September 30, 2026 | October 16, 2026 | Variation | | 1 | 2 | 3 | (4 = 3-2) | 5 | 6 | (7 = 6-5) | | (i) AAA (1-year) | 7.53 | 7.82 | 29 | 148 | 141 | -7 | | (ii) AAA (3-year) | 7.85 | 8.11 | 26 | 123 | 113 | -10 | | (iii) AAA (5-year) | 7.81 | 8.14 | 33 | 105 | 90 | -15 | | (iv) AA (3-year) | 8.63 | 8.84 | 21 | 204 | 186 | -18 | | (v) BBB minus (3-year) | 12.23 | 12.42 | 19 | 562 | 544 | -18 | | Source: Fixed Income Money Market and Derivatives Association of India. |
The total flow of financial resources to the commercial sector increased in the first half of 2026-27 (up to September 30), mainly driven by a pick-up in non-food bank credit and a rise in FDI61 (Table IV.2a). The growth in total outstanding credit to the commercial sector (as on September 30) was considerably higher than the previous year (Table IV.2b). | Table IV.2a: Flow of Financial Resources to Commercial Sector Increased | | (₹ lakh crore) | | Source | April-March | Up to September 30 | | 2024-25 | 2025-26 | 2025-26 | 2026-27 P | | A. Non-Food Bank Credit | 18.08 | 29.19 | 8.47 | 16.07 | | B. Non-Bank Sources (B1+B2) | 18.15 | 18.06 | 7.79 | 9.22 | | B1. Domestic Sources | 14.91 | 12.84 | 5.41 | 5.31 | | B2. Foreign Sources | 3.25 | 5.22 | 2.38 | 3.90 | | C. Total Flow of Resources (A+B) | 36.23 | 47.25 | 16.26 | 25.29 | P: Provisional.
Notes: 1. Figures in the columns might not add up to the total due to rounding off of numbers.
2. For detailed notes and data, please refer to Current Statistics Table No: 18(a).
Sources: RBI; SEBI (Securities and Exchange Board of India); AIFIs (All India Financial Institutions); and RBI staff calculations. |
| Table IV.2b: Higher Outstanding Credit to Commercial Sector | | (₹ lakh crore; Figures in parentheses are y-o-y percentage changes) | | Source | At End-March | As on September 30 | | 2025 | 2026 | 2025 | 2026 P | | A. Non-Food Bank Credit | 183.72
(10.9) | 212.91
(15.9) | 192.19
(11.2) | 228.98
(19.1) | | B. Non-Bank Sources (B1+B2) | 88.86
(14.6) | 101.77
(14.5) | 93.99
(16.1) | 106.77
(13.6) | | B1. Domestic Sources | 66.37
(17.3) | 75.29
(13.4) | 70.47
(19.0) | 78.79
(11.8) | | B2. Foreign Sources | 22.49
(7.2) | 26.48
(17.7) | 23.52
(8.5) | 27.98
(19.0) | | C. Total Credit (A+B) | 272.58
(12.1) | 314.68
(15.4) | 286.17
(12.8) | 335.75
(17.3) | P: Provisional.
Notes: 1. Figures in the columns might not add up to the total due to rounding off of numbers.
2. Data on non-bank sources excludes issuances of equities and hybrid instruments under domestic sources and foreign direct investment in equities under foreign sources.
3. Flows based on outstanding data may not tally with the flows provided in Table IV.2a due to:
(a) Conversion of some Housing Finance Companies into Non- Banking Financial Companies; and
(b) Valuation effect in case of foreign sources.
4. For detailed notes and data, please refer to Current Statistics Table No: 18(b).
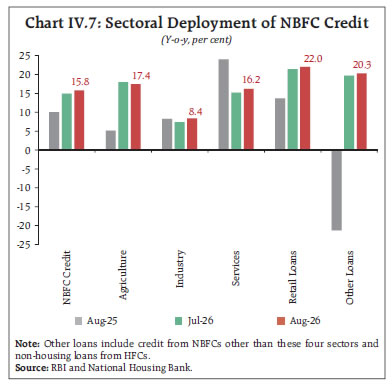
Sources: RBI; SEBI; AIFIs; and RBI staff calculations. | Bank credit growth remained elevated in general across major sectors.62 Industrial credit growth eased marginally due to slower lending to large industries, while MSMEs sustained high credit growth. Credit growth to the services sector remained buoyant, driven by non-banking financial companies (NBFCs), trade and commercial real estate. Personal loans also strengthened, supported by steady growth in vehicle loans segment, despite a marginal dip in housing loans (Chart IV.6). NBFCs’ high credit growth sustained in August 202663, largely driven by retail loans and industrial credit. Retail loans were supported by loans against gold jewellery, housing64 and vehicle loans. Industrial credit was propelled by the infrastructure segment. Credit to the services sector strengthened with robust lending to the trade and transport operators’ segments, even though commercial real estate registered a decline. Agricultural credit continued to grow in double digits (Chart IV.7). Deposit and Lending Rates The weighted average domestic term deposit rates (WADTDRs) and weighted average lending rates (WALRs) of scheduled commercial banks moderated in response to the cumulative 125 basis points (bps) reduction (February 2025 to August 2026) in the policy repo rate (Table IV.3). The transmission to WADTDR on fresh term deposits strengthened in August, supported by softening of the bulk deposit rates. The loan composition effect in terms of change in relative weights in the credit portfolio somewhat dampened the overall transmission to WALR on fresh rupee loans. 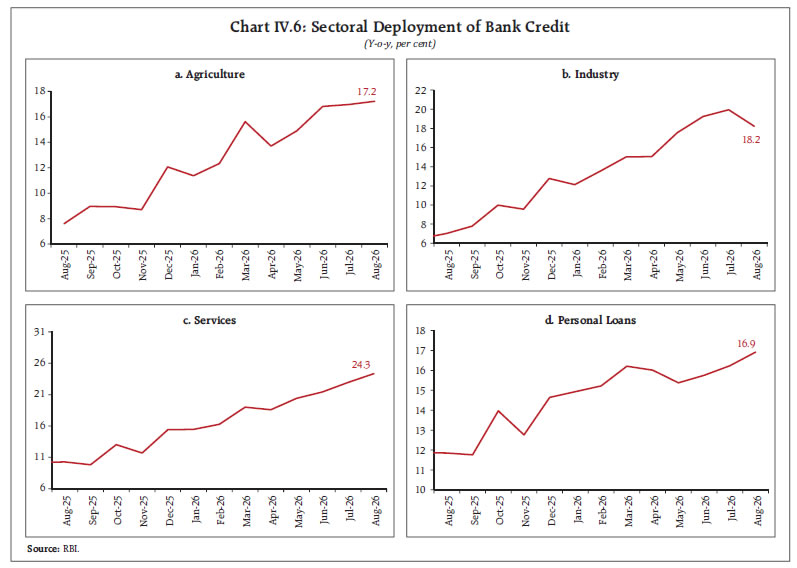
 The policy transmission to lending and fresh deposit rates was stronger in private banks than in public sector banks during February 2025– August 2026. Over the recent months (July–August 2026), private banks recorded relatively the largest reduction in fresh WADTDR, while their WALR on fresh rupee loans hardened (Chart IV.8). Although transmission to lending rates was broad-based across sectors over the easing cycle, WALR on fresh rupee loans hardened in most sectors during July-August 2026 (Chart IV.9). Equity Markets Indian equity markets remained mostly bearish in September and October (till 19th) amidst rising risk-off sentiment with escalating geopolitical tensions, elevated crude oil prices and tightening financial conditions. Bearish foreign institutional investor (FII) sentiment weighed on foreign equity inflows, although domestic institutional investors (DIIs) extended support and remained net buyers (Chart IV.10). | Table IV.3: Transmission to Banks’ Deposit and Lending Rates | | (Basis points) | | | | Term Deposit Rates | Lending Rates | | Period | Repo Rate | WADTDR-Fresh Deposits | WADTDR-Outstanding Deposits | EBLR | 1-Year MCLR (Median) | WALR - Fresh Rupee Loans | WALR-Outstanding Rupee Loans | | Overall | Interest Rate Effect# | | (1) | (2) | (3) | (4) | (5) | (6) | (7) | (8) | (9) | Tightening Cycle
May 2022 to Jan 2025 | 250 | 259 | 206 | 250 | 175 | 182 | 191 | 115 | Easing Cycle
Feb 2025 to Aug 2026 | -125 | -95 | -53 | -125 | -30 | -72 | -76 | -91 | | Memo | | | | | | | | | | Jun-2026 | 0 | 15 | 1 | 0 | -15 | 2 | 6 | -1 | | Jul-2026 | 0 | -10 | 0 | 0 | 10 | -1 | 4 | 1 | | Aug-2026 | 0 | -18 | -2 | 0 | 10 | 9 | -1 | -1 | #: Calculated at January 2025 weights.
WALR: Weighted average lending rate; WADTDR: Weighted average domestic term deposit rate.
MCLR: Marginal cost of funds-based lending rate; EBLR: External benchmark-based lending rate.
Note: Data on EBLR pertain to 32 domestic banks.
Source: RBI. |
External Sources of Finance FDI flows continued to remain robust in August 2026, supported by strong gross inflows and moderation in outward FDI (Chart IV.11a).65 Communication, miscellaneous services and manufacturing received more than two-thirds of the FDI inflows. The US, Singapore and Mauritius were the major source countries, accounting for about 72 per cent of FDI inflows. Outward FDI flows moderated in August with more than half being directed towards Singapore, the Netherlands, and the USA. The major sectors of outward FDI were agriculture & mining, financial, insurance & business services, and manufacturing – together accounting for more than two-thirds of the outward flows (Chart IV.11b).
FPI flows to India, and other emerging market portfolio flows, have seen a net sold position since September, driven by the re-escalation of tensions in West Asia, elevated crude oil prices and rising global bond yields (Chart IV.12).66 Net inflows under non-resident deposits surged in August 2026,67 mainly supported by an increase in FCNR(B) deposits on account of special USD-INR forex swap facility of the RBI.68 Consequently, the share of FCNR(B) deposits in total outstanding non-resident deposits rose sharply at end-August 2026 (Chart IV.13).
Offshore fundraising through ECBs strengthened during April-August 2026, with both registrations and net inflows rising over the year.69 In August, net ECB inflows increased to US$ 3.0 billion from a net outflow of US$ 0.3 billion a year ago (Chart IV.14).70 Around 33.6 per cent of the ECBs registered were mobilised for capital expenditure. India’s current account deficit narrowed to $5.2 billion in August 2026 from US$6.1 billion in August 2025 due to lower merchandise trade deficit and higher surplus in services trade and net transfers. Strong capital inflows supported by FCNR(B) deposits helped the overall balance of payments record a surplus of US$ 45.4 billion in August. India’s foreign exchange reserves remain comfortable, providing a cover for 10.6 months of goods imports (as on October 16) and 92.7 per cent of the external debt outstanding as at end-June 2026 (Chart IV.15).71 India’s key external sector vulnerability indicators, viz., external debt-to-GDP ratio, net international investment position (NIIP) to GDP ratio, debt service ratio and short-term debt (residual maturity) to reserves remained contained at end-June 2026 (Chart IV.16). India’s external debt rose by 4.2 per cent (y-o-y) to US$ 778.2 billion at end-June 2026. As on end-June 2026, net claims of non-residents on India increased by US$ 16.5 billion during Q1:2026-27 to US$ 220.3 billion, reflecting a rise in external liabilities and decline in external assets. Consequently, the ratio of India’s external assets to external liabilities moderated to 84.6 per cent from 85.7 per cent in the previous quarter. The share of debt liabilities in total external liabilities continued its gradual upward trend since end-March 2022 and stood at 56.9 per cent as on end-June 2026 (Chart IV.17).
Foreign Exchange Market The Indian rupee (INR) exhibited a depreciating bias since late-September owing to a stronger US dollar and surging crude oil prices. INR appreciated subsequently in mid-October supported by the Reserve Bank’s measures72 to curb speculative dollar demand and softer US dollar (Chart IV.18). In real effective terms, the INR appreciated in September driven by higher domestic inflation vis-à-vis major trading partners and appreciation of INR in nominal effective terms (Chart IV.19).
V. Conclusion Global economy is currently passing through a rough phase with multiple shocks. Although IMF has revised upwards the global economic outlook for 2026 and 2027, the prospect remains clouded by significant downside risks. Rising inflationary pressures induced by West Asia crisis and recurrent trade tensions, alongside multi-decade-high sovereign bond yields, elevated public debt, and broader fiscal sustainability concerns are looming large. Some silver linings are evident in the form of positive technology shocks and related dividends from AI. Navigating this environment, the Indian economy has been anchored by solid macroeconomic fundamentals and policy interventions to cushion downside risks. Despite being a net energy importer, GDP growth has been supported by sustained domestic demand and services. Headline CPI inflation edged up over the months and showed signs of greater generalisation across commodities calling for a commensurate change in the monetary policy stance. The external headwinds are also being dealt with a slew of regulatory measures by the Reserve Bank to curb speculative activity in foreign exchange market. Strong inflows under FCNR(B) swap window augmented reserves. FDI, ECB and remittance flows strengthened in August. With strong exports growth, the trade deficit narrowed in September.
|