The pandemic’s financial fallout was superimposed upon certain pre-existing vulnerabilities in India’s financial sector, constraining the possibility of a finance-led growth. Going forward, credit revival hinges, among other factors, on how effectively and quickly the financial sector is de-stressed. To become conduits of growth, banks need to direct greater credit towards productive sectors of the economy. The established mechanisms of IBC, NARCL and NaBFID need to be harnessed more efficiently while lenders need to accept haircuts to kick-start the economic recovery process. Deeper and more vibrant corporate debt and stock markets will go a long way in channelising resources for growth. The long strides taken in the digital finance arena need to be leveraged to promote growth, bolster financial inclusion, and combat inequalities. In the cascade of policy priorities, greater focus needs to be given to green finance to achieve the goal of ‘Net Zero’ by 2070. 1. Introduction V.1 The Indian financial sector came under severe stress during the pandemic. With illiquidity and risk aversion becoming pervasive and heightened uncertainty clouding the near-term outlook for income and employment, the Reserve Bank faced the twin challenge of preserving financial stability and mitigating the ravages of COVID-19. Through conventional and unconventional measures, financial conditions were quickly eased to avert liquidity concerns while supporting business continuity and recovery. Regulatory measures were carefully calibrated to shore up the health of the financial system. As the Indian economy recovered from the deep recession in H1:2020-21, an advocacy started to gain ground for pursuing a finance-led growth strategy, accompanied by necessary reforms (Panagariya, 2020; Kant, 2019). V.2 Banking and market finance often complement each other and the positive effects of bank credit on growth, capital accumulation, and productivity enhancement become more pronounced when stock markets are active and developed (Botev et al., 2019). In the recent period, innovations in the realm of digital payments and FinTech — such as alternative lending, platform-based insurance, online trading, electronic remittances, crowd funding, robo-advisory services, etc. — have made banks and other financial institutions more efficient. A new breed of peer-to-peer lenders (P2P) has emerged, meeting the credit requirements of marginalised borrowers. FinTech is also becoming instrumental in providing a range of non-financial services, enabling a seamless customer experience to users via integration with application software (Bank of Japan, 2018). V.3 The major motivation of this Chapter is to assess the sustainability of a finance-led growth strategy and suggest reforms that could enhance the contribution of finance to growth post-COVID. The chapter begins by assessing the impact of COVID on the financial system in Section 2. India specific financial intermediation challenges faced in the pre-COVID period, which may continue to constrain the contribution of finance to growth post-COVID, are set out in Section 3. Section 4 elaborates various policy options available at this juncture to manage challenges faced by the financial sector. Recognising that the pandemic coincided with the beginning of a new digital finance era, Section 5 evaluates its potential contribution to financial inclusion and growth. As India grapples with climate change risks and strives towards ‘Net Zero’ by 2070, green finance will require greater policy attention, which is addressed in Section 6. Finally, Section 7 concludes the chapter with a discussion on the way forward. 2. COVID Impact on the Indian Financial System V.4 As a first reaction to the pandemic-related lockdowns, supply chains froze, demand declined, and precautionary/ forced savings increased due to lack of opportunities to spend, particularly on contact-intensive services. The confluence of these factors resulted in a sharp decline in credit growth even as deposits increased, affecting banks’ net interest margins (Chart V.1). A fall in yields in the bond market provided a silver lining, as banks booked profits on their trading accounts. Measures such as loan moratorium, asset quality standstill and restructuring of loans provided temporary relief to borrowers as well as lenders, although some banks faced depleted profitability. Banking stocks were affected particularly adversely as compared to other sectors, as markets priced in future asset quality deterioration, affecting shareholder wealth and confidence (RBI, 2021a). 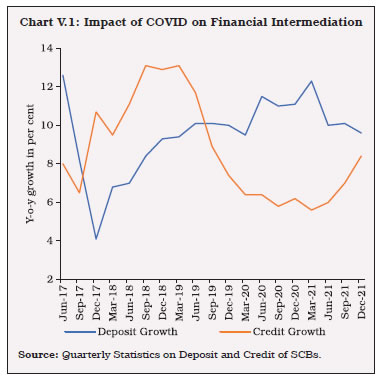 V.5 Dispelling market concerns about potential financial stability risks, banks’ gross as well as net non-performing assets (NPAs) have moderated while provision coverage ratios (PCRs), capital buffers as well as profitability indicators have improved in 2021-22, relative to pre-pandemic levels (Table V.1). | Table V.1: Impact of COVID-19 on Key Banking Indicators | | (Per cent) | | Indicators | Public Sector Banks | Private Sector Banks | Scheduled Commercial Banks | | Mar-20 | Mar-21 | Dec-21 | Mar-20 | Mar-21 | Dec-21 | Mar-20 | Mar-21 | Dec-21 | | Capital to Risk Weighted Assets Ratio (CRAR) | 12.9 | 14.0 | 14.3 | 16.6 | 18.4 | 18.2 | 14.8 | 16.3 | 16.3 | | GNPA Ratio | 10.8 | 9.4 | 8.2 | 5.1 | 4.7 | 4.2 | 8.3 | 7.3 | 6.5 | | NNPA Ratio | 4.0 | 3.2 | 2.7 | 1.4 | 1.4 | 1.2 | 2.9 | 2.4 | 2.0 | | Provision Coverage Ratio (Without write-off adjusted) | 64.2 | 66.4 | 67.8 | 72.6 | 70.9 | 73.1 | 66.2 | 67.4 | 69.1 | | Return on Assets (RoA) | -0.29 | 0.29 | 0.54 | 0.51 | 1.22 | 1.32 | 0.11 | 0.70 | 0.86 | | Return on Equity (RoE) | -4.23 | 4.62 | 8.30 | 4.47 | 10.50 | 11.08 | 1.21 | 7.88 | 9.36 | | Source: Supervisory Returns. |
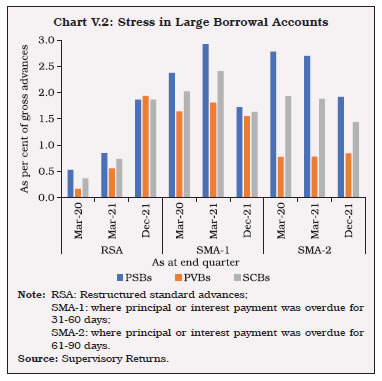 V.6 A closer look at granular data, however, reveals a more nuanced picture. Despite the recovery in economic activity since H2:2020-21, credit growth remains muted, indicative of pandemic scarring as also risk aversion of banks. Although non-banking financial companies (NBFCs) stepped up their lending operations during the pandemic period, concerns have emerged about their asset quality. Under the Reserve Bank’s resolution framework 1.0 and 2.0, the restructured standard advances of large borrowal accounts have increased as compared to the pre-pandemic level (Chart V.2). As support measures start unwinding, their asset quality will become clearer and some of them may require additional provisioning. V.7 The COVID outbreak stifled risk appetite, resulting in a hardening of money market rates, widening of risk spreads, and a drop in equity market indices. The Reserve Bank responded proactively with a flurry of policies aimed at easing financial conditions while maintaining macro-financial stability. Empirical research highlights the healing impact of these measures on financial market conditions and borrowing costs of agents in the economy. Event study analysis around the announcement dates for Operation Twist (OT) and Long-Term Repo Operations (LTROs) indicates that these operations led to a significant reduction in G-sec yields (Das et al., 2020). Moreover, the OT announcements helped reduce the term spread between 10-year and 1-Year G-secs, thereby, flattening the yield curve (Talwar et al., 2021). 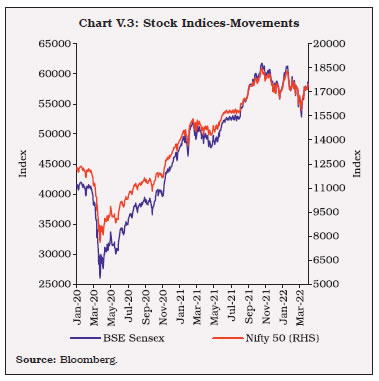 V.8 The Indian equity market witnessed a V-shaped recovery with the BSE Sensex and Nifty 50 doubling by February 2021 from their March 2020 lows (Chart V.3). The buoyant secondary market conditions reduced risk perceptions and enabled companies to tap resources from the primary market, particularly from June 2020. Resource mobilisation through Initial Public Offerings (IPOs), Follow-on Public Offerings (FPOs) and Rights Issues increased to record levels (Chart V.4). Stock market valuations measured by P/E ratio, market capitalisation to GDP ratio and the cyclically adjusted ‘P/E 10’ (or the Shiller P/E ratio) reached above their respective long-term averages by the end of 2021 (RBI, 2021b). The recent price corrections have, however, moderated the valuations. 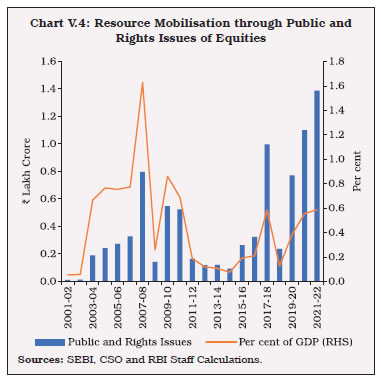 V.9 In the post-pandemic period, the yields on corporate bonds fell to their lowest levels since 2004. The risk premium or spread on AAA-rated 3-year bonds (over 3-year G-sec) decreased from 122 bps to 23 bps for public sector undertakings, financial institutions and banks; from 203 bps to 37 bps for NBFCs and from 169 bps to 26 bps for corporates between March 2020 and March 2022. The narrowing of spreads was also visible across the rating segments of corporate bonds. Liquidity infusion by the Reserve Bank played a key role in supporting primary corporate bond issuances which increased to a record ₹7.82 lakh crore during 2020-21 before moderating to ₹6 lakh crore during 2021-22 (Chart V.5a). Further, the number of issuances by ‘A’ and ‘BBB’ rated borrowers increased sharply during 2020-21 (Chart V.5b). Thus, Reserve Bank’s measures helped in bringing normalcy to various segments of financial markets and eased financial conditions which, in turn, helped in kick-starting growth engines through the financial channel (Box V.1). 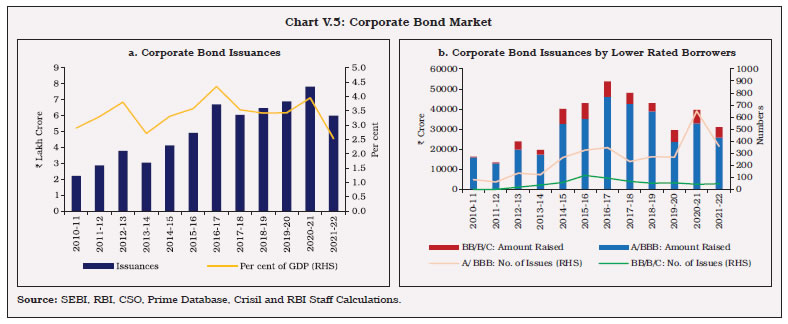
Box V.1
Financial Conditions Index (FCI) and Growth The FCI for India is constructed by applying three different aggregation techniques, i.e., Principal Component Analysis (PC), Quasi Maximum Likelihood (ML) estimator, and Two-step Estimator (TS) approaches to monthly data from March 2003 to March 2022 covering a set of five different market-based indicators which are directly or indirectly affected by the Reserve Bank’s monetary and liquidity measures (Table 1). Among the indicators, the market sentiment index captures forward-looking market expectations. Each indicator has been standardised and transformed to ensure comparability across market indicators. A higher FCI indicates tighter financial conditions and vice versa. The outbreak of COVID-19 immediately resulted in a surge in spreads and volatility. In response to the monetary, liquidity, regulatory and fiscal stimulus measures, there was a sharp decline in the FCI, indicative of easing of financial conditions, similar to what was last witnessed in the immediate aftermath of the global financial crisis (GFC) (Chart 1). | Table 1: List of Variables used for FCI | | Components of FCI | Measures of each component (and Source) | | Term/Risk Spreads | Term spread: 10-Yr G-Sec Yields minus 91 Day T-bill rate (Bloomberg)
Corporate Spread: 5-Yr AAA Yields minus 5-Yr G-Sec Yields (Bloomberg) | | Market Volatility/ Sentiment | India’s Economic Policy Uncertainty [EPU] (Baker et al., 2016) | | Liquidity | Weighted average call rate (WACR) minus Repo Rate (Bloomberg) | | Exchange Rate | Bilateral INR/USD exchange rate (Bloomberg) | | WACR | Weighted average call rate (DBIE) |
The empirical strategy adopted for evaluating the relationship between FCI and GDP is as under: where, yt is the (i) seasonally adjusted, year-on-year growth in GDP in quarter t, (ii) seasonally adjusted, annualised quarter-on-quarter rate of growth in quarterly GDP in quarter t; FCIt is the value of the FCI in quarter t and h is the forecast horizon (Table 2). The results show that for every 1 percentage point easing of financial conditions, y-o-y GDP growth is estimated to improve in the range of about 1.1 to 1.3 percentage points; thus, the GDP growth would have been lower by about 1.1 to 1.3 percentage points without the support of easy financial conditions. | Table 2: Regression Results | | | (1) | (2) | (3) | (4) | (5) | (6) | | GDP Y-o-Y Seasonally Adjusted | GDP Y-o-Y Seasonally Adjusted | GDP Y-o-Y Seasonally Adjusted | GDP Q-o-Q Seasonally Adjusted | GDP Q-o-Q Seasonally Adjusted | GDP Q-o-Q Seasonally Adjusted | | Own Lag | 0.64***
(0.088) | 0.64***
(0.088) | 0.60***
(0.089) | -0.04
(0.121) | -0.04
(0.121) | -0.05
(0.121) | | FCI_ML(-1) | -1.11***
(0.385) | | | -2.88***
(1.302) | | | | FCI_TS(-1) | | -1.12***
(0.383) | | | -2.96***
(1.292) | | | FCI_PC(-1) | | | -1.26***
(0.386) | | | -3.15***
(1.288) | | Constant | 2.74***
(0.693) | 2.75***
(0.693) | 2.99***
(0.701) | 7.87***
(1.17) | | 7.96***
(1.164) | | Note: Reduction of FCI indicates easing financial conditions. | Reference: Baker, S. R. Bloom, N., & Davis S. J. (2016), “Measuring economic policy uncertainty’’, The Quarterly Journal of Economics, 131(4), 1593 - 1636. | 3. Pre-COVID Financial Intermediation Challenges V.10 The pandemic’s financial fallout was superimposed upon some pre-existing vulnerabilities in India’s financial sector. Using a broader measure of flow of resources to commercial sector1 – rather than only bank credit – as recommended by the Basel Committee on Banking Supervision (2011), it is observed that India’s credit to GDP gap2 has been negative in most of the quarters since 2014 (Chart V.6). V.11 For more than a decade, India’s saving rate, especially from the general government, has been declining, with an 18-year low in 2020-21 (Chart V.7a). Moreover, the corporate sector’s demand for credit from the banking sector has decelerated partly reflecting subdued GDP growth (Chart V.7b). V.12 Close to 35 per cent of corporate debt liability is owed to banks (Chart V.8a). Indian corporates deleveraged during the pandemic benefitting from the low-cost ample liquidity conditions created by the Reserve Bank (Chart V.8b). In the recovery from the pandemic, larger corporates with better balance sheets will most likely move towards greater equity and low-cost debt finance. Banks’ lending operations may get skewed towards smaller and more financially weaker borrowers.
V.13. The credit boom during 2003 to 2007 and the bust post-GFC suggests that beyond a threshold, the credit cycle generally turns down and amplifies build-up of stress in the banking sector (Chart V.9). Empirical evidence suggests that in the case of India these thresholds range from 16 per cent to 18 per cent credit growth, controlling for various macroeconomic factors (Box V.2). V.14 Empirical estimates based on the average credit-to-GDP ratio (0.5), and lost growth over two years due to the pandemic led disruptions, suggest that an annualised growth of around 13 per cent in non-food bank credit will be required to achieve the target of US$ 5 trillion economy by 2026-27 – well within the estimated threshold. These estimates are, however, sensitive to underlying assumptions about variables, sample period for estimation, and the choice of methodology. V.15. After reaching a peak of 11.2 per cent in March 2018, the GNPA ratio declined mainly due to the resolution of stressed assets under the Insolvency and Bankruptcy Code (IBC). Write-offs of bad loans also contributed to the decline of stock of GNPAs. Although the GNPA ratio is declining and provision coverage ratio is inching up, the stock of unresolved NPAs in banks’ balance sheet remains high. 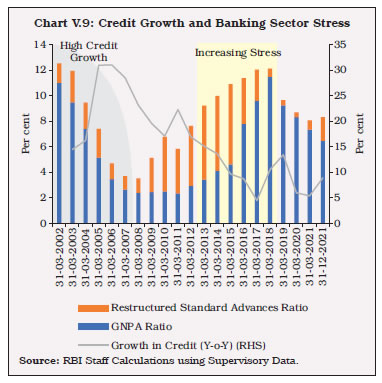
Box V.2
Optimal Credit Growth in India What is the threshold level of credit growth up to which it fuels economic growth but beyond which it results in a build-up of systemic risks? To answer this question, bank-level quarterly data from the Reserve Bank’s Basic Statistical Returns (BSR) and Off-Site Surveillance and Monitoring System (OSMOS) for 29 Indian banks from 2005 to 2021 was employed. Chart 1 shows that PSBs consistently had higher NPA ratios as compared with their private sector counterparts. A panel regression is run to empirically evaluate the relationship between gross NPAs and credit growth while controlling for various macroeconomic as well as bank-specific factors, such as capital to risk weighted assets ratio (CRAR), return on assets (RoA), operating expenses, and the asset size of banks3. The results confirm the existence of a non-linear relationship between GNPA and credit growth. As expected, the results also show that a higher capital adequacy ratio, higher return on assets, size (measured by total assets), and lower operating expenses are associated with lower GNPA ratio (Table 1). Results of a threshold regression in line with Wang (2015) suggest that there is no single global minimum but an ‘elbow curve’ exists, with multiple turning points in the range of 16 to 18 per cent credit growth, beyond which, credit growth may lead to a rise in GNPA ratio. This is not surprising since the period under consideration was characterised by structural regime shifts such as the Global Financial Crisis (GFC). Thresholds are lower for public sector banks (PSBs) than private sector banks. Although PSBs still claim the lion’s share in outstanding credit, much of the weakening of incremental momentum in total bank credit flows has occurred against the backdrop of elevated stressed assets in their balance sheets. Private sector banks (PVBs) have used this opportunity to increase their share in lending. 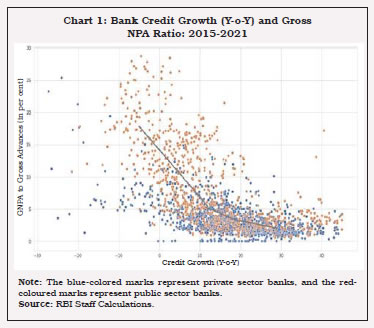
| Table 1: Optimal Credit Growth | | Model | 1 | 2 | 3 | 4 | | Dependent variable = Gross NPA Ratio | | lag (t-i) | (t-2) | (t-3) | (t-4) | (t-5) | | Bank Credit Growth(t-i) | -0.08*** | -0.06*** | -0.03* | -0.03* | | | (.02) | (0.02) | (0.02) | (0.02) | | (Bank Credit Growth(t-i))2 | 0.0003*** | 0.0003*** | 0.00015** | 0.00012* | | | (0.00) | (0.00) | (0.00) | (0.00) | | Control variables | | CRAR | -0.25* | -.35** | -0.40*** | -0.45*** | | | (0.13) | (0.14) | (0.15) | (0.16) | | Return on Assets (RoA) | -3.02*** | -3.00*** | -2.96*** | -2.81*** | | | (0.27) | (0.28) | (0.33) | (0.32) | | Log Total Assets (Size) | -0.44* | -0.57** | -0.67** | -0.71** | | | (0.27) | (0.25) | (0.27) | (0.29) | | Log Operating Expenses | 0.07 | | | | | | (0.16) | | | | | GDP Growth(t-i) | 0.02 | 0.04 | 0.01 | 0.01 | | | (0.02) | (0.02) | (0.01) | (0.03) | | Dummies: | | Demonetisation Dummy | 1.79*** | 1.83*** | 2.06*** | 2.14*** | | | (0.41) | (0.43) | (0.45) | (0.47) | | AQR Dummy | 1.73*** | 1.99*** | 2.18*** | 2.27*** | | | (0.59) | (0.51) | (0.55) | (0.52) | | Constant | 15.34 | 18.10 | 19.5 | 20.4 | | R2 | 0.69 | 0.65 | 0.61 | 0.60 | | No. of observations | 1,484 | 1372 | 1260 | 1148 | | Prob>P | 0.00 | 0.00 | 0.00 | 0.00 | | Note: Growth: Y-o-Y growth in per cent; Parenthesis values report standard errors. | Reference: Wang, Q. (2015), “Fixed-Effect Panel Threshold Model using Stata”. The Stata Journal, 15(1), 121-134. | V.16 Latest stress test analysis in the Financial Stability Report, December 2021 suggests that banks’ GNPA ratio may be in the range of 8.1 (baseline) - 9.5 (under severe stress) per cent by September 2022, from 6.5 per cent in December 2021, which will raise banks’ provisioning and, in turn, capital requirements. While regulatory requirements like COVID-19 provisions and restrictions on distribution of dividends have helped in boosting the provision coverage ratio, further capital infusion by the Government coupled with proactive resource raising efforts by banks would be necessary for strengthening their capital buffers. V.17 Increased provision and capital buffer requirements, which are essential for financial stability can lead to risk aversion in banks, partially dampening credit growth (Chart V.10a). In addition, banks’ portfolios are getting increasingly skewed towards investment in Government securities and lending to retail sector (Chart V.10b and Chart V.11a). While G-sec is a low risk investment, it carries the risk of transforming the system into ‘G-sec investment oriented banking’ if sustained for a long period. Lending to retail sector yield comparatively better returns. However, its multiplier impact to kick-start economic growth is likely to be less than credit to industries. Moreover, rising NPAs in the retail segment is another source of concern (Chart V.11b). V.18 The corporate bond market in India has been mostly restricted to top-rated bonds. 97 per cent of the issuances and trading in corporate bond market is in just the top three rating categories of AAA, AA+ and AA. In contrast, in the US, only 5 per cent of the corporate bond market trading occurs in the top rating buckets of AAA and AA and around 75 per cent of the trading happens in the next three rating buckets of A, BBB and BB (Tyagi, 2020).
4. Reinvigorating Credit Growth – Policy Options V.19 Empirical evidence suggests that while low-cost liquidity may be necessary, that alone is often not sufficient for ensuring a robust recovery in credit growth; rather, it also hinges on how quickly the banking sector is de-stressed (Bhadury et al., 2021). Debt Restructuring V.20 World over, debt restructuring is used to help corporates weather financial crises. The challenges are how to facilitate and incentivise timely debt restructuring while distinguishing viable firms from the rest and how to attract new capital. In India, the overall extent of restructured accounts post-pandemic increased but still has remained low as compared to historical highs (Chart V.9). Insolvency and Bankruptcy V.21 The Reserve Bank’s Prudential Framework coupled with the Insolvency and Bankruptcy Code (IBC), provide a framework for time-bound resolution through collective decision making by the creditors. During October-December 2021, 195 fresh cases were invoked under the IBC, marginally above the number of cases invoked in the two preceding quarters. Out of these, around 58 per cent cases were invoked by operational creditors while 35 per cent were initiated by financial creditors. V.22 The IBC has, however, faced its share of teething troubles. Despite the central theme being speedy resolution to kick-start the economic growth cycle as opposed to ‘creative destruction’ through liquidation, 46.6 per cent cases resolved so far had to resort to liquidation. Also, as against the deadline of 330 days, average time taken by cases for resolution was 512 days. V.23 In the pre-pandemic period, the recovery rate4 under IBC was 46.0 per cent,5 which dropped to 20.2 per cent6 during 2020-21, partly reflecting suspension of initiation of fresh cases as also the overall economic slowdown. Data for the pre-pandemic period suggests that realisation by financial creditors varies significantly across firms and sectors; typically, sectors deemed to have better economic prospects, and companies which have good organisational value received higher realisations. As the contact sensitive industries felt the brunt of the pandemic most severely, realisation from them may be much lower than the industry average, going forward. V.24 There is a need to expand the ambit of pre-pack mechanism, presently available to MSMEs, to larger corporates. This mechanism combines the cost-effective nature of out-of-court settlements with the legal sanctity available in the IBC framework. V.25 Another major hurdle faced by the IBC process is lack of adequate infrastructure. Although efforts have been made in recent years to increase the number of National Company Law Tribunal (NCLT) benches and to train more insolvency professionals, the capacity needs to be enhanced further. Asset Reconstruction Companies (ARCs) and Bad Bank V.26 Apart from recovery through various resolution mechanisms, banks also clean up balance sheets through sale of NPAs to asset reconstruction companies (ARCs) for a quick exit using provisions of the Securitisation and Reconstruction of Financial Assets and Enforcement of Securities Interest Act, 2002 (SARFAESI). While the amount recovered through ARCs as per cent of amount involved was significantly higher in the initial years of their inception, in the recent years it dipped before getting revived to 41 per cent in 2020-21 (Chart V.12). 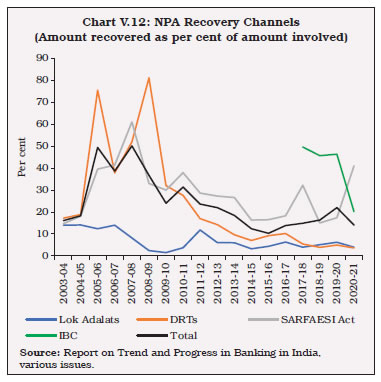 V.27 Banks’ reluctance to assume haircuts, especially when the counterparty is a private ARC is one of the major hurdles behind subdued appetite for this route. As such, the ARC model for debt resolution has had limited success in the Indian context. The recently established National Asset Reconstruction Company Ltd. (NARCL) has the potential to serve as an efficient mechanism to revive investor interest in primary as well as secondary markets for stressed assets and security receipts (SRs), respectively. Going forward, however, continued policy support, professional staff and transparency in operations will be essential in making the exercise cost and time effective (Herwadkar et al., 2022). Capital Infusion in Banks V.28 The Government has infused ₹2.9 lakh crore in the last five years in PSBs, including the recapitalisation of ₹ 4,600 crores7 in 2021-22 (Chart V.13). This helped PSBs to improve their CRAR to 14.3 per cent by December 2021 from 11.8 per cent in March 2016. Capital infusion has also helped many weak PSBs to come out of the prompt corrective action framework. V.29 Absence of market discipline, implicit government guarantees, and repeated unconditional recapitalisation of PSBs could pose a moral hazard problem. To deal with it, an incentive mechanism should be established and banks with better performance in terms of loan recovery and asset quality improvement should be given priority in terms of access to fresh capital. However, capital infusion should not become a substitute for better governance and risk controls. Bank Consolidation V.30 Notwithstanding some initial hiccups, factors like government ownership, similar pay structure and career progression avenues for staff, and common core banking solutions helped smoothen the operationalisation of bank mergers in India in recent years. Mergers helped strengthen the capital buffers of banks. Although it is difficult to isolate the impact of mergers from other forces acting concomitantly, the improvement in provisions helped in containing the net NPA ratios (RBI, 2020c). V.31 In the Indian context, there are concerns that such consolidation measures may increase the market power of merged institutions and could result in neglect of local needs leading to reduction in credit supply to some categories of borrowers, particularly small firms, thereby, adversely affecting financial inclusion8. Consolidation could also result in less competition by giving fewer choices to the customer and may also result in non-competitive pricing of products. Going forward, to increase competition in the area and foster innovation, the Reserve Bank’s ‘on tap’ licensing policy for universal and small finance banks may be used effectively. The too-big-to-fail concerns will be addressed through additional Common Equity Tier-I (CET-I) capital requirements for domestic systemically important banks (D-SIBs). Development Financial Institutions V.32 While the existing financing models for infrastructure seem to be faltering, the credit needs of the sector remain strong. Against this backdrop, the setting up of the National Bank for Financing Infrastructure and Development (NaBFID) as a Development Financial Institution (DFI) in India is expected to shift the burden of long-term financing away from commercial banks. Moreover, apart from extending long term credit, NaBFID is expected to play an active role in the development of bonds and derivatives market necessary for infrastructure financing. V.33 International experience suggests that going forward, NaBFID will have to tread a fine line between two contradictory goals: being profitable as well as pursuing developmental goals of the economy. To meet the first goal, it will have to invest prudently and generate returns; on the other hand, balancing social and financial returns can be a complex, time-consuming, and sometimes contradictory affair, especially in light of difficulties in measuring the social impact of a project (Dickinson, 2019). Development of Corporate Debt Market V.34 Development of a vibrant corporate bond market in India remains crucial for meeting the financing requirement of corporates and the infrastructure sector and thereby achieving India’s growth aspirations. In recent years, a slew of reform measures have been undertaken in this area9. Despite these, the corporate bond market remains shallow and skewed in favor of larger sized firms, high-rated and financial sector issuers (Ganguly, 2019). In the secondary bond market, mutual funds are the only major active players, contributing around 40 per cent of the trading volumes (Tyagi, 2020). There is a need to further reduce the large number of International Securities Identification Number (ISIN), facilitate more active repo market and draw more players, particularly institutional investors to improve liquidity in the market. While institutional investors like insurance companies, pension funds and provident funds are typically allowed to invest in high-rated papers only, retail participation in the bond market is also limited in India, which needs to be enhanced. The recent Credit Default Swaps (CDS) directions issued by the Reserve Bank are expected to go a long way in developing the corporate bond market, especially the lower rated one, and pave the way for more and better resource allocation in long-term loan markets. V.35 Since inflows into debt markets help in improving depth and liquidity, Foreign Portfolio Investment (FPI) limit in government debt has been progressively expanded. Investment in State Development Loans (SDLs) has also been gradually liberalised to strengthen domestic markets. FPI investment limits are under-utilised due to liquidity considerations. The proposed institutional framework to provide liquidity to mutual funds and other participating institutional investors in the corporate bond market, particularly during times of stress, may instill confidence amongst the market participants. A credit enhancement mechanism offering partial or full guarantee on corporate bonds can also help in moderating the risk perception of infrastructure projects to levels compatible with risk appetite of investors and attract greater fund flows. Development of Stock Market V.36 Although India’s stock market capitalisation to GDP has witnessed a phenomenal rise, it is still lower than several other major economies, suggesting an untapped potential of equity markets in unlocking growth. Traditionally, Small and Medium Enterprises (SMEs) have relied on bank finance to meet their requirements, as they face several impediments in accessing the equity market, such as admission cost and listing requirements, lack of liquidity, educational gaps, limited ecosystems, and tax treatment, all of which require attention by regulators and policy makers alike (Nassr and Wehinger, 2016). The establishment of the BSE SME platform in March 2012 and the NSE SME platform (also known as Emerge) in September 2012 attempts to address these issues. Since the inception of these platforms, 633 small and medium companies have mobilised ₹ 7,777 crore of equity capital till 2021-22. These developments could promote investment in SMEs and, together with securitisation and other non-bank debt financing instruments, encourage an enhanced allocation of risk and risk taking, thereby supporting growth. Going forward, with the proliferation of new age FinTech solutions resulting in ease of access, participation of individuals in stock market may rise further, with greater allocation of their savings being channelised into equity markets through direct participation as well as indirect participation through mutual funds. There has been a flurry of IPO listings of new-age technology companies on domestic stock exchanges in 2021-22. As India is estimated to be the third largest start-up ecosystem in the world (PIB, 2022), traction in their listings could be pivotal in India’s start-up growth story. 5. Leveraging Digital Finance and Start-ups for Reinvigorating Growth V.37 Digital finance encompasses a host of new financial products, financial businesses, finance-related software, novel forms of customer communication and interaction delivered by FinTech companies and innovative financial service providers, which has been instrumental in promoting growth, bolstering financial inclusion, and combating inequalities (Gomber et al., 2017). Cross-country analysis indicates that increase in digital financial inclusion is expected to boost real GDP growth (Khera et al., 2021). V.38 Digital lending allows lenders to grant collateral free loans while ensuring repayment by relying on actual transaction data, individual characteristics, and repayment behaviour to decide the borrower’s eligibility for loans. This may enable consumption smoothing of marginalised borrowers. In the US, FinTech lenders reduced processing time by about 10 days, or 20 per cent of the average processing time (Fuster et al., 2019). In China, digital finance is found to be positively correlated with food, clothing, house maintenance, medical care, education, and entertainment expenditures (Li et al., 2020). Digital finance can also help boost output by making resource allocations easier. Many FinTech companies provide working capital, relying on the borrowers’ revenue or sales data to make their lending decisions. Digital lending can serve as an alternate source of financing for capital strapped Micro, Small and Medium Enterprises (MSMEs) that lack traditional collateral. Easing of MSME credit limits may have a positive influence on general employment and equity. Governments may use FinTech to transfer salaries, conduct procurement, taxation, and payment for public services through electronic modes. Adoption of digital payment systems can induce increased formalisation of enterprises (Klapper, 2019) and aid in combatting tax evasion. FinTech in India V.39 Over the past few decades, India has witnessed a remarkable growth in its digital ecosystem, supported by a robust policy foundation, expansion of smartphones, internet coverage, digital literacy, as well as pro-active participation by the private sector (Saroy et al., 2020; Gandhi, 2016). Banks and FinTech firms could be viewed as strategic complements, as they have different comparative advantages, and hence a collaborative partnership between the two would permit them to focus on their respective core competencies (Mundra, 2017). The Reserve Bank, as the regulator and supervisor of the country’s payment and settlement systems, has been playing an active role in the digital transformation of the country through timely and calibrated impetus to payments infrastructure and regulatory framework. V.40 The Government of India played an active role in the digital revolution, creating a robust and highly scalable public infrastructure, popularly known as India Stack, and incorporating data privacy and security in the design of these digital public goods (D’Silva et al., 2019). V.41 The Pradhan Mantri Jan-Dhan Yojana (PMJDY), launched in 2014, combined with a rapid reduction in mobile internet tariffs, and rising interest of investors in Indian digital business, helped in expansion of access to financial services (Chart V.14). The integration of Digital India with real economic activity is expected to foster technology-led economic growth. Constraints to FinTech and Digital Payments V.42 While digital finance can provide the much needed growth impetus, if unchecked, it could result in certain concerns that need to be appropriately addressed. Since digital lending mainly originates from debt and equity rather than from deposits, digital lenders’ supply of funds could be more procyclical and volatile due to lack of standard credit guidelines. Further, credit activity outside the prudential regulation space could render credit-related countercyclical policies less effective. 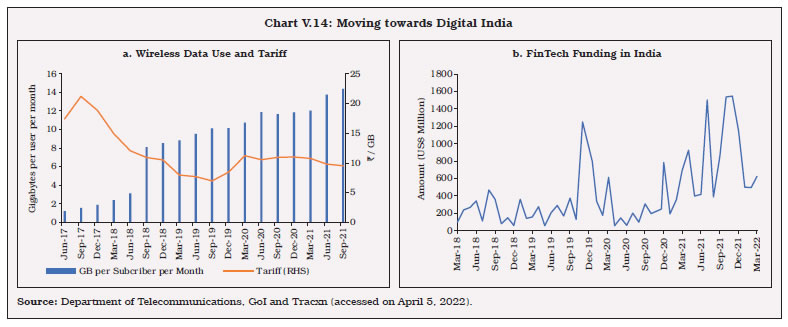 V.43 Data privacy poses concerns in the absence of adequate legislation and demarcation of statutory rights and obligations of service providers and other stakeholders. Data mining driven by sheer profit maximization objective could reproduce and perpetuate existing patterns of discrimination and exclude vulnerable sections (Barocas and Selbst, 2016). As the Indian population becomes data-rich with increasing internet and mobile coverage, the next challenge might be empowering consumers through adequate legal and regulatory support. V.44 With increasing dominance of BigTechs in digital payments, there could be an acceptance of data-fueled oligopoly for cheap services. Digital literacy and healthy competition could alleviate some of these concerns, and therefore, there is a need for re-aligning incentives to foster smaller, more innovative firms (Saroy et al., 2020). Since FinTech unbundles services across a wide number of domains, it is necessary to clearly demarcate responsibilities of various regulators over relevant aspects of the business entity and to ensure the existence of adequate avenues for regulatory collaboration. This may be done with the overarching goal of facilitating innovation through competitiveness, while ensuring a level playing field. 6. Green Finance for Sustainable growth V.45 For a smooth transition to ‘Net Zero’, green finance has become a public policy priority world over as climate risks are believed to be far reaching, non-linear, and mostly irreversible in nature. Appropriately adapted macro-financial models may help to generate and analyse various scenarios involving transition risks of climate-related disasters on the economy. Such risk evaluations, however, are complex as they must incorporate interactions among all the stakeholders having portfolio and balance sheet exposures to natural calamities and carbon pricing. V.46 The Reserve Bank has taken proactive policy measures to promote green finance. It has joined the Central Banks and Supervisors Network for Greening the Financial System (NGFS) in April 2021. The Indian government has committed to reduce the total projected carbon emissions from now till 2030 by one billion tonnes, reduce carbon intensity of the economy by more than 45 per cent by 2030, and achieve ‘Net Zero’ emissions by the year 2070. The Reserve Bank is actively sensitising the public, investors and banks regarding the need, opportunities, and challenges of green finance through its regular reports and other communications. The Google Trends Data, that analyses the popularity of top search queries in Google Search, indicate that awareness about green finance and climate risks has been gradually improving in India (Chart V.15). V.47 The Reserve Bank has included small renewable energy projects under its Priority Sector Lending (PSL) scheme in 2015, and its guidelines were further revised in 2020 to suit market conditions. SEBI recently revised its sustainability and social responsibility reporting requirements for top-listed companies, starting in 2022-23. Future Environmental, Social and Governance (ESG) research will require authentic data, as well as benchmarks and alerts (Ghosh et al, 2021). V.48 Once the current health crisis ends, the focus could shift to climate change and carbon pricing (RBI, 2021d). The Union Budget for 2022-23 announced the issuance of sovereign green bonds as part of its overall market borrowing programme, with revenues going to public sector projects that help reduce the economy’s carbon intensity. Given the large size of the domestic market and low penetration of green instruments, the potential for green finance is vast. Considering that a climate-related mitigation plan may result in a change in financial valuation or credit rating for certain business entities or sectors, a well calibrated policy framework is required to pursue the target. 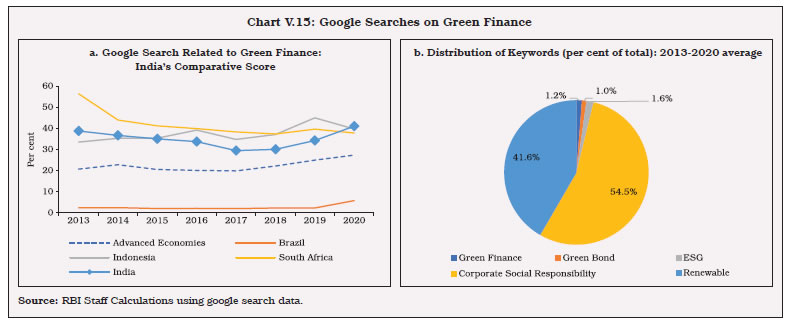 V.49 From a regulatory perspective, banks have a sizable portion of their portfolios invested in industries that are indirectly but heavily reliant on fossil fuels. Several of these, including basic metals, electricity, and textiles have a low interest coverage ratio and high outstanding NPAs. This underlines the vulnerability of the banking sector to climate risks, that may require constant monitoring (Ghosh et al., 2022). V.50. Effective co-ordination among policy stakeholders is essential to reduce information asymmetries. This can be accomplished through dissemination of high-quality data by policymakers, stakeholders, and market participants. It would significantly contribute to greater public awareness, reducing maturity mismatches, borrowing costs and re-establishing efficient resource allocation (Ghosh et al., 2021). V.51 The Reserve Bank has already taken several regulatory initiatives aimed at promoting sustainable finance, mitigating climate risk, and establishing the necessary foundations for conducting climate scenario analysis and stress testing. The stress tests could be designed by using a Dynamic Stochastic General Equilibrium (DSGE) model capable of assessing the differential impact of climate risks on brown versus green industries and banks. The other possibility is to harness machine learning algorithms for generating alternate stress scenarios. These exercises will provide an insight into possible policy designs and implementation, paving the way for a sustainable and enduring recovery. 7. Conclusion and Way Forward V.52 The pandemic’s financial fallout was superimposed upon pre-existing vulnerabilities in India’s financial sector, constraining the possibility of a finance-led growth. The underlying conditions are favourable and finance led growth is a viable option, but it must be driven forward by strategic initiatives that rejig and convert pre-existing weaknesses as well as architecture into opportunities. V.53 Banks need to be de-stressed from legacy burden and nudged to direct greater credit towards productive sectors of the economy. Priority sector norms and Statutory Liquidity Ratio (SLR) have been viewed by some analysts as preemptive, distorting efficient resource allocation. While the SLR requirements are being gradually reduced to align them with the Liquidity Coverage Ratio (LCR), reforms in the PSL space have been also undertaken. Of late, the PSL norms are used to channel resources for a greener and more sustainable finance. V.54 To avoid the moral hazard problem of government recapitalisation of PSBs, an incentive mechanism should be established and banks with better performance in terms of loan recovery and asset quality improvement should be given priority in terms of access to fresh capital. However, capital infusion should not become a substitute for better governance and risk controls. In the medium term, it is necessary to wean away PSBs from their dependence on government recapitalisation; this will be an important pre-condition to achieve greater privatisation of the sector. To increase the competition in the banking sector and to introduce innovation, the Reserve Bank’s ‘on tap’ licensing policy for universal and small finance banks may be used effectively. V.55 For quicker and more effective resolution, the IBC infrastructure needs to be strengthened by increasing the number of NCLT benches and by training more insolvency professionals. Lenders need to accept haircuts to kick-start the economic recovery process. The pre-pack mechanism— which combines the cost-effective nature of out-of-court settlements with the legal sanctity available in the IBC framework—is presently available to MSMEs. It needs to be extended to larger corporates as well. V.56 For the NARCL exercise to be cost and time effective, continued policy support, professional staff and transparency in operations will be essential. NaBFID will have to tread a fine line between two contradictory goals: being profitable as well as pursuing developmental goals of the economy. It may avoid past mistakes of erstwhile development finance institutions to rely on subsidised finance and instead focus on developing the corporate debt market and attracting resources from insurance, pension, and provident funds. V.57 Reforms in the corporate bond market could aim at broadening the domestic and foreign investors’ base, providing greater choices for investment suitable for varying risk appetites and developing a liquid secondary market. V.58 New-age companies, which often have riskier business models, are increasingly resorting to IPOs. It is important to ensure adequate disclosures about risk factors affecting their business to maintain investors’ confidence in the primary market. It is imperative for the regulator to ensure transparency and good corporate governance practices so that the secondary market functions smoothly, and the process of IPO is not used only as an exit mechanism. V.59 Going forward, the economy’s growing reliance on the digital ecosystem will be helpful in harnessing the benefits of low-cost resource allocation and distributive efficiency. Care however needs to be taken to protect the stakeholders from digital frauds, data breaches and digital oligopolies. Recognizing the vastly altered financing requirements of start-ups and unicorns, a policy framework for attracting risk capital needs to be put in place. While the financial sector withstood the pandemic shock well, climate change risks and frequent natural calamities call for inclusion of green finance and other sustainable growth objectives in financial sector policies. These measures are expected to pave the way for a more developed and efficient financial system, which in turn should help in greater financial inclusion, reduce vulnerabilities to shocks and promote investment and growth. References Bank of Japan (2018), “FinTech Special Edition – Financial Innovation and FinTech”, Payment and Settlement Systems Report Annex Series, September Barocas, S. and Selbst, A. D. (2016). “Big Data’s Disparate Impact”, 104 California Law Review 671. Bhadury, S., S. Ghosh, P. Gopalakrishnan (2021). “In Quest of Policy ‘Silver-Bullets’ towards Triggering a ‘V-Shaped’ Recovery”, MPRA Paper No. 110905, https://mpra.ub.uni-muenchen.de/110905/ Botev, Jaroslava & Égert, Balázs & Jawadi, Fredj (2019). “The nonlinear relationship between economic growth and financial development: Evidence from developing, emerging and advanced economies,” International Economics, Vol. 160(C), pages 3-13. Das, S., S. Ghosh, and V Kamate (2020): Monetary Policy and Financial Markets: Twist and Tango, RBI Bulletin, August. Dickinson, Thomas (2019). ‘‘Development Finance Institutions: Profitability Promoting Development’’. Available at https://www.oecd.org/dev/41302068.pdf D’Silva, D., Z. Filková, F. Packer, and S. Tiwari (2019). The Design of Digital Financial Infrastructure: Lessons from India. BIS Papers No. 106. Fuster, A., M. Plosser, P. Schnabl, J. Vickery, (2019). The Role of Technology in Mortgage Lending. The Review of Financial Studies. 32(5), 1854–1899. doi: https://doi.org/10.1093/rfs/hhz018 Gandhi, R. (2016). Evolution of Payment Systems in India: Or is it a Revolution?. Speech delivered at the Banaras Hindu University, Varanasi on October 22. Ganguly, Shromona (2019) “India’s Corporate Bond Market: Issues in Market Microstructure”. RBI Bulletin, January Ghosh, S., S. Nath and A. Ranjan (2021): ‘‘Green Finance in India: Progress and Challenges’’, RBI Bulletin, January. Ghosh, S., S. Nath, A. Narayanan, and S. Das (2022): Green Transition Risks to Indian Banks, RBI Bulletin, January. Gomber, P., Koch, JA. & Siering, M. (2017). ‘‘Digital Finance and FinTech: current research and future research directions’’. Journal of Business Economics. 87, 537–580. doi: https://doi.org/10.1007/s11573-017-0852-x Herwadkar S, A. Agarwal and S. Dhingra (2022). ‘’Bad Banks as Good Samaritans: Lessons for Cross-Country Experience for India’’. RBI Monthly Bulletin, February. Kant Amitabh (2019). “Incredible India 2.0: Synergies for Growth and Governance”, Rupa Publications. Khera, Purva., S. Y. Ng, S. Ogawa, R. Sahay (2021). “Is Digital Financial Inclusion Unlocking Growth?”, IMF Working Paper No. 2021/167. Klapper L, M. Miller and J. Hess (2019). “Leveraging Digital Financial Solutions to Promote Formal Business Participation”. World Bank. Available at https://openknowledge.worldbank.org/handle/10986/31654 Li, J., Y. Wu, & J. J. Xiao, (2020). The impact of digital finance on household consumption: Evidence from China. Economic Modelling. 86, 317-326. doi: https://doi.org/10.1016/j.econmod.2019.09.027 Mundra, S.S. (2017). Financing MSMEs: Banks & FinTechs – Competition, Collaboration or Competitive Collaboration?. Speech delivered at the NAMCABS Seminar organized by College of Agricultural Banking in Mumbai, February 20. Nassr, Iota and G. Wehinger (2016). “Opportunities and limitations of public equity markets for SMEs”. OECD Journal: Financial Market Trends, OECD Publishing, vol. 2015(1), pages 49-84. Panagariya Arvind (2020). India Unlimited: Reclaiming the Lost Glory, Harper India, March. Press Information Bureau (2022). “PM addresses webinar on Technology Enabled Development”. Press Release. March 2. Reserve Bank of India (2021a). Report on Trend and Progress of Banking in India 2020-21. December. Reserve Bank of India (2021b). Financial Stability Report. December. Reserve Bank of India (2020c). “Report on Trend and Progress of Banking in India 2019-20”. December. Reserve Bank of India (2021d). ‘‘State of the Economy.’’ RBI Bulletin. April. Saroy, R., R.K. Gupta, S. Dhal, (2020). FinTech: The Force of Creative Disruption. RBI Bulletin, November. Talwar, A.B., K.M. Kushwaha, and I Bhattacharya (2021): Unconventional Monetary Policy in Times of COVID-19, RBI Bulletin, March. Tyagi, Ajay (2020). Atmanirbhar Bharat: Role of Capital Markets. Speech delivered at FICCI Capital Market Conference, July.
|