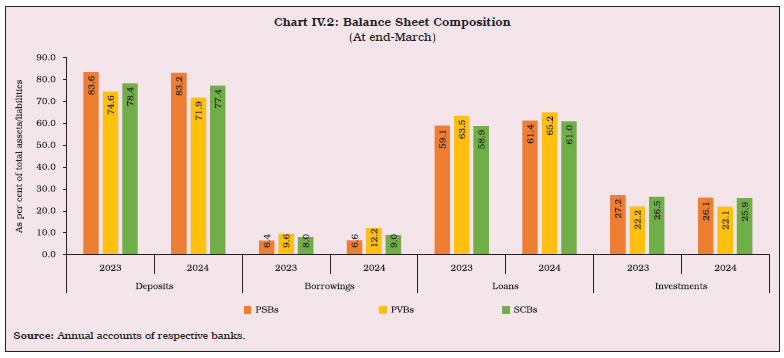
During 2023-24, the consolidated balance sheet of commercial banks in India remained robust, marked by sustained expansion in both credit and deposits. Asset quality indicated gains across all bank groups. Capital and liquidity buffers remained well above regulatory requirements and profitability exhibited improvement for the sixth consecutive year. 1. Introduction IV.1 The Indian commercial banking sector exhibited sustained strength during 2023-24 and H1: 2024-25. The consolidated balance sheet of scheduled commercial banks (SCBs) underwent double-digit expansion, led by robust credit growth1. Banks’ profitability rose for the sixth consecutive year and asset quality improved further with the gross non-performing assets (GNPA) ratio falling to its lowest in 13 years at 2.7 per cent at end-March 2024. Banks’ capital position remained satisfactory as reflected in their leverage and capital to risk weighted assets ratios (CRAR). All bank groups met regulatory requirements related to liquidity while maintaining high provision coverage ratios (PCRs). IV.2 Against this background, this chapter is organised into 17 sections. Balance sheet developments are analysed in Section 2, followed by an assessment of their financial performance and financial soundness in Sections 3 and 4, respectively. Section 5 focuses on bank credit and its sectoral dynamics. The ownership pattern in commercial banks is discussed in Section 6. Corporate governance and compensation practices are presented in Section 7. Operations of foreign banks in India and overseas operations of Indian banks are covered in Section 8, followed by developments in payments systems (Section 9), technology adoption by banks (Section 10), consumer protection (Section 11) and financial inclusion (Section 12). Developments relating to regional rural banks (RRBs), local area banks (LABs), small finance banks (SFBs) and payments banks (PBs) are set out in Sections 13 to 16. An overall assessment of the domestic commercial banking system in Section 17 completes the chapter. 2. Balance Sheet Analysis IV.3 At end-March 2024, India’s commercial banking sector consisted of 12 public sector banks (PSBs), 21 private sector banks (PVBs), 45 foreign banks (FBs), 12 SFBs, six PBs, 43 RRBs, and two LABs. Out of these 141 commercial banks, 137 were classified as scheduled banks, while four were non-scheduled2. IV.4 The consolidated balance sheet of SCBs, excluding RRBs, increased by 15.5 per cent during 2023-24 (including the impact of the merger3), as compared with 12.2 per cent during 2022-23 (Appendix Table IV.1). On the assets side, this expansion was driven by buoyant bank credit, which increased by 16.0 per cent in 2023-24 (excluding the impact of the merger) on top of 17.4 per cent growth a year ago. SCBs’ investments grew by 11.6 per cent in 2023-24 (excluding the impact of the merger) as compared with 11.4 per cent a year ago4 (Chart IV.1). IV.5 The share of PSBs in the consolidated balance sheet of SCBs fell to 55.2 per cent at end-March 2024 from 57.6 per cent at end-March 2023, with that of PVBs increasing from 34.7 per cent to 37.5 per cent. PSBs accounted for 59.3 per cent of total deposits of SCBs and 55.5 per cent of total advances (Table IV.1). IV.6 The share of loans and advances in total assets of SCBs increased by 2.2 percentage points during 2023-24 (Chart IV.2). 2.1 Liabilities IV.7 Deposit growth of commercial banks accelerated to 13.4 per cent in 2023-24 (excluding the merger impact)5 from 11.0 per cent a year ago. The weighted average domestic term deposit rate (WADTDR) on fresh deposits of PVBs increased to 6.6 per cent at end-March 2024 from 4.5 per cent at end-March 2022. Higher term deposit rates drove a faster pace of growth in term deposits relative to current account and savings account (CASA) deposits (Chart IV.3). In the long-run, the overall level of economic activity rather than interest rates is the main factor impacting deposit growth (Box IV.1). 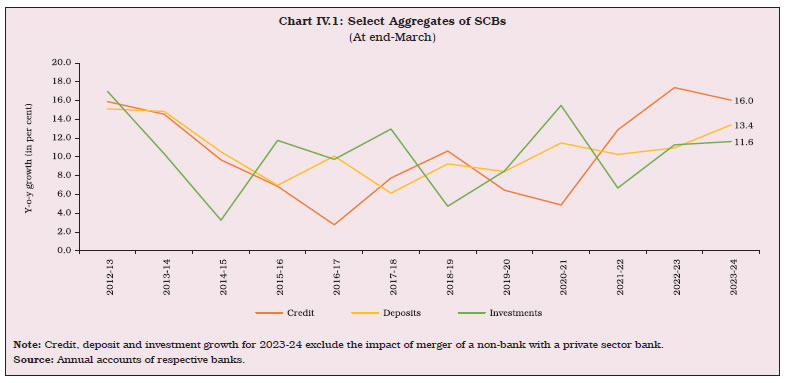
| Table IV.1: Consolidated Balance Sheet of Scheduled Commercial Banks | | (At end-March) | | (Amount in ₹ crore) | | Item | Public Sector Banks | Private Sector Banks | Foreign Banks | Small Finance Banks | Payments Banks | All Scheduled Commercial Banks | | 2023 | 2024 | 2023 | 2024 | 2023 | 2024 | 2023 | 2024 | 2023 | 2024 | 2023 | 2024 | | 1. Capital | 71,176 | 72,877 | 32,468 | 32,832 | 1,11,612 | 1,18,603 | 7,811 | 7,844 | 4,512 | 5,001 | 2,27,580 | 2,37,158 | | 2. Reserve and Surplus | 8,24,250 | 9,56,917 | 9,34,791 | 12,14,082 | 1,60,606 | 1,80,023 | 23,557 | 32,957 | -2,404 | -2,365 | 19,40,800 | 23,81,614 | | 3. Deposits | 1,17,09,581 | 1,28,96,766 | 62,99,318 | 75,61,502 | 8,55,825 | 10,08,095 | 1,91,340 | 2,50,896 | 12,174 | 16,184 | 1,90,68,238 | 2,17,33,443 | | | | | | (74,51,388) | | | | | | | | (2,16,23,329) | | 3.1. Demand Deposits | 7,48,951 | 8,00,416 | 8,85,492 | 9,88,296 | 2,89,545 | 3,46,863 | 7,429 | 10,895 | 393 | 76 | 19,31,810 | 21,46,546 | | 3.2. Savings Bank Deposits | 39,79,202 | 41,83,455 | 18,89,846 | 20,23,962 | 56,931 | 57,827 | 54,668 | 59,691 | 11,781 | 16,108 | 59,92,427 | 63,41,043 | | 3.3. Term Deposits | 69,81,428 | 79,12,895 | 35,23,981 | 45,49,244 | 5,09,349 | 6,03,405 | 1,29,243 | 1,80,310 | - | - | 1,11,44,001 | 1,32,45,854 | | 4. Borrowings | 9,03,824 | 10,24,003 | 8,12,969 | 12,84,429 | 2,08,739 | 2,03,073 | 31,190 | 28,255 | 519 | 713 | 19,57,241 | 25,40,474 | | 5. Other Liabilities and Provisions | 5,05,949 | 5,42,671 | 3,65,924 | 4,28,526 | 2,30,921 | 1,96,198 | 13,619 | 15,331 | 8,156 | 5,135 | 11,24,570 | 11,87,862 | | Total Liabilities/assets | 1,40,14,781 | 1,54,93,234 | 84,45,470 | 1,05,21,372 | 15,67,704 | 17,05,993 | 2,67,517 | 3,35,284 | 22,957 | 24,668 | 2,43,18,429 | 2,80,80,550 | | 1. Cash and Balances with RBI | 6,41,731 | 6,18,769 | 4,13,201 | 5,32,690 | 93,411 | 1,05,980 | 17,840 | 17,503 | 2,295 | 3,004 | 11,68,479 | 12,77,947 | | 2. Balances with Banks and Money at Call and Short Notice | 4,23,343 | 4,34,252 | 2,36,116 | 1,89,051 | 1,19,332 | 74,865 | 4,530 | 6,305 | 4,963 | 4,313 | 7,88,284 | 7,08,785 | | 3. Investments | 38,17,201 | 40,50,865 | 18,75,137 | 23,23,647 | 6,74,077 | 8,07,328 | 58,062 | 74,239 | 12,064 | 14,286 | 64,36,540 | 72,70,365 | | | | | | (22,33,887) | | | | | | | | (71,80,604) | | 3.1 In Government Securities (a+b) | 32,22,899 | 34,84,382 | 15,87,677 | 19,88,718 | 6,31,129 | 7,33,803 | 52,137 | 63,824 | 12,049 | 14,271 | 55,05,891 | 62,84,999 | | a) In India | 31,65,076 | 34,23,192 | 15,73,022 | 19,73,422 | 5,88,166 | 7,25,476 | 52,137 | 63,824 | 12,049 | 14,271 | 53,90,449 | 62,00,185 | | b) Outside India | 57,824 | 61,190 | 14,655 | 15,296 | 42,963 | 8,327 | - | - | - | - | 1,15,442 | 84,814 | | 3.2 Other Approved Securities | 5 | 5 | - | - | - | - | - | - | - | - | 5 | 5 | | 3.3 Non-approved Securities | 5,94,296 | 5,66,477 | 2,87,460 | 3,34,929 | 42,948 | 73,525 | 5,925 | 10,415 | 15 | 15 | 9,30,644 | 9,85,361 | | 4. Loans and advances | 82,83,763 | 95,06,329 | 53,66,673 | 68,61,388 | 4,91,029 | 5,48,474 | 1,77,887 | 2,26,148 | - | - | 1,43,19,353 | 1,71,42,340 | | | | | | (63,36,115) | | | | | | | | (1,66,17,066) | | 4.1 Bills Purchased and Discounted | 2,84,863 | 3,57,393 | 1,34,836 | 1,50,780 | 65,506 | 84,506 | 872 | 1,444 | - | - | 4,86,077 | 5,94,124 | | 4.2 Cash Credits, Overdrafts, etc. | 29,10,286 | 33,64,717 | 16,98,188 | 19,67,085 | 2,07,287 | 2,39,685 | 18,266 | 26,966 | - | - | 48,34,027 | 55,98,453 | | 4.3 Term Loans | 50,88,614 | 57,84,218 | 35,33,648 | 47,43,524 | 2,18,236 | 2,24,283 | 1,58,750 | 1,97,738 | - | - | 89,99,248 | 1,09,49,763 | | 5. Fixed Assets | 1,15,288 | 1,18,864 | 49,347 | 56,755 | 5,624 | 5,956 | 2,735 | 3,353 | 564 | 1,189 | 1,73,558 | 1,86,117 | | 6. Other Assets | 7,33,456 | 7,64,154 | 5,04,997 | 5,57,840 | 1,84,230 | 1,63,390 | 6,463 | 7,736 | 3,070 | 1,876 | 14,32,216 | 14,94,997 | Notes: 1. -: Nil/negligible.
2. Detailed bank-wise data on annual accounts are collated and published in Statistical Tables Relating to Banks in India, which is being released simultaneously with this Report, available at https://data.rbi.org.in.
3. Data in parentheses exclude the impact of the merger of a non-bank with a bank. All other data are inclusive of the impact of the merger.
Source: Annual accounts of respective banks. |
 2.2 Assets IV.8 Credit growth remained robust during 2023-24, propelled by acceleration in economic activity6 (Chart IV.4a). The weighted average lending rate (WALR) remained firm during the year reflecting the monetary policy stance. Transmission to lending rate on fresh loans was generally higher for PSBs than for PVBs (Chart IV.4b). 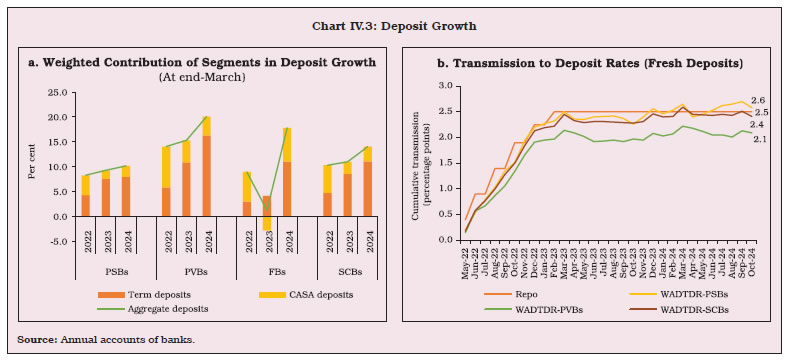
Box IV.1 Determinants of Deposit Growth in Commercial Banks The determinants of deposit growth in commercial banks in India are assessed for the period June 2012-March 2024 in an autoregressive distributed lag (ARDL) model (Pesaran and Shin, 1999). In line with the consensus in the literature (Saleh, M. et al., 2023 and S. A. S. Ali et al., 2019), the regression results suggest that the long-run elasticity of bank deposits with respect to income, proxied by nominal gross value added (GVA) is close to unity (1.1), i.e., a one per cent growth in income, ceteris paribus, is associated with almost one per cent increase in bank deposit growth in the long run. Higher deposit interest rates (WADTDR) contribute to higher bank deposits, but their impact is not statistically significant in the long run. The negative and statistically significant coefficient of the error correction term (ECM) indicates that around 17 per cent of any disequilibrium between deposit and income growth due to any shock is corrected in each quarter (Table IV.1.1). References: Pesaran, M. H., & Shin, Y. (1999). An Autoregressive Distributed-Lag Modelling Approach to Cointegration Analysis. Econometrics and Economic Theory in the 20th Century: The Ragnar Frisch Centennial Symposium, 371–413. Cambridge: Cambridge University Press. Saleh, M., et al. (2023). The Impact of Financial Determinants on Bank Deposits Using ARDL Model. Journal of Statistics Applications & Probability 12(2): 441-452. DOI: https://doi.org/10.18576/jsap/120210. S. A. S. Ali, et al. (2019). Determinants of Deposit of Commercial Banks in Sudan: an Empirical Investigation (1970-2012). International Journal of Electronic Finance (9), 230-255. | Table IV.1.1: Determinants of Aggregate Deposit: ARDL Model | | Dependent Variable: log Aggregate Deposit | | Long Run | | | Log GVA (-1) | 1.083*** | | | (0.360) | | WADTDR Outstanding (-1) | 0.0458 | | | (0.0603) | | Log BSE (-1) | -0.0155 | | | (0.211) | | ECM | -0.166** | | | (0.0801) | | Short Run | | | D.Log GVA | -0.0420 | | | (0.0678) | | D.WADTDR Outstanding | 0.0479* | | | (0.0267) | | D.WADTDR Outstanding (-1) | -0.0312 | | | (0.0273) | | D.Log BSE | 0.0716 | | | (0.0427) | | D.Log BSE (-1) | -0.0916** | | | (0.0403) | | Demonetisation Dummy | 0.0244* | | | (0.0121) | | COVID Dummy | 0.0299** | | | (0.0117) | | Quarter2 Dummy | -0.00352 | | | (0.00787) | | Quarter3 Dummy | 0.00396 | | | (0.00719) | | Quarter4 Dummy | 0.00643 | | | (0.00792) | | Constant | -0.0420 | | | (0.742) | | Observations | 39 | | R-squared | 0.468 | | Source: RBI staff estimates. | | IV.9 Credit growth was led by the metropolitan region in 2023-24, as in the past. The contribution of rural, semi-urban and urban areas broadly remained steady (Chart IV.5).
IV.10 At end-March 2024, 83.1 per cent of SCBs’ investments were in SLR approved securities. In non-SLR investments, debt comprised nearly 95 per cent (Table IV.2). IV.11 With a pick-up in deposit growth, the credit-deposit growth gap narrowed during 2023-24 to 3.4 percentage points (excluding the merger impact) (Chart IV.6a). The investment-deposit growth gap also narrowed during the year (Chart IV.6b). 2.3 Maturity Profile of Assets and Liabilities IV.12 Assets-liability maturity mismatches are intrinsic to the banking sector as their primary source of funds, i.e., deposits, are of short-to medium-term tenors, while the loans repayment schedule stretches across the medium-term. | Table IV.2: Investments of SCBs | | (At end-March) | | (Amount in ₹ crore) | | 1 | PSBs | PVBs | FBs | SFBs | SCBs | | 2023 | 2024 | 2023 | 2024 | 2023 | 2024 | 2023 | 2024 | 2023 | 2024 | | 2 | 3 | 4 | 5 | 6 | 7 | 8 | 9 | 10 | 11 | | Total Investments (A+B) | 38,33,030 | 40,54,445 | 18,81,756 | 23,11,707 | 6,55,830 | 8,01,533 | 58,244 | 74,508 | 64,28,860 | 72,42,193 | | A. SLR Investments (I+ II+III) | 30,07,757 | 32,62,932 | 15,62,365 | 19,61,384 | 5,99,061 | 7,27,546 | 52,151 | 63,873 | 52,21,335 | 60,15,735 | | I. Central Government Securities | 17,45,055 | 18,36,240 | 13,10,477 | 16,23,034 | 5,93,438 | 7,17,980 | 40,013 | 47,494 | 36,88,983 | 42,24,748 | | II. State Government Securities | 12,60,787 | 14,22,323 | 2,51,889 | 3,38,350 | 5,623 | 9,566 | 12,139 | 16,379 | 15,30,437 | 17,86,618 | | III. Other Approved Securities | 1,916 | 4,369 | 0 | 0 | 0 | 0 | 0 | 0 | 1,916 | 4,369 | | B. Non-SLR Investments (I+II) | 8,25,273 | 7,91,513 | 3,19,390 | 3,50,323 | 56,769 | 73,987 | 6,093 | 10,634 | 12,07,525 | 12,26,458 | | I. Debt Securities | 7,68,545 | 7,49,178 | 3,03,474 | 3,32,937 | 56,404 | 73,691 | 6,016 | 10,555 | 11,34,439 | 11,66,361 | | II. Equities | 56,728 | 42,335 | 15,916 | 17,386 | 365 | 297 | 77 | 79 | 73,087 | 60,097 | | Source: Off-site returns (global operations), RBI. |
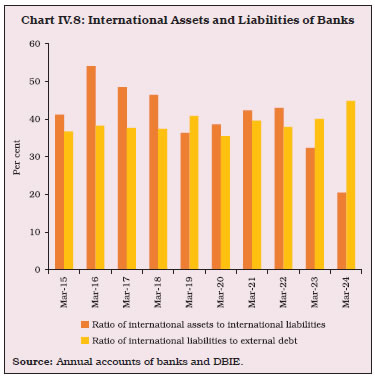
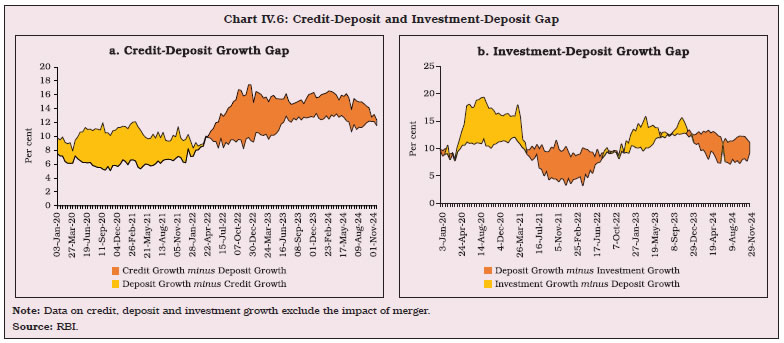 During 2023-24, the maturity mismatch widened in the short-term bucket from a year ago, although it remained low relative to pre-pandemic levels. The gap remained positive across other buckets7 (Chart IV.7). This mainly reflected an increase in shorter maturity deposits raised by banks. IV.13 The share of short-term deposits in total deposits increased for all bank groups, except FBs. On the other hand, the share of short-term borrowings declined for all bank groups, except SFBs. All the operations of FBs, viz., deposits, borrowings, lending and investments were concentrated in short-term buckets. PSBs’ investments are typically in long-term instruments, while all other bank groups prefer short-term exposures (Table IV.3). 2.4 International Liabilities and Assets IV.14 In 2023-24, growth of all types of non-residents deposits, viz., foreign currency non-resident (Bank) [FCNR(B)], Non-resident External (NRE) Rupee and Non-resident Ordinary (NRO) Rupee contributed to acceleration in international liabilities of banks in India (Appendix Table IV.2). Their international assets fell by 23.5 per cent in 2023-24 on top of a contraction of 13.1 per cent a year ago on account of reduction in NOSTRO balances and placements abroad as well as in loans to non-residents (Appendix Table IV.3). Consequently, the international assets to liabilities ratio of banks in India declined for the second consecutive year during 2023-24 (Chart IV.8). | Table IV.3: Bank Group-wise Maturity Profile of Select Liabilities/Assets | | (At end-March) | | (Per cent) | | Liabilities/Assets | PSBs | PVBs | FBs | SFBs | PBs | All SCBs | | 2023 | 2024 | 2023 | 2024 | 2023 | 2024 | 2023 | 2024 | 2023 | 2024 | 2023 | 2024 | | 1 | 2 | 3 | 4 | 5 | 6 | 7 | 8 | 9 | 10 | 11 | 12 | 13 | | I. Deposits | | | | | | | | | | | | | | a) Up to 1 year | 36.4 | 38.3 | 33.0 | 39.2 | 65.7 | 62.2 | 42.2 | 49.0 | 15.5 | 22.6 | 36.7 | 39.8 | | b) Over 1 year and up to 3 years | 21.1 | 22.0 | 31.2 | 27.9 | 26.1 | 30.7 | 54.9 | 44.8 | 84.5 | 77.4 | 25.0 | 24.7 | | c) Over 3 years and up to 5 years | 12.8 | 11.0 | 9.1 | 8.3 | 8.1 | 7.1 | 1.8 | 4.5 | 0.0 | 0.0 | 11.2 | 9.8 | | d) Over 5 years | 29.7 | 28.7 | 26.7 | 24.6 | 0.0 | 0.0 | 1.1 | 1.7 | 0.0 | 0.0 | 27.1 | 25.6 | | II. Borrowings | | | | | | | | | | | | | | a) Up to 1 year | 60.8 | 58.1 | 45.9 | 33.8 | 90.5 | 82.8 | 38.8 | 51.3 | 100.0 | 100.0 | 57.4 | 47.7 | | b) Over 1 year and up to 3 years | 16.7 | 16.7 | 32.6 | 37.8 | 7.6 | 16.2 | 50.6 | 35.7 | 0.0 | 0.0 | 22.9 | 27.5 | | c) Over 3 years and up to 5 years | 8.5 | 6.9 | 10.3 | 9.9 | 0.7 | 0.4 | 5.4 | 7.3 | 0.0 | 0.0 | 8.3 | 7.9 | | d) Over 5 years | 14.0 | 18.3 | 11.2 | 18.6 | 1.2 | 0.6 | 5.2 | 5.8 | 0.0 | 0.0 | 11.3 | 16.9 | | III. Loans and Advances | | | | | | | | | | | | | | a) Up to 1 year | 28.3 | 28.0 | 28.4 | 27.3 | 56.2 | 59.5 | 36.5 | 37.7 | 100.0 | 100.0 | 29.4 | 28.9 | | b) Over 1 year and up to 3 years | 34.3 | 36.5 | 36.7 | 34.6 | 23.9 | 23.8 | 36.0 | 36.0 | 0.0 | 0.0 | 34.9 | 35.3 | | c) Over 3 years and up to 5 years | 14.1 | 12.1 | 12.5 | 12.5 | 10.0 | 8.2 | 10.5 | 10.1 | 0.0 | 0.0 | 13.3 | 12.1 | | d) Over 5 years | 23.3 | 23.4 | 22.4 | 25.6 | 9.9 | 8.5 | 17.1 | 16.3 | 0.0 | 0.0 | 22.4 | 23.7 | | IV. Investment | | | | | | | | | | | | | | a) Up to 1 year | 26.0 | 22.4 | 55.3 | 58.6 | 86.4 | 83.9 | 61.6 | 68.6 | 99.5 | 99.2 | 41.3 | 41.4 | | b) Over 1 year and up to 3 years | 14.6 | 16.3 | 19.1 | 17.2 | 8.2 | 10.4 | 27.0 | 25.9 | 0.1 | 0.4 | 15.3 | 16.0 | | c) Over 3 years and up to 5 years | 12.9 | 11.9 | 7.1 | 6.1 | 1.3 | 1.6 | 5.5 | 4.0 | 0.0 | 0.1 | 9.9 | 8.8 | | d) Over 5 years | 46.4 | 49.4 | 18.5 | 18.1 | 4.2 | 4.1 | 5.9 | 1.5 | 0.4 | 0.3 | 33.4 | 33.8 | Note: Figures denote share of each maturity bucket in each component of the balance sheet.
Source: Annual accounts of banks. |
 IV.15 The consolidated international claims of Indian banks on all the major economies, except US and UAE, increased in 2023-24 (Appendix Table IV.4); in contrast, in the previous year, Indian banks’ consolidated international claims on major economies, except Singapore, had contracted. At end-March 2024, Indian banks’ claims shifted away from their counterparts in other jurisdictions towards non-financial private sector (Chart IV.9a). The proportion of shorter maturity claims increased and remained the dominant category (Appendix Table IV.5 and Chart IV.9b). 2.5 Off-Balance Sheet Operations IV.16 Growth in contingent liabilities of SCBs decelerated at end-March 2024, led by forward exchange contracts (Chart IV.10a and Appendix Table IV.6). As a proportion of balance sheet size, the off-balance sheet exposure of SCBs decreased to 138.6 per cent at end-March 2024 from 144.8 per cent at end-March 2023. The share of PVBs in contingent liabilities of the banking sector increased from 20.4 per cent at end-March 2014 to 32.9 per cent at end-March 2024, while that of PSBs fell from 24.3 per cent to 13.2 per cent over the same period (Chart IV.10b). 3. Financial Performance IV.17 Profitability of banks improved for the sixth consecutive year in 2023-24. Both PSBs and PVBs exhibited an increase in return on assets (RoA) in 2023-24 (Chart IV.11). Gains in profitability of SCBs continued in H1:2024-25 with RoA at 1.4 per cent and RoE at 14.6 per cent.
IV.18 During 2023-24, banks resorted to borrowings at higher interest rates and increased their deposit rates to bridge the credit-deposit growth gap. Consequently, the growth of their interest expenditure outpaced that of their interest earnings, resulting in a deceleration in both operating and net profit growth (Table IV.4 and Chart IV.12a). IV.19 The interest expense to interest income ratio increased to 57.4 per cent during 2023-24 from 52.2 per cent in the previous year. The median Net Interest Margin (NIM) was the highest for PVBs, followed by FBs and PSBs. NIM is highly dispersed for FBs, followed by PVBs and PSBs (Chart IV.12b). 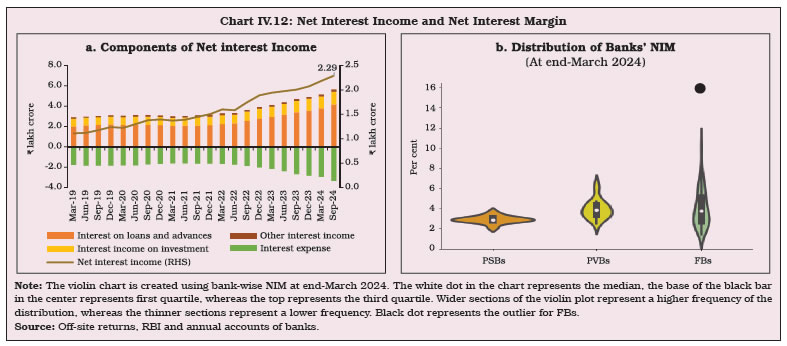
| Table IV.4: Trends in Income and Expenditure of Scheduled Commercial Banks | | (Amount in ₹ crore) | | | Public Sector Banks | Private Sector Banks | Foreign Banks | Small Finance Banks | Payments Banks | All SCBs | | 2022-23 | 2023-24 | 2022-23 | 2023-24 | 2022-23 | 2023-24 | 2022-23 | 2023-24 | 2022-23 | 2023-24 | 2022-23 | 2023-24 | | 1 | 2 | 3 | 4 | 5 | 6 | 7 | 8 | 9 | 10 | 11 | 12 | 13 | | 1. Income | 9,71,421 | 12,12,665 | 6,90,504 | 9,41,864 | 1,08,132 | 1,29,870 | 33,806 | 45,449 | 5,965 | 7,102 | 18,09,829 | 23,36,949 | | | (16.8) | (24.8) | (20.7) | (36.4) | (36.0) | (20.1) | (34.6) | (34.4) | (20.5) | (19.0) | (19.6) | (29.1) | | a) Interest Income | 8,51,078 | 10,66,243 | 5,82,278 | 7,96,569 | 83,315 | 1,06,032 | 29,806 | 39,646 | 860 | 1,416 | 15,47,337 | 20,09,907 | | | (20.0) | (25.3) | (23.6) | (36.8) | (26.5) | (27.3) | (34.7) | (33.0) | (92.7) | (64.6) | (22.0) | (29.9) | | b) Other Income | 1,20,343 | 1,46,422 | 1,08,226 | 1,45,295 | 24,817 | 23,838 | 4,000 | 5,803 | 5,105 | 5,686 | 2,62,492 | 3,27,043 | | | (-2.0) | (21.7) | (6.8) | (34.3) | (81.9) | (-3.9) | (34.0) | (45.1) | (13.3) | (11.4) | (7.0) | (24.6) | | 2. Expenditure | 8,66,772 | 10,71,463 | 5,66,369 | 7,66,567 | 77,987 | 1,02,984 | 29,644 | 39,230 | 5,844 | 7,103 | 15,46,615 | 19,87,346 | | | (13.3) | (23.6) | (19.0) | (35.3) | (27.6) | (32.1) | (22.8) | (32.3) | (15.9) | (21.5) | (16.1) | (28.5) | | a) Interest Expended | 4,87,690 | 6,58,611 | 2,75,391 | 4,29,732 | 31,678 | 46,996 | 12,140 | 17,474 | 246 | 353 | 8,07,144 | 11,53,167 | | | (18.6) | (35.0) | (22.8) | (56.0) | (47.5) | (48.4) | (27.6) | (43.9) | (57.5) | (43.8) | (21.1) | (42.9) | | b) Operating Expenses | 2,44,064 | 2,95,090 | 2,02,563 | 2,39,146 | 27,958 | 34,789 | 13,150 | 17,189 | 5,579 | 6,634 | 4,93,314 | 5,92,848 | | | (10.9) | (20.9) | (29.3) | (18.1) | (12.0) | (24.4) | (34.0) | (30.7) | (14.3) | (18.9) | (18.5) | (20.2) | | of which: Wage Bill | 1,44,690 | 1,84,025 | 70,605 | 90,284 | 10,065 | 10,460 | 6,705 | 8,504 | 914 | 1,215 | 2,32,978 | 2,94,488 | | | (9.0) | (27.2) | (20.0) | (27.9) | (9.6) | (3.9) | (26.4) | (26.8) | (15.9) | (32.9) | (12.6) | (26.4) | | c) Provision and Contingencies | 1,35,018 | 1,17,761 | 88,415 | 97,688 | 18,351 | 21,200 | 4,354 | 4,567 | 20 | 116 | 2,46,158 | 2,41,332 | | | (0.7) | (-12.8) | (-7.1) | (10.5) | (25.3) | (15.5) | (-9.4) | (4.9) | (556.9) | (488.4) | (-1.0) | (-2.0) | | 3. Operating Profit | 2,39,667 | 2,58,964 | 2,12,551 | 2,72,986 | 48,496 | 48,085 | 8,516 | 10,786 | 141 | 114 | 5,09,371 | 5,90,935 | | | (19.5) | (8.1) | (11.0) | (28.4) | (46.8) | (-0.8) | (47.3) | (26.6) | (-263.0) | (-18.9) | (18.2) | (16.0) | | 4. Net Profit | 1,04,649 | 1,41,202 | 1,24,136 | 1,75,297 | 30,145 | 26,886 | 4,162 | 6,219 | 121 | -1 | 2,63,214 | 3,49,603 | | | (57.3) | (34.9) | (29.0) | (41.2) | (64.0) | (-10.8) | (327.6) | (49.4) | (-235.6) | (-101.0) | (44.6) | (32.8) | | 5. Net Interest Income (NII) | 3,63,388 | 4,07,632 | 3,06,888 | 3,66,836 | 51,637 | 59,036 | 17,666 | 22,172 | 615 | 1,063 | 7,40,193 | 8,56,740 | | | (22.0) | (12.2) | (24.4) | (19.5) | (16.4) | (14.3) | (40.1) | (25.5) | (111.7) | (72.9) | (23.0) | (15.7) | | 6. Net Interest Margin (NIM) | 2.7 | 2.8 | 3.9 | 3.9 | 3.5 | 3.6 | 7.5 | 7.4 | 3.0 | 4.5 | 3.2 | 3.3 | Notes: 1. NIM has been defined as NII as percentage of average assets.
2. Figures in parentheses refer to per cent variation over the previous year.
Source: Annual accounts of respective banks. | IV.20 The PCR (not adjusted for write-offs) of SCBs expanded by 210 basis points (bps) y-o-y to reach 76.2 per cent at end-March 2024, mainly reflecting lower slippages. It further improved to 76.7 per cent at end-September 2024, largely driven by PSBs (Chart IV.13). IV.21 An increase of 104 bps in the cost of funds and 89 bps rise in the yield on assets narrowed the spread for SCBs during 2023-24. SFBs had the widest spreads, reflecting relatively higher interest rates on their advances (Table IV.5). 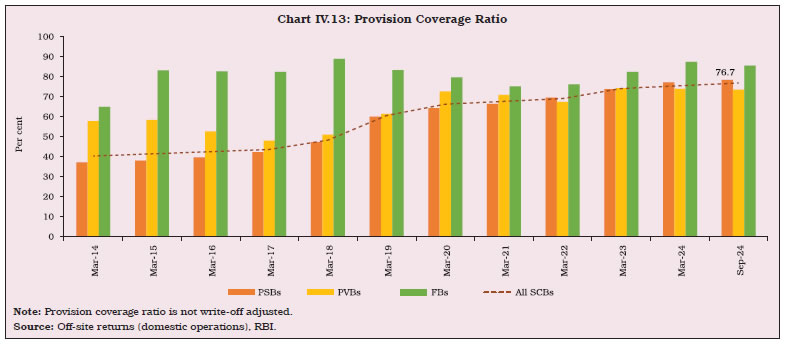
| Table IV.5: Cost of Funds and Return on Funds - Bank Group-wise | | (Per cent) | | Bank Group | Year | Cost of Deposits | Cost of Borrowings | Cost of Funds | Return on Advances | Return on Investments | Return on Funds | Spread (Column 8 – Column 5) | | 1 | 2 | 3 | 4 | 5 | 6 | 7 | 8 | 9 | | PSBs | 2022-23 | 3.9 | 6.2 | 4.1 | 7.5 | 6.5 | 7.1 | 3.1 | | | 2023-24 | 4.8 | 7.3 | 5.0 | 8.4 | 6.9 | 7.9 | 2.9 | | PVBs | 2022-23 | 3.8 | 6.4 | 4.1 | 9.2 | 6.3 | 8.4 | 4.3 | | | 2023-24 | 4.8 | 9.2 | 5.4 | 10.4 | 6.8 | 9.5 | 4.1 | | FBs | 2022-23 | 2.9 | 4.0 | 3.1 | 8.2 | 5.8 | 6.9 | 3.8 | | | 2023-24 | 3.8 | 5.6 | 4.1 | 8.7 | 6.8 | 7.6 | 3.5 | | SFBs | 2022-23 | 5.9 | 7.3 | 6.1 | 16.5 | 6.7 | 14.2 | 8.0 | | | 2023-24 | 6.8 | 8.2 | 7.0 | 17.0 | 6.9 | 14.5 | 7.5 | | PBs | 2022-23 | 2.1 | 7.8 | 2.4 | 6.0 | 5.6 | 5.6 | 3.3 | | | 2023-24 | 2.0 | 11.2 | 2.4 | 10.0 | 7.6 | 7.6 | 5.2 | | All SCBs | 2022-23 | 3.8 | 6.1 | 4.0 | 8.2 | 6.3 | 7.6 | 3.6 | | | 2023-24 | 4.8 | 8.1 | 5.1 | 9.3 | 6.9 | 8.5 | 3.4 | Notes: 1. Cost of deposits = Interest paid on deposits/Average of current and previous year’s deposits.
2. Cost of borrowings = (Interest expended - Interest on deposits)/Average of current and previous year’s borrowings.
3. Cost of funds = Interest expended / (Average of current and previous year’s deposits plus borrowings)
4. Return on advances = Interest earned on advances /Average of current and previous year’s advances.
5. Return on investments = Interest earned on investments /Average of current and previous year’s investments.
6. Return on funds = (Interest earned on advances + Interest earned on investments) / (Average of current and previous year’s advances plus investments).
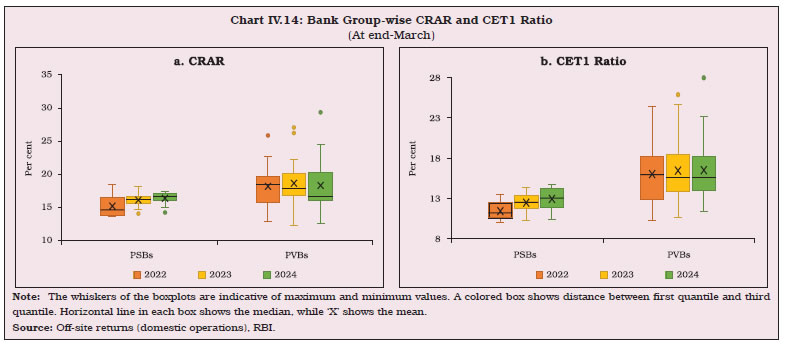
Source: Calculated from balance sheets of respective banks. | 4. Soundness Indicators 4.1 Capital Adequacy IV.22 The minimum capital to risk-weighted assets ratio (CRAR) requirement for banks in India is set at 9 per cent [11.5 per cent inclusive of capital conservation buffer (CCB)]and Tier 1 capital requirement is set at 7 per cent, both one percentage point above the Basel III requirements. At end-March 2024, all bank groups remained well-capitalised, although the CRAR of SCBs moderated by 30 bps to 16.9 per cent while Tier 1 capital stood at 14.8 per cent (Table IV.6). The fall in CRAR was due to an increase in risk-weighted assets (RWAs) exceeding the increase in capital funds. Supervisory data indicate that the CRAR of SCBs was 16.8 per cent at end-September 2024. IV.23 The dispersion of CRAR and CET1 among constituent banks was higher for PVBs than PSBs (Chart IV.14a and b). The mean as well as median of both CRAR and CET1 was higher for PVBs than those for PSBs. | Table IV.6: Component-wise Capital Adequacy of SCBs | | (At end-March) | | (Amount in ₹ crore) | | | PSBs | PVBs | FBs | SCBs | | 2023 | 2024 | 2023 | 2024 | 2023 | 2024 | 2023 | 2024 | | 1 | 2 | 3 | 4 | 5 | 6 | 7 | 8 | 9 | | 1. Capital Funds | 10,16,789 | 11,74,245 | 10,20,953 | 12,83,455 | 2,43,096 | 2,70,646 | 23,15,358 | 27,69,950 | | i) Tier 1 Capital | 8,47,783 | 9,94,510 | 9,11,271 | 11,55,051 | 2,20,746 | 2,43,842 | 20,10,443 | 24,30,733 | | ii) Tier 2 Capital | 1,69,006 | 1,79,735 | 1,09,681 | 1,28,404 | 22,350 | 26,804 | 3,04,915 | 3,39,217 | | 2. Risk Weighted Assets | 65,48,771 | 75,59,396 | 54,85,172 | 72,14,513 | 12,50,775 | 14,18,639 | 1,34,38,317 | 1,63,84,879 | | 3. CRAR (1 as % of 2) | 15.5 | 15.5 | 18.6 | 17.8 | 19.4 | 19.1 | 17.2 | 16.9 | | Of which: Tier 1 | 12.9 | 13.2 | 16.6 | 16.0 | 17.6 | 17.2 | 15.0 | 14.8 | | Tier 2 | 2.6 | 2.4 | 2.0 | 1.8 | 1.8 | 1.9 | 2.3 | 2.1 | | Source: Off-site returns, RBI. |
 IV.24 Banks across groups and sizes have consistently maintained CRAR above the regulatory minimum requirements (Chart IV.15). The CCB was made applicable for Indian banks in tranches from 2016. Excess CRAR, calculated over and above the then applicable minimum CRAR inclusive of CCB, is influenced by a multitude of factors (Box IV.2). 
Box IV.2: Why do Banks Hold Excess CRAR? Banks maintain excess CRAR as a buffer against unexpected losses and economic downturns, and to boost their market reputation (Lindquist, 2004). CRARs above regulatory requirements could have opportunity costs for banks, as excess capital could have been invested in higher-yielding assets, including for extending credit (Kashyap, Rajan, and Stein, 2002). The potential drivers of excess CRAR are estimated by using supervisory quarterly panel data for 33 PSBs and PVBs from March 2012 to December 2023 in fixed effects regression models. The results indicate that profitability indicators like RoA or NIM positively impact excess CRAR (Table IV.2.1). Conversely, the ex-post credit risk of banks, measured by the lagged GNPA ratio or net NPA (NNPA) ratio, dampens excess CRAR as banks with weaker asset quality anticipate higher provisions. Additionally, a larger loan portfolio (measured by loans-to-assets ratio) requires more capital, resulting in a negative relationship with excess CRAR. The size of a bank, measured by the log of total assets, turns out to be negatively related to excess CRAR — larger banks may have the advantage of portfolio diversification, economies of scale and easier access to capital markets (Berger & Bouwman, 2009). The decision to hold excess capital can also be influenced by peer behaviour (Angora, Distinguin, and Rugemintwari, 2009). In the Indian context, the average excess capital held by banks within the same category (size-wise groups of PSBs and PVBs) shows a significant and positive relationship with a bank’s own excess CRAR. The weighted average call rate (WACR), a proxy for opportunity cost of holding excess capital, dampens excess capital holdings. Excess CRAR also appears to be procyclical, as evident from its positive and significant relationship with GDP growth. In conclusion, banks maintaining excess CRAR may be influenced by their own financial conditions as well as peer influences apart from macroeconomic conditions. | Table IV.2.1: Regression Results | | Dependent variable: Excess CRAR | | | Model 1 | Model 2 | Model 3 | | Lag (RoA) | 0.865*** | | 1.115*** | | | (0.0673) | | (0.0754) | | Lag (NIM) | | 1.091*** | | | | | (0.0859) | | | Lag (NNPA ratio) | -0.0783*** | | | | | (0.0262) | | | | Lag (GNPA ratio) | | -0.197*** | -0.0935*** | | | | (0.0140) | (0.0162) | | Lag (loans-to-assets) | -0.0339*** | | -0.0274** | | | (0.0102) | | (0.0118) | | Lag (credit growth) | | 0.00347 | | | | | (0.00475) | | | Group excess CRAR | 0.649*** | | | | | (0.0474) | | | | Log (total assets) | | -0.676*** | -0.315* | | | | (0.160) | (0.165) | | WACR | -0.116*** | -0.439*** | -0.411*** | | | (0.0305) | (0.0397) | (0.0405) | | GDP growth | 0.00120 | 0.0334*** | 0.0243*** | | | (0.00792) | (0.00848) | (0.00845) | | Constant | 3.892*** | 12.21*** | 11.86*** | | | (0.689) | (2.084) | (2.027) | | Observations | 1,518 | 1,509 | 1,518 | | Fixed Effects | Yes | Yes | Yes | | R-squared | 0.394 | 0.267 | 0.289 | | Number of banks | 33 | 33 | 33 | Notes: 1. Figures in parentheses indicate robust standard errors clustered at bank level.
2. ***, ** and * represent 1 per cent, 5 per cent and 10 per cent levels of significance, respectively.
Source: RBI staff estimates. | References: Angora, A., Distinguin, I., and Rugemintwari, C. (2009). Excess Capital of European Banks: Does Bank Heterogeneity Matter? Working paper. University of Limoges. Berger, A. N., and Bouwman, C. H. (2009). Bank Liquidity Creation. The Review of Financial Studies, 22(9), 3779-3837. Kashyap, A. K., Rajan, R. G., and Stein, J. C. (2002). Banks as Liquidity Providers: An Explanation for the Coexistence of Lending and Deposit-taking. Journal of Finance, 57(1), 33-73. Lindquist, K.-G. (2004). Banks’ Buffer Capital: How Important is Risk. Journal of International Money and Finance, 23(3), 493-513. | IV.25 Resources raised by banks through private placement of debt, qualified institutional placement and preferential allotment of equity increased marginally during 2023-24. PSBs recorded a notable increase of 38.6 per cent in total amount raised during 2023-24 compared to 2022-23 (Table IV.7). | Table IV.7: Resources Raised by Banks through Private Placements | | (Amount in ₹ crore) | | | 2021-22 | 2022-23 | 2023-24 | 2024-25 (Up to October) | | No. of issues | Amount raised | No. of issues | Amount raised | No. of issues | Amount raised | No. of issues | Amount raised | | 1 | 2 | 3 | 4 | 5 | 6 | 7 | 8 | 9 | | PSBs | 34 | 70,719 | 27 | 70,260 | 26 | 97,380 | 17 | 90,811 | | PVBs | 16 | 40,034 | 14 | 52,903 | 14 | 33,426 | 6 | 14,519 | | FBs | 0 | 0 | 2 | 224 | 0 | 0 | 0 | 0 | | Total | 50 | 1,10,753 | 43 | 1,23,387 | 40 | 1,30,806 | 23 | 1,05,330 | Notes: 1. Include private placement of debt, qualified institutional placement and preferential allotment.
2. Data for 2024-25 are provisional.
Source: SEBI, BSE and NSE. | 4.2 Leverage and Liquidity IV.26 The leverage ratio (LR) is a non-risk based backstop measure complementing the Basel III risk-based capital framework. The LR — the ratio of Tier 1 capital to total exposures — improved during 2023-24 for all bank groups, except FBs (Table IV.8). IV.27 The liquidity coverage ratio (LCR) — designed to help banks withstand liquidity pressures in the short-term — requires banks to maintain high quality liquid assets (HQLAs) to meet 30 days’ net outgo under stressed conditions. At end-March 2024, the LCR was 130.3 per cent, which was above the required 100 per cent, notwithstanding some moderation during the year (Table IV.8). IV.28 The net stable funding ratio (NSFR) – the ratio of available stable funding to required stable funding – limits overreliance of banks on short-term wholesale funding and encourages better assessment of funding risk across all on-and off-balance sheet items, promoting funding stability. In line with international standards, the minimum NSFR that banks in India are required to maintain is set at 100 per cent. At end-March 2024, all bank groups met this target (Table IV.9). 4.3 Non-Performing Assets IV.29 The improvement in asset quality of banks, measured by their GNPA ratios, commenced in 2018-19. GNPAs of SCBs reduced by 15.9 per cent y-o-y to ₹4.8 lakh crore as on March 31, 2024. The GNPA ratio declined to 2.7 per cent at end-March 20248, the lowest in 13 years, from 3.9 per cent at end-March 2023. During 2023-24, around 44.4 per cent of the reduction in GNPAs was attributable to better recoveries and upgradations. | Table IV.8: Leverage Ratio and Liquidity Coverage Ratio | | (in Per cent) | | | Leverage Ratio | Liquidity Coverage Ratio | | Mar-22 | Mar-23 | Mar-24 | Sep-24 | Mar-22 | Mar-23 | Mar-24 | Sep-24 | | 1 | 2 | 3 | 4 | 5 | 6 | 7 | 8 | 9 | | PSBs | 5.1 | 5.5 | 6.0 | 6.0 | 155.8 | 153.5 | 129.3 | 127.4 | | PVBs | 9.7 | 9.6 | 9.7 | 10.0 | 127.7 | 127.9 | 127.1 | 126.1 | | FBs | 11.0 | 11.0 | 10.8 | 10.6 | 171.0 | 154.6 | 145.0 | 142.6 | | All SCBs | 7.2 | 7.4 | 7.8 | 7.9 | 147.1 | 144.6 | 130.3 | 128.6 | | Source: Off-site returns (global operations), RBI. |
| Table IV.9: Net Stable Funding Ratio | | (At end-March 2024) | | (Amount in ₹ crore) | | | Available Stable Funding | Required Stable Funding | NSFR (per cent) | | 1 | 2 | 3 | 4 | | Public Sector Banks | 1,11,95,611 | 88,65,493 | 126.3 | | Private Sector Banks | 77,28,087 | 60,47,820 | 127.8 | | Foreign Banks | 6,78,655 | 5,34,056 | 127.1 | | Small Finance Banks | 2,04,965 | 1,63,860 | 125.1 | | Scheduled Commercial Banks | 1,98,07,318 | 1,56,11,229 | 126.9 | | Source: Off-site returns (global operations), RBI. | IV.30 The net NPA (NNPA) ratio also declined to a decadal low of 0.62 per cent at end-March 2024, driven by stronger provision buffers (Table IV.10). At end-September 2024, the NNPA ratio improved further to 0.57 per cent. IV.31 The slippage ratio, which measures new accretions to NPAs as a share of standard advances at the beginning of the year, improved during 2023-24 (Chart IV.16a). For the third consecutive year, the slippage ratio of PVBs remained higher than PSBs on account of the former’s larger fresh accretion to NPAs (Chart IV.16b). IV.32 Reflecting these gains in asset quality, the proportion of standard assets in total advances increased for all bank groups at end-March 2024 from a year ago. The decline in share of non-standard advances (comprising sub-standard, doubtful and loss advances) was led by moderation in doubtful assets (Table IV.11). IV.33 The share of large borrowal accounts9 in total advances of SCBs declined to 43.9 per cent at end-March 2024 from 46.5 per cent at the end of the previous year. The special mention accounts-1 (SMA-1)10 ratio declined for both PVBs and PSBs, overall as well as for large borrowal accounts (Chart IV.17). 
| Table IV.10: Movements in Non-Performing Assets by Bank Group | | (Amount in ₹ crore) | | | PSBs | PVBs | FBs | SFBs# | All SCBs | | 1 | 2 | 3 | 4 | 5 | 6 | | Gross NPAs | | | | | | | Closing Balance for 2022-23 | 4,28,197 | 1,25,214 | 9,526 | 8,608 | 5,71,546 | | Opening Balance for 2023-24 | 4,28,197 | 1,25,214 | 9,526 | 8,608 | 5,71,546 | | Addition during the year 2023-24 | 84,435 | 1,16,801 | 5,199 | 7,152 | 2,13,587 | | Reduction during the year 2023-24 | 1,73,090 | 1,12,852 | 8,202 | 10,170 | 3,04,314 | | i. Recovered | 43,018 | 25,794 | 3,513 | 2,348 | 74,673 | | ii. Upgradations | 17,558 | 38,856 | 1,961 | 2,159 | 60,535 | | iii. Written-off | 1,12,515 | 48,202 | 2,728 | 5,662 | 1,69,106 | | Closing Balance for 2023-24 | 3,39,541 | 1,29,164 | 6,523 | 5,590 | 4,80,818 | | Gross NPAs as per cent of Gross Advances* | | | | | | | Closing Balance for 2022-23 | 5.0 | 2.3 | 1.9 | 4.7 | 3.9 | | Closing Balance for 2023-24 | 3.5 | 1.9 | 1.2 | 2.4 | 2.7 | | Net NPAs | | | | | | | Closing Balance for 2022-23 | 1,02,532 | 29,510 | 1,656 | 1,622 | 1,35,320 | | Closing Balance for 2023-24 | 72,544 | 31,594 | 799 | 1,796 | 1,06,732 | | Net NPAs as per cent of Net Advances | | | | | | | 2022-23 | 1.2 | 0.5 | 0.3 | 0.9 | 0.9 | | 2023-24 | 0.8 | 0.5 | 0.1 | 0.8 | 0.6 | Notes: 1. #: Data pertain to scheduled SFBs.
2. *: Calculated by taking gross NPAs from annual accounts of respective banks and gross advances from off-site returns (global operations).
Source: Annual accounts of banks and off-site returns (global operations), RBI. | IV.34 Restructured accounts had increased significantly in 2021-22 due to resolution schemes (RSA 1.0 and RSA 2.0) introduced in the aftermath of the pandemic. Subsequently, reflecting the expiry of deadlines for invocation of the restructured standard advances (RSA) and also improvements in asset quality, the number of restructured accounts declined, for both PSBs and PVBs. The share of RSA in gross loans and advances declined overall as well as for large borrowal accounts. The share remained lower for PVBs than for PSBs (Chart IV.18). | Table IV.11: Classification of Loan Assets by Bank Group | | (Amount in ₹ crore) | | Bank Group | End-March | Standard Assets | Sub-standard Assets | Doubtful Assets | Loss Assets | | Amount | Per cent* | Amount | Per cent* | Amount | Per cent* | Amount | Per cent* | | 1 | 2 | 3 | 4 | 5 | 6 | 7 | 8 | 9 | 10 | | PSBs | 2023 | 72,86,427 | 94.8 | 62,444 | 0.8 | 2,28,806 | 3.0 | 1,10,054 | 1.4 | | | 2024 | 84,24,922 | 96.3 | 58,576 | 0.7 | 1,78,483 | 2.0 | 83,681 | 1.0 | | PVBs | 2023 | 51,99,732 | 97.8 | 34,288 | 0.6 | 52,469 | 1.0 | 29,033 | 0.5 | | | 2024 | 66,96,942 | 98.2 | 44,199 | 0.6 | 52,944 | 0.8 | 26,397 | 0.4 | | FBs | 2023 | 4,89,212 | 98.1 | 1,697 | 0.3 | 6,648 | 1.3 | 1,182 | 0.2 | | | 2024 | 5,39,598 | 98.8 | 1,344 | 0.2 | 4,228 | 0.8 | 950 | 0.2 | | SFBs** | 2023 | 1,76,199 | 95.3 | 3,035 | 1.6 | 2,491 | 1.3 | 3,082 | 1.7 | | | 2024 | 2,24,245 | 97.6 | 4,005 | 1.7 | 1,514 | 0.7 | 71 | 0.0 | | All SCBs | 2023 | 1,31,51,571 | 96.1 | 1,01,465 | 0.7 | 2,90,414 | 2.1 | 1,43,351 | 1.0 | | | 2024 | 1,58,85,707 | 97.2 | 1,08,125 | 0.7 | 2,37,169 | 1.5 | 1,11,099 | 0.7 | Notes: 1. *: As per cent of gross advances.
2. **: Data pertain to scheduled SFBs.
Source: Off-site returns (domestic operations), RBI. |
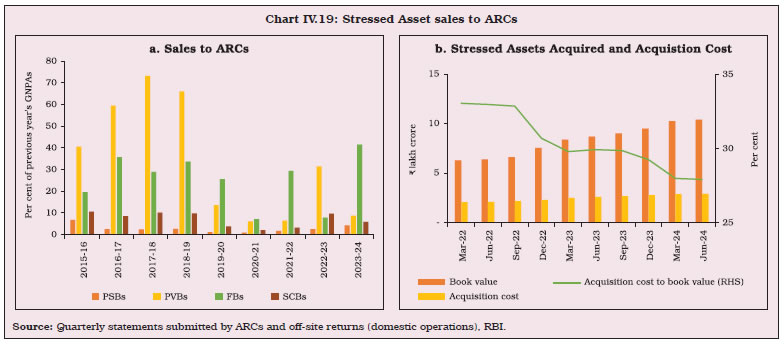
4.4 Recoveries IV.35 During 2023-24, the number of cases referred for resolution declined across channels, except those under the Securitisation and Reconstruction of Financial Assets and Enforcement of Security Interest (SARFAESI) Act. The increase in the number of SARFAESI cases during 2023-24 reflected a low base as the number of cases had declined by 24.6 per cent during 2022-23. The Insolvency and Bankruptcy Code (IBC) remained the dominant mode of recovery, with a share of 48.1 per cent in total amount recovered in 2023-24 (Table IV.12). Under the IBC, the realisable value remained high at 161.1 per cent of liquidation value at end-September 2024.  IV.36 Banks also cleaned up their balance sheets through sale of NPAs to asset reconstruction companies (ARCs). During 2023-24, the ratio of asset sales to GNPAs declined to 5.8 per cent from 9.7 per cent in the previous year. Amongst bank groups, the ratio increased for PSBs and FBs due to higher sale to ARCs as well as moderation in GNPAs. In the case of PVBs, the decline in sales to ARCs outpaced the reduction in GNPAs, pulling the ratio down (Chart 19a). The acquisition cost of ARCs as a proportion of their book values of assets declined for the second consecutive year in 2023-24, suggesting lower realisable value of the assets (Chart IV.19b). | Table IV.12: NPAs of SCBs Recovered through Various Channels | | (Amount in ₹ crore) | | Recovery Channel | 2022-23 | 2023-24 (P) | | No. of cases referred | Amount Involved | Amount recovered* | Col. (4) as per cent of Col. (3) | No. of cases Referred | Amount Involved | Amount recovered* | Col. (8) as per cent of Col. (7) | | 1 | 2 | 3 | 4 | 5 | 6 | 7 | 8 | 9 | | Lok Adalats | 1,37,72,958 | 1,88,135 | 3,774 | 2.0 | 1,26,84,815 | 1,89,694 | 3,322 | 1.8 | | DRTs | 56,198 | 4,02,753 | 39,785 | 9.9 | 31,414 | 1,06,887 | 16,202 | 15.2 | | SARFAESI Act | 1,87,340 | 1,11,359 | 30,957 | 27.8 | 2,31,407 | 1,23,363 | 30,460 | 24.7 | | IBC @ | 1,262 | 1,38,715 | 54,161 | 39.0 | 1,004 | 1,63,943 | 46,340 | 28.3 | | Total | 1,40,17,758 | 8,40,962 | 1,28,676 | 15.3 | 1,29,48,640 | 5,83,887 | 96,325 | 16.5 | Notes: 1. P: Provisional.
2. *: Refers to the amount recovered during the given year, which could be with reference to the cases referred during the given year as well as during the earlier years.
3. DRTs: Debt Recovery Tribunals.
4. @: Cases admitted by National Company Law Tribunals (NCLTs).
Source: Off-site returns, RBI and Insolvency and Bankruptcy Board of India (IBBI). | IV.37 Banks and FIs subscribed to 59.1 per cent of the total security receipts (SRs) issued at end-March 2024 as compared with 60.6 per cent a year ago and 62.5 per cent at end-March 2022, indicative of increasing diversification of investor base. The ratio of SRs issued to book value of assets acquired declined from 29.4 per cent during 2022-23 to 27.6 per cent during 2023-24. The SRs completely redeemed, an indicator of recovery through this mode, improved to 37.5 per cent of previous years’ outstanding SRs during 2023-24 from 32.8 per cent during the previous year (Table IV.13). 4.5 Frauds in the Banking Sector IV.38 Frauds present multiple challenges for the financial system in the form of reputational risk, operational risk, business risk and erosion of customer confidence with financial stability implications. During 2023-24, based on date of reporting by banks, the amount involved in frauds was the lowest in a decade, while the average value was the lowest in 16 years (Appendix Table IV.7 and Table IV.14). | Table IV.13: Details of Financial Assets Securitised by ARCs | | (Amount in ₹ crore) | | | Mar-22 | Mar-23 | Mar-24 | | 1 | 2 | 3 | 4 | | Number of reporting ARCs | 29 | 28 | 27 | | 1. Book Value of Assets Acquired | 6,29,314 | 8,39,126 | 10,25,429 | | 2. Security Receipt issued by SCs/RCs | 2,04,841 | 2,46,290 | 2,83,330 | | 3. Security Receipts Subscribed to by | | | | | (a) Banks | 1,28,007 | 1,49,253 | 1,67,483 | | (b) SCs/RCs | 41,350 | 49,519 | 57,201 | | (c) Financial Institutional Investors | 15,069 | 19,383 | 21,518 | | (d) Others (Qualified Institutional Buyers) | 20,415 | 28,135 | 37,128 | | 4. Amount of Security Receipts Completely Redeemed | 31,331 | 41,078 | 52,332 | | 5. Security Receipts Outstanding | 1,25,359 | 1,39,422 | 1,48,070 | Notes: 1. Total as at the end of quarter (Cumulative/stock figures).
2. SCs- Securitisation Companies and RCs – Reconstruction Companies.
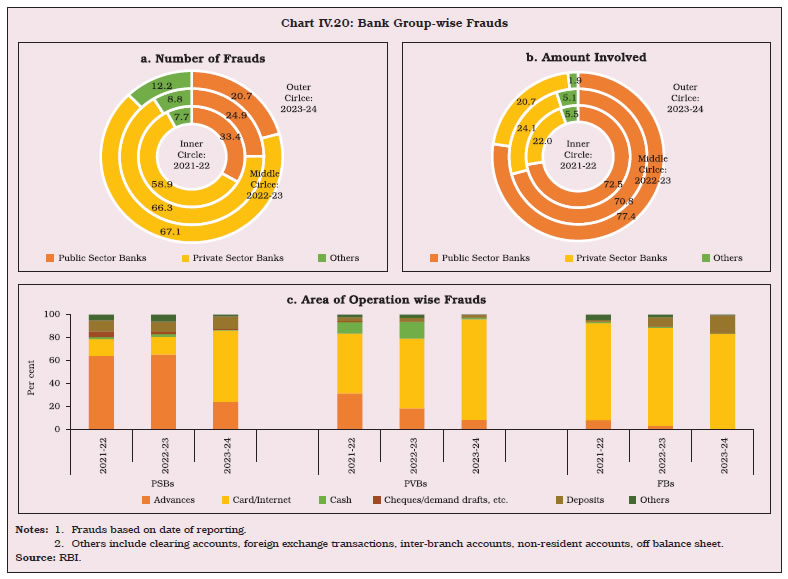
Source: Quarterly statements submitted by ARCs. |
| Table IV.14: Frauds in Various Banking Operations Based on the Date of Reporting | | (Amount in ₹ crore) | | Area of Operation | 2021-22 | 2022-23 | 2023-24 | 2023-24 (April-Sept.) | 2024-25 (April-Sept.) | | Number of frauds | Amount involved | Number of frauds | Amount involved | Number of frauds | Amount involved | Number of frauds | Amount involved | Number of frauds | Amount involved | | 1 | 2 | 3 | 4 | 5 | 6 | 7 | 8 | 9 | 10 | 11 | | Advances | 3,745 | 41,485 | 4,063 | 22,421 | 4,124 | 11,017 | 1,136 | 1,747 | 3,531 | 19,748 | | Off-balance Sheet | 21 | 1,077 | 14 | 285 | 11 | 256 | 4 | 73 | 0 | 0 | | Forex Transactions | 7 | 7 | 13 | 12 | 19 | 38 | 5 | 5 | 6 | 1 | | Card/Internet | 3,596 | 155 | 6,699 | 277 | 29,082 | 1,457 | 12,069 | 630 | 13,133 | 514 | | Deposits | 471 | 493 | 652 | 258 | 2,002 | 240 | 915 | 103 | 934 | 363 | | Inter-Branch Accounts | 3 | 2 | 3 | - | 29 | 10 | 0 | 0 | 3 | 1 | | Cash | 649 | 93 | 1,485 | 159 | 484 | 78 | 210 | 31 | 205 | 18 | | Cheques/DDs, etc. | 201 | 158 | 118 | 25 | 127 | 42 | 60 | 14 | 49 | 54 | | Clearing Accounts, etc. | 16 | 1 | 18 | 3 | 17 | 2 | 2 | 0 | 3 | 1 | | Others | 300 | 100 | 472 | 423 | 171 | 35 | 79 | 20 | 597 | 667 | | Total | 9,009 | 43,571 | 13,537 | 23,863 | 36,066 | 13,175 | 14,480 | 2,623 | 18,461 | 21,367 | Notes: 1. Refers to frauds of ₹1 lakh and above.
2. The figures reported by banks and financial institutions are subject to change based on revisions filed by them.
3. Frauds reported in a year could have occurred several years prior to year of reporting.
4. Amounts involved are as reported and do not reflect the amount of loss incurred. Depending on recoveries, the loss incurred gets reduced. Further, the entire amount involved in loan accounts is not necessarily diverted.
5. Post issuance of revised Master Directions on Fraud Risk Management dated July 15, 2024, the banks are reporting only those payment system related transactions which are concluded as fraud committed on bank(s).
Source: RBI. | IV.39 Based on the date of occurrence of frauds, in 2023-24, the share of internet and card frauds in the total stood at 44.7 per cent in terms of amount and 85.3 per cent in terms of number of cases (Table IV.15). IV.40 In 2023-24, the number of fraud cases reported by PVBs accounted for 67.1 per cent of the total (Chart IV.20a). In terms of amount involved, however, PSBs had the highest share (Chart IV.20b). In terms of number of frauds, the share of card and internet frauds was highest for all bank groups in 2023-24 (Chart IV.20c). | Table IV.15: Frauds in Various Banking Operations Based on the Date of Occurrence | | (Amount in ₹ crore) | | Area of Operation | Prior to 2021-22 | 2021-22 | 2022-23 | 2023-24 | 2024-25 (April - Sept.) | | Number of frauds | Amount involved | Number of frauds | Amount involved | Number of frauds | Amount involved | Number of frauds | Amount involved | Number of frauds | Amount involved | | 1 | 2 | 3 | 4 | 5 | 6 | 7 | 8 | 9 | 10 | 11 | | Advances | 7,435 | 82,256 | 2,541 | 8,867 | 2,942 | 2,343 | 2,115 | 1,127 | 430 | 76 | | Off-balance Sheet | 40 | 1,592 | 2 | 27 | 4 | 0 | 0 | 0 | 0 | 0 | | Forex Transactions | 3 | 1 | 9 | 8 | 21 | 47 | 11 | 2 | 1 | 0 | | Card/Internet | 1,078 | 165 | 4,395 | 173 | 11,979 | 626 | 27,604 | 1,214 | 7,454 | 225 | | Deposits | 519 | 621 | 456 | 122 | 716 | 200 | 1,903 | 230 | 465 | 182 | | Inter-Branch Accounts | 6 | 2 | 8 | 1 | 20 | 1 | 4 | 9 | 0 | 0 | | Cash | 284 | 52 | 941 | 101 | 1,047 | 116 | 455 | 71 | 96 | 8 | | Cheques/DDs, etc. | 108 | 156 | 169 | 29 | 107 | 22 | 89 | 36 | 22 | 36 | | Clearing Accounts, etc. | 9 | 1 | 19 | 4 | 14 | 1 | 12 | 2 | 0 | 0 | | Others | 314 | 227 | 216 | 84 | 382 | 268 | 177 | 26 | 451 | 619 | | Total | 9,796 | 85,073 | 8,756 | 9,416 | 17,232 | 3,624 | 32,370 | 2,717 | 8,919 | 1,146 | Notes: 1. Refers to frauds of ₹1 lakh and above.
2. The figures reported by banks and financial institutions are subject to change based on revisions filed by them.
3. Data based on date of occurrence may change for a period of time as frauds reported late but having occurred earlier would get added.
4. Data in the table pertain to cases reported from FY 2021-22 till September 30, 2024.
5. Amounts involved are as reported and do not reflect the amount of loss incurred. Depending on recoveries, the loss incurred gets reduced. Further, the entire amount involved in loan accounts is not necessarily diverted.
6. Post issuance of revised Master Directions on Fraud Risk Management dated July 15, 2024, the banks are reporting only those payment system related transactions which are concluded as fraud committed on bank(s).
Source: RBI. |
4.6 Enforcement Actions IV.41 Instances of penalty imposed on regulated entities (REs) increased during 2023-24 across all bank groups, except FBs and SFBs. The total penalty amount more than doubled in 2023-24, led by public and private sector banks. The amount of penalty imposed on co-operative banks declined during the year, while there was an increase in instances of penalty imposition (Table IV.16). | Table IV.16: Enforcement Actions | | Regulated Entity | 2022-23 | 2023-24 | | Instances of imposition of penalty | Total Penalty (₹ crore) | Instances of imposition of penalty | Total Penalty (₹ crore) | | 1 | 2 | 3 | 4 | 5 | | Public Sector Banks | 7 | 3.6 | 16 | 23.7 | | Private Sector Bank | 7 | 12.2 | 12 | 24.9 | | Co-operative Banks | 176 | 14.0 | 215 | 12.1 | | Foreign Banks | 5 | 4.7 | 3 | 7.0 | | Payments Banks | - | - | 1 | 5.4 | | Small Finance Banks | 2 | 1.0 | 1 | 0.3 | | Regional Rural Banks | 1 | 0.4 | 4 | 0.1 | | NBFCs | 11 | 4.4 | 22 | 11.5 | | HFCs | 2 | 0.1 | 3 | 0.1 | | CICs | - | - | 4 | 1.0 | | Total | 211 | 40.4 | 281 | 86.1 | | Source: RBI. | 5. Sectoral Bank Credit: Distribution and NPAs IV.42 Bank credit growth in 2023-24 was broad-based, led by services sector and personal loans segment, followed by agriculture and industry (Table IV.17)11. To address the build-up of any risks due to high growth in certain sub-segments of consumer credit and increasing dependence of NBFCs on banks’ borrowings, the Reserve Bank on November 16, 2023 tightened lending norms in these sectors12. Bank credit growth to segments like consumer durables, credit card receivables and lending to NBFCs, for which risk weights were increased, has moderated. | Table IV.17: Sectoral Deployment of Gross Bank Credit by SCBs | | (Amount in ₹ crore) | | Sector | Outstanding as on | Per cent variation (y-o-y) | | | Mar-23 | Mar-24 | Oct-24 | Mar-23 | Mar-24 | Oct-24 | | 1. Agriculture and Allied Activities | 17,26,410 | 20,71,251 | 22,05,299 | 15.4 | 20.0 | 15.5 | | 2. Industry (Micro and Small, Medium and Large) | 33,66,406 | 36,52,804 | 37,74,252 | 5.8 | 8.5 | 7.9 | | | | (36,35,810) | (37,59,186) | | (8.0) | (8.0) | | 2.1. Micro and Small | 6,33,289 | 7,26,315 | 7,49,790 | 13.1 | 14.7 | 10.0 | | 2.2. Medium | 2,68,286 | 3,03,998 | 3,35,822 | 12.3 | 13.3 | 19.6 | | 2.3. Large | 24,64,831 | 26,22,490 | 26,88,640 | 3.5 | 6.4 | 6.0 | | 3. Services, of which | 37,18,805 | 45,92,227 | 47,84,938 | 19.5 | 23.5 | 12.7 | | | | (44,90,467) | (47,04,550) | | (20.8) | (14.1) | | 3.1. Transport Operators | 1,92,059 | 2,30,175 | 2,46,407 | 14.7 | 19.8 | 15.0 | | 3.2. Computer Software | 24,924 | 25,917 | 30,581 | 7.1 | 4.0 | 24.0 | | 3.3. Tourism, Hotels and Restaurants | 69,342 | 77,513 | 79,732 | 3.3 | 11.8 | 5.4 | | 3.4. Trade | 8,72,340 | 10,25,752 | 10,79,498 | 18.5 | 17.6 | 12.4 | | 3.5. Commercial Real Estate | 3,22,591 | 4,69,013 | 5,07,671 | 8.4 | 45.4 | 13.9 | | | | (4,00,470) | (4,52,869) | | (24.1) | (26.0) | | 3.6. Non-Banking Financial Companies (NBFCs) | 13,42,539 | 15,48,027 | 15,36,655 | 29.9 | 15.3 | 6.4 | | 4. Personal Loans, of which | 41,82,767 | 53,31,290 | 56,47,476 | 20.7 | 27.5 | 12.9 | | | | (49,19,468) | (52,78,594) | | (17.6) | (15.8) | | 4.1. Consumer Durables | 20,985 | 23,713 | 23,640 | 17.7 | 13.0 | 6.6 | | 4.2. Housing (Including Priority Sector Housing) | 19,91,164 | 27,18,715 | 28,71,845 | 14.5 | 36.5 | 12.1 | | | | (23,31,935) | (25,25,138) | | (17.1) | (17.8) | | 4.3. Advances against Fixed Deposits (Including FCNR (B), NRNR Deposits etc.) | 1,22,484 | 1,25,239 | 1,27,533 | 46.4 | 2.2 | 10.9 | | 4.4. Advances to Individuals against Shares, Bonds, etc. | 7,633 | 8,492 | 9,060 | 12.1 | 11.3 | 16.0 | | 4.5. Credit Card Outstanding | 2,04,708 | 2,57,016 | 2,81,392 | 32.5 | 25.6 | 16.9 | | 4.6. Education | 96,482 | 1,19,380 | 1,30,309 | 15.3 | 23.7 | 17.6 | | 4.7. Vehicle Loans | 5,01,979 | 5,89,251 | 6,16,405 | 24.0 | 17.4 | 11.4 | | 4.8. Loans against Gold Jewellery | 89,370 | 1,02,562 | 1,54,282 | 19.6 | 14.8 | 56.2 | | 5. Bank Credit | 1,36,75,235 | 1,64,32,164 | 1,72,38,250 | 15.0 | 20.2 | 11.5 | | | | (1,59,01,477) | (1,67,72,605) | | (16.3) | (12.8) | | 5.1 Non-food Credit | 1,36,55,330 | 1,64,09,083 | 1,72,19,596 | 15.4 | 20.2 | 11.5 | | | | (1,58,78,397) | (1,67,53,951) | | (16.3) | (12.8) | Notes: 1. Data are provisional.
2. Data since July 28, 2023 include the impact of the merger of a non-bank with a bank. Figures in parentheses exclude the impact of the merger.
3. NBFCs include HFCs, PFIs, microfinance Institutions (MFIs), NBFCs engaged in gold loan and others.
Source: RBI. | IV.43 The shares of services and personal loans segments in total credit have grown from 21.9 per cent and 17.1 per cent, respectively, at end-March 2013 to 27.9 per cent and 32.4 per cent, respectively, at end-March 202413. Credit diversification can help banks improve their profitability (Box IV.3). Box IV.3: Impact of Credit Diversification on Banks’ Profitability Portfolio diversification reduces financial intermediation cost of banks and can enhance their profitability (Diamond 1984). Sectoral credit diversification, however, can also lead to scale inefficiency which can reduce banks’ profitability (Acharya, 2006). Empirical evidence of the impact of sectoral credit diversification on bank profitability is, therefore, mixed (Mulwa, 2018). The impact of diversification on banks’ profitability is examined in a fixed effect panel framework (Eq. 1) using quarterly data for 12 public and 19 private sector banks for the period March 2015 to December 2023. where, NIMit is the net interest margin of bank i at time t, Dit is the diversification measure of bank i at time t, Vit is a vector of control variables including bank assets, GNPA ratio, credit growth and IIP growth. Drawing from literature, two diversification indices are constructed, the first using the Hirschman-Herfindahl methodology and the other using Shannon Entropy. where Sit is the share of each sector14 in total credit of bank i at time t. Higher value of each of the indices indicates higher portfolio diversification. The scatter plot suggests a positive relationship between portfolio diversification and banks’ profitability (Chart IV.3.1). The results indicate a positive and significant relationship between NIM and diversification indices, suggesting that portfolio diversification has benefitted banks in terms of profitability. Additionally, asset quality, measured by the GNPA ratio, is negatively correlated with NIM. The differential impact of credit diversification on profitability of PVBs vis-à-vis PSBs, measured by the interaction of the private bank dummy with the diversification indices (PVB*HHI and PVB*Entropy), is found to be insignificant. This suggests a symmetric impact of credit diversification on profitability of both PVBs and PSBs (Table IV.3.1). 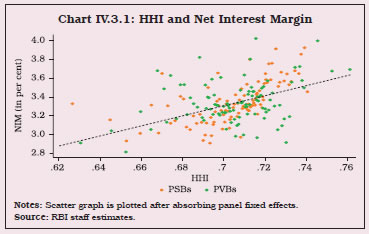
| Table IV.3.1: Regression Results | | Variables | Dependent variable: Net interest margin | | (1) | (2) | (3) | (4) | | Lag (HHI) | 3.096*** | 2.201 | | | | | (0.957) | (1.319) | | | | Lag (entropy) | | | 1.712*** | 1.595* | | | | | (0.423) | (0.790) | | Lag (log assets) | 0.0404 | -0.000524 | -0.0168 | -0.0248 | | | (0.372) | (0.364) | (0.379) | (0.370) | | Lag (GNPA ratio) | -0.0307*** | -0.0309*** | -0.0308*** | -0.0309*** | | | (0.00544) | (0.00542) | (0.00548) | (0.00549) | | Lag (credit growth) (y-o-y) | 0.00392 | 0.00429 | 0.00413 | 0.00419 | | | (0.00246) | (0.00251) | (0.00246) | (0.00248) | | AQR dummy | -0.183*** | -0.190*** | -0.189*** | -0.190*** | | | (0.0455) | (0.0494) | (0.0463) | (0.0509) | | Covid dummy | -0.00876 | -0.00214 | -0.00777 | -0.00632 | | | (0.0366) | (0.0348) | (0.0365) | (0.0353) | | Lag (PVB*HHI) | | 1.345 | | | | | | (1.671) | | | | Lag (PVB*Entropy) | | | | 0.149 | | | | | | (0.911) | | Log(IIP) | 1.337** | 1.402** | 1.348** | 1.364** | | | (0.508) | (0.528) | (0.509) | (0.533) | | Constant | -1.573 | -1.441 | -1.326 | -1.283 | | | (1.495) | (1.426) | (1.498) | (1.398) | | Observations | 1,081 | 1,081 | 1,081 | 1,081 | | R-squared | 0.738 | 0.738 | 0.739 | 0.739 | | Fixed Effects | Yes | Yes | Yes | Yes | | Number of Banks | 31 | 31 | 31 | 31 | Notes: 1. Figures in parentheses indicate robust standard errors.
2. ***, ** and * represent 1 per cent, 5 per cent and 10 per cent levels of significance, respectively.
3. Covid dummy takes value 1 during the quarters ending March 2020 to March 2022 and zero otherwise.
4. AQR dummy takes value 1 during the quarters ending September 2015 to March 2018 and zero otherwise.
Source: RBI staff estimates. | References: Acharya, V., Hasan, I., & Saunders, A. (2006). Should Banks Be Diversified? Evidence from Individual Bank Loan Portfolios. The Journal of Business, 79(3), 1355–1412. Diamond, D. (1984). Financial Intermediation and Delegated Monitoring. The Review of Economic Studies, 51(3), 393. Mulwa, J. (2018). Sectoral Credit Diversification, Bank Performance and Monitoring Effectiveness: A Cross-country Analysis of East African Banking Industries. Journal of Finance and Investment Analysis, 7(2), 17–36. | IV.44 The GNPA ratio remained the highest for the agricultural sector (6.2 per cent) and the lowest for retail loans (1.2 per cent) at end-September 2024. The asset quality of the industrial sector has been improving since March 2018, with the GNPA ratio declining to 2.9 per cent at end-September 2024. The GNPA ratio of sectoral credit across bank groups has converged over the years (Chart IV.21). IV.45 The GNPA ratio of education loans fell from 5.8 per cent at end-March 2023 to 3.6 per cent at end-March 2024 and 2.7 per cent at end-September 2024 but it remained the highest across retail loan segments, followed by credit card receivables and consumer durables (Chart IV.22a). In the services sector, the GNPA ratio of tourism, hotel and restaurants sector remained elevated, notwithstanding a decline from 6.7 per cent at end-March 2023 to 4.3 per cent at end-March 2024 and 4.0 per cent at end-September 2024 (Chart IV.22b). Among the industrial sub-sectors, the GNPA ratio of the gems and jewellery segment moderated from 16.5 per cent at end-March 2023 to 6.7 per cent in March 2024 and 5.0 per cent at end-September 2024, partly reflecting higher recoveries. At end-September 2024, the leather and leather products industry had the highest GNPA ratio of 7.3 per cent, despite some recent improvement (Chart IV.22c).
5.1 Credit to the MSME Sector IV.46 Credit growth of PVBs to the micro, small and medium-sized enterprise (MSME) sector has consistently remained in double digits, reaching 28.7 per cent in 2023-24. Outstanding credit by SCBs to the MSME sector increased to ₹27.25 lakh crore, accounting for 19.3 per cent of the total adjusted net bank credit (ANBC) at end-March 2024. IV.47 The number of MSME credit accounts of SCBs increased during 2023-24, reversing the trend during the period 2020-21 to 2022-23. The growth in the amount of credit to the MSMEs was marginally higher than the growth in the number of accounts, resulting in an increase in average credit (Table IV.18). 5.2 Priority Sector Credit IV.48 SCBs’ priority sector lending rose by 16.9 per cent in 2023-24 from 10.8 per cent in the previous year, with a step up in growth among both PVBs (to 23.5 per cent from 15.7 per cent) and PSBs (to 12.3 per cent from 7.1 per cent). All bank groups managed to achieve their overall priority sector lending targets and sub-targets (Table IV.19). The amount outstanding under operative Kisan Credit Cards (KCC) also registered an improvement in growth to 10.7 per cent during 2023-24 from 8.8 per cent in the previous year, mainly led by the southern region. The southern region also had the highest share of amount outstanding under KCC. Although its growth decelerated to 13.2 per cent during 2023-24 from 18.3 per cent in the previous year, it remained above the all-India expansion rate (Appendix Table IV.8). | Table IV.18: Credit Flow to the MSME sector by SCBs | | (Number of accounts in lakh, amount outstanding in ₹ crore) | | | | 2019-20 | 2020-21 | 2021-22 | 2022-23 | 2023-24 | | 1 | 2 | 3 | 4 | 5 | 6 | 7 | | Public Sector Banks | No. of accounts | 111 | 151 | 150 | 139 | 144 | | | | (-1.9) | (36.1) | (-0.7) | (-7.4) | (4.2) | | | Amount Outstanding | 8,93,315 | 9,08,659 | 9,55,860 | 10,84,953 | 12,22,687 | | | | (1.5) | (1.7) | (5.2) | (13.5) | (11.3) | | Private Sector Banks | No. of accounts | 271 | 267 | 113 | 73 | 110 | | | | (31.8) | (-1.4) | (-57.7) | (-35.2) | (50.2) | | | Amount Outstanding | 6,46,988 | 7,92,042 | 9,69,844 | 10,89,833 | 14,02,324 | | | | (14.8) | (22.4) | (22.4) | (12.4) | (28.7) | | Foreign Banks | No. of accounts | 3 | 3 | 2 | 2 | 3 | | | | (14.1) | (-5.1) | (-19.0) | (-26.3) | (72.9) | | | Amount Outstanding | 73,279 | 83,224 | 85,352 | 85,349 | 1,00,261 | | | | (9.5) | (13.6) | (2.6) | (0.0) | (17.5) | | All SCBs | No. of accounts | 384 | 420 | 265 | 213 | 257 | | | | (19.8) | (9.4) | (-37.0) | (-19.4) | (20.5) | | | Amount Outstanding | 16,13,582 | 17,83,925 | 20,11,057 | 22,60,135 | 27,25,272 | | | | (6.8) | (10.6) | (12.7) | (12.4) | (20.6) | Note: Figures in the parentheses indicate y-o-y growth rates.
Source: RBI. | IV.49 The total trading volume of priority sector lending certificates (PSLCs) grew by 25.5 per cent during 2023-24, primarily led by PSLC-General. Among the four PSLC categories, the small and marginal farmers (SMF) category registered the highest trading volume, partly reflecting specialisation by a few banks in lending to this category of borrowers and the inability of other banks to meet sub-targets through direct lending (Chart IV.23). | Table IV.19: Priority Sector Lending by Banks | | (At end-March 2024) | | (Amount in ₹ crore) | | Item | Target/ sub-target (per cent of ANBC/ CEOBE) | Public Sector Banks | Private Sector Banks | Foreign Banks | Small Finance Banks | Scheduled Commercial Banks | | Amount Outstanding | Per cent of ANBC/ CEOBE | Amount Outstanding | Per cent of ANBC/ CEOBE | Amount Outstanding | Per cent of ANBC/ CEOBE | Amount Outstanding | Per cent of ANBC/ CEOBE | Amount Outstanding | Per cent of ANBC/ CEOBE | | 1 | 2 | 3 | 4 | 5 | 6 | 7 | 8 | 9 | 10 | 11 | 12 | | Total Priority Sector | 40/75* | 31,85,092 | 42.6 | 24,09,329 | 47.4 | 2,51,550 | 41.6 | 1,31,967 | 90.6 | 59,77,938 | 45.0 | | Advances | | | | | | | | | | | | | of which | | | | | | | | | | | | | Total Agriculture | 18.0 | 14,25,554 | 19.1 | 9,51,089 | 18.7 | 49,700 | 18.6 | 38,964 | 26.8 | 24,65,307 | 19.0 | | Small and Marginal Farmers | 10.0 | 8,32,757 | 11.2 | 5,05,484 | 10.0 | 29,309 | 11.0 | 26,517 | 18.2 | 13,94,068 | 10.8 | | Non-corporate Individual Farmers# | 13.8 | 11,05,493 | 14.8 | 7,08,677 | 14.0 | 29,435 | 14.2 | 36,962 | 25.4 | 18,80,568 | 14.6 | | Micro Enterprises | 7.5 | 5,97,854 | 8.0 | 5,17,925 | 10.2 | 22,682 | 8.5 | 47,494 | 32.6 | 11,85,956 | 9.2 | | Weaker Sections | 12.0 | 10,53,784 | 14.1 | 6,37,014 | 12.5 | 32,284 | 12.1 | 52,146 | 35.8 | 17,75,229 | 13.7 | Notes: 1. Amount outstanding and achievement percentage are based on the average achievement of banks for four quarters of the financial year.
2. *: Total priority sector lending target for Small Finance Banks is 75 per cent.
3. #: Target for non-corporate farmers is based on the system-wide average of the last three years’ achievement. For financial year 2023-24, the applicable system wide average figure is 13.78 percent.
4. For foreign banks having less than 20 branches, only the total PSL target of 40 per cent is applicable.
5. Data are provisional.
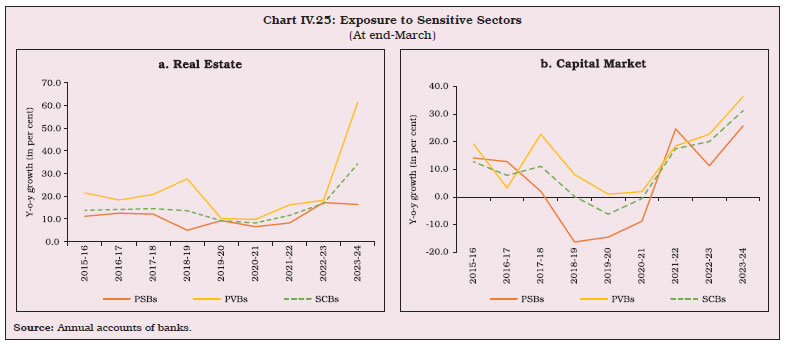
Source: RBI. | IV.50 In the last five years, PVBs have emerged as major sellers of PSLCs. In 2023-24, PVBs accounted for 49.2 per cent of total sales as compared with 20.7 per cent in the case of PSBs (Chart IV.24). IV.51 Over the last three years, the weighted average premium (WAP) has declined for all categories, except for PSLC-SMF. This could be reflective of, inter alia, lower demand for PSLC-micro enterprises as banks make inroads into lending to micro enterprises to meet the PSL sub-targets organically (Table IV.20). IV.52 The GNPA ratio of priority sector lending declined to 4.4 per cent at end-March 2024 from 5.4 per cent at end-March 2023. Nonetheless, the share of the priority sector in total GNPA of SCBs increased to 57.3 per cent at end-March 2024 from 51.1 per cent at end-March 2023, as NPAs in the non-priority sector declined more sharply. NPAs in the priority sector were led by agricultural defaults. IV.53 While PSBs extended 42.6 per cent of their ANBC/ credit equivalent of off-balance sheet exposure (CEOBE) to the priority sector, this portfolio contributed 64.2 per cent to their total NPAs. In the case of SFBs, the priority sector comprises 90.6 per cent of their ANBC/CEOBE; its share in their total NPAs rose significantly to 72.1 per cent in 2023-24 from 42.1 per cent in the previous year (Table IV.21).
| Table IV.20: Weighted Average Premium on Various Categories of PSLCs | | (Per cent) | | | 2020-21 | 2021-22 | 2022-23 | 2023-24 | 2023-24 (Apr-Jun) | 2024-25 (Apr-Jun) | | 1 | 2 | 3 | 4 | 5 | 6 | 7 | | PSLC-Agriculture | 1.55 | 1.37 | 0.62 | 0.24 | 0.27 | 0.24 | | PSLC-Micro Enterprises | 0.88 | 0.95 | 0.16 | 0.04 | 0.12 | 0.01 | | PSLC-Small and Marginal Farmers | 1.74 | 2.01 | 1.68 | 1.74 | 1.98 | 1.97 | | PSLC-General | 0.46 | 0.6 | 0.19 | 0.02 | 0.02 | 0.01 | | Source: RBI. | 5.3 Credit to Sensitive Sectors IV.54 Banks’ exposure to the capital market and real estate is reckoned as sensitive in view of the risks inherent in fluctuations in asset prices. Data compiled using annual accounts of banks suggest that at end-March 2024 PSBs’ exposure to these sectors was 22.1 per cent of their total loans and advances, marginally higher than 21.7 per cent a year ago. PVBs’ exposure to sensitive sectors increased to 34.7 per cent of their total loans and advances from 27.8 per cent a year ago, largely reflecting the merger impact. The growth of capital market exposure of SCBs accelerated to 31.3 per cent during 2023-24 from 20.2 per cent in the previous year, contributed by both the bank groups. (Chart IV.25a and b and Appendix Table IV.9). | Table IV.21: Sector-wise GNPAs of Banks | | (At end-March) | | (Amount in ₹ crore) | | Bank Group | Priority Sector | Of which | Non-priority Sector | Total NPAs | | | Agriculture | Micro and Small Enterprises | Others | | Amount | Per cent | Amount | Per cent | Amount | Per cent | Amount | Per cent | Amount | Per cent | Amount | Per cent | | 1 | 2 | 3 | 4 | 5 | 6 | 7 | 8 | 9 | 10 | 11 | 12 | 13 | | PSBs | | | | | | | | | | | | | | 2023 | 2,25,638 | 56.2 | 1,14,409 | 28.5 | 80,577 | 20.1 | 30,652 | 7.6 | 1,75,666 | 43.8 | 4,01,304 | 100.0 | | 2024 | 2,05,777 | 64.2 | 1,06,451 | 33.2 | 75,278 | 23.5 | 24,049 | 7.5 | 1,14,963 | 35.8 | 3,20,740 | 100.0 | | PVBs | | | | | | | | | | | | | | 2023 | 42,321 | 36.5 | 19,999 | 17.3 | 14,569 | 12.6 | 7,752 | 6.7 | 73,470 | 63.5 | 1,15,791 | 100.0 | | 2024 | 49,986 | 40.5 | 21,211 | 17.2 | 18,340 | 14.8 | 10,435 | 8.4 | 73,553 | 59.5 | 1,23,540 | 100.0 | | FBs | | | | | | | | | | | | | | 2023 | 2,149 | 22.6 | 221 | 2.3 | 1,542 | 16.2 | 386 | 4.1 | 7,377 | 77.4 | 9,526 | 100.0 | | 2024 | 1,795 | 27.5 | 162 | 2.5 | 1,315 | 20.2 | 318 | 4.9 | 4,728 | 72.5 | 6,523 | 100.0 | | SFBs | | | | | | | | | | | | | | 2023 | 3,621 | 42.1 | 1,397 | 16.2 | 1,054 | 12.2 | 1,170 | 13.6 | 4,987 | 57.9 | 8,608 | 100.0 | | 2024 | 4,031 | 72.1 | 1,878 | 33.6 | 1,137 | 20.3 | 1,015 | 18.2 | 1,560 | 27.9 | 5,590 | 100.0 | | All SCBs | | | | | | | | | | | | | | 2023 | 2,73,729 | 51.1 | 1,36,026 | 25.4 | 97,742 | 18.3 | 39,960 | 7.5 | 2,61,500 | 48.9 | 5,35,229 | 100.0 | | 2024 | 2,61,589 | 57.3 | 1,29,701 | 28.4 | 96,070 | 21.0 | 35,817 | 7.8 | 1,94,804 | 42.7 | 4,56,393 | 100.0 | Note: Per cent: Per cent of total NPAs.
Source: Off-site returns (domestic operations), RBI. |
 5.4 Unsecured lending IV.55 Unsecured loans, characterised by absence or inadequacy of collateral, present higher credit risk for banks in the event of a default. The share of unsecured loans in total credit of SCBs had been increasing since end-March 2015, touching 25.5 per cent by end-March 2023. This share declined marginally to 25.3 per cent at end-March 2024, mainly led by PVBs, reflecting, inter alia, the impact of the Reserve Bank’s November 2023 measures to contain build-up of risk in these sectors (Chart IV.26a). Among various bank groups, PSBs had the lowest share of unsecured advances, followed by PVBs. The mean, median as well as dispersion of bank-wise exposure to unsecured loans was the highest amongst FBs (Chart IV.26b). 6. Ownership Pattern in Commercial Banks IV.56 The ownership pattern of banks plays a crucial role in governance, stability, and overall performance of banks. During 2023-24, the central government brought down its stake in Bank of India, Indian Bank and Union Bank of India to below 75 per cent (Chart IV.27a). With this, seven PSBs met the minimum public shareholding norm at end-March 2024. The Government, vide its notification dated July 19, 2024, granted exemption upto August 1, 2026 to five PSBs that are yet to meet the criterion. PVBs have a more diversified ownership pattern (Chart IV.27b). IV.57 During 2023-24, non-resident ownership of banks remained within the limits of 74 per cent for PVBs, LABs and SFBs, and 20 per cent for PSBs (Appendix Table IV.10). 7. Corporate Governance IV.58 Corporate governance is critical for efficiency in allocation of resources, protection of depositors’ interest, and maintenance of financial stability. The Reserve Bank on April 26, 2021 laid down norms for the composition of certain committees of the board; chair and meetings of the board; age, tenure and remuneration of directors; and appointment of the whole-time directors for robust and transparent risk management and decision-making in banks15. 7.1 Composition of Boards IV.59 Independent directors contribute to the board’s deliberations by providing independent judgement especially on issues of strategy, performance, risk management, resources, key appointments and standard of conduct. At end-March 2024, for both PVBs and SFBs, the share of independent directors in the board and its committee was well above the stipulated threshold (Table IV.22)16.
| Table IV.22: Independent Directors on the Board and its Committees | | (At end-March) | | (Share in per cent) | | | Board | Risk Management Committee of Board (RMCB) | Nomination and Remuneration Committee (NRC) | Audit Committee of the Board (ACB) | | | 2023 | 2024 | 2023 | 2024 | 2023 | 2024 | 2023 | 2024 | | 1 | 2 | 3 | 4 | 5 | 6 | 7 | 8 | 9 | | PVBs | 65 | 65 | 67 | 70 | 78 | 85 | 83 | 87 | | SFBs | 68 | 67 | 76 | 73 | 83 | 79 | 83 | 82 | | Source: Annual report and websites of banks. | IV.60 Banks are required to constitute a Risk Management Committee of Board (RMCB), with a majority of non-executive directors. The chair of the board may be a member of the RMCB only if he/she has the requisite risk management expertise. The proportion of PVBs in which the chair is not a member of the RMCB was unchanged at 38 per cent at end-March 2024. For SFBs, the proportion decreased from 42 per cent at end-March 2023 to 33 per cent at end-March 2024. 7.2 Executive Compensation IV.61 To maintain balance between short-term risk-taking and long-term stability, the Reserve Bank’s revised guidelines of November 2019 require a substantial portion of compensation (at least 50 per cent) to be variable and to be paid on the basis of individual, business-unit and firm-wide indicators that adequately measure performance17. Further the guidelines stipulate that if target variable pay (TVP) is up to 200 per cent (above 200 per cent) of fixed pay then minimum 50 per cent (67 per cent) of TVP shall be paid via non-cash components. During 2022-23, the share of actual variable pay (VP) in total remuneration improved for both PVBs and SFBs, (Chart IV.28a). The share of the non-cash component in the actual VP moderated to 52 per cent for PVBs and increased to 38 per cent for SFBs (Chart IV.28b). 8. Foreign Banks’ Operations in India and Overseas Operations of Indian Banks IV.62 During 2023-24, the number of FBs operating in India increased as one of the foreign banks, which previously had only a representative office, opened a fully functioning bank branch. However, the number of FBs’ branches declined for the third consecutive year, reflecting re-alignment of global strategy and business value optimisation (Table IV.23). IV.63 Indian banks conduct their overseas operations primarily through branches (Chart IV.29). During 2023-24, PSBs rationalised their overseas presence by closing non-viable branches, whereas overseas presence of PVBs remained unchanged (Appendix Table IV.11). 9. Payment Systems and Scheduled Commercial Banks IV.64 India’s payment systems have evolved rapidly, embracing both innovation and inclusivity to cater to a diverse population while also maintaining high safety standards. The landscape combines traditional banking channels with cutting-edge digital solutions, enabling secure, quick, and convenient transactions. This transformation has been driven by technological advancements, a robust regulatory framework, and policy initiatives aimed at promoting cashless transactions and financial inclusion. | Table IV.23: Operations of Foreign Banks in India | | | Foreign banks operating through branches/WOS | Foreign banks having representative offices | | No. of Banks | Branches# | | | 1 | 2 | 3 | 4 | | Mar-21 | 45 | 874 | 36 | | Mar-22 | 45 | 861 | 34 | | Mar-23 | 44 | 782 | 33 | | Mar-24 | 45 | 780 | 31 | Note: #: Including branches of two foreign banks, viz., SBM Bank (India) Limited and DBS Bank India Limited, which are operating through Wholly Owned Subsidiary (WOS) mode.
Source: RBI. |
9.1 Digital Payments IV.65 During 2021-2024, digital payment methods registered a compound annual growth rate (CAGR) of 49.9 per cent in volume terms and 14.1 per cent in value terms. In contrast, paper-based instruments such as cheques and demand drafts contracted, with a CAGR of (-)10.1 per cent in volume terms and (-)1.6 per cent in value terms. The average value of retail digital payments has reduced from ₹8,769 in March 2021 to ₹4,560 in March 2024, with growing popularity of digital modes for small value payments (Chart IV.30). IV.66 At end-March 2024, in terms of value, 97.1 per cent of the total payments were through digital mode. The Unified Payments Interface (UPI) has the majority share in volume of transactions, while real time gross settlements (RTGS) accounted for the largest share in terms of value (Table IV.24). IV.67 The Reserve Bank launched a composite Digital Payments Index in January 2021 to measure the progress of digitalisation and assess the deepening and penetration of digital payments comprising five broad parameters: payment enablers; payment infrastructure – demand-side factors; payment infrastructure – supply-side factors; payment performance; and consumer centricity. The index is computed semi-annually with March 2018 as the base year. At end-March 2024, the index stood at 445.5 compared to 395.6 a year ago, driven by significant growth in payment performance and payment infrastructure across the country (Chart IV.31). | Table IV.24: Payment Systems Indicators | | | Volume (lakh) | Value (₹ crore) | | 2021-22 | 2022-23 | 2023-24 | 2021-22 | 2022-23 | 2023-24 | | 1 | 2 | 3 | 4 | 5 | 6 | 7 | | 1. Large Value Credit Transfers – RTGS | 2,078 | 2,426 | 2,700 | 12,86,57,516 | 14,99,46,286 | 17,08,86,670 | | 2. Credit Transfers | 5,77,935 | 9,83,621 | 14,86,107 | 4,27,28,006 | 5,50,09,620 | 6,75,42,859 | | 2.1 AePS (Fund Transfers) | 10 | 6 | 4 | 575 | 356 | 261 | | 2.2 APBS | 12,573 | 17,834 | 25,888 | 1,33,345 | 2,47,535 | 3,90,743 | | 2.3 ECS | - | - | - | - | - | - | | 2.4 IMPS | 46,625 | 56,533 | 60,053 | 41,71,037 | 55,85,441 | 64,95,652 | | 2.5 NACH | 18,758 | 19,257 | 16,227 | 12,81,685 | 15,41,815 | 15,25,104 | | 2.6 NEFT | 40,407 | 52,847 | 72,640 | 2,87,25,463 | 3,37,19,541 | 3,91,36,014 | | 2.7 UPI | 4,59,561 | 8,37,144 | 13,11,295 | 84,15,900 | 1,39,14,932 | 1,99,95,086 | | 3. Debit Transfers and Direct Debits | 12,189 | 15,343 | 18,250 | 10,34,444 | 12,89,611 | 16,87,658 | | 3.1 BHIM Aadhaar Pay | 228 | 214 | 194 | 6,113 | 6,791 | 6,112 | | 3.2 ECS Dr | - | - | - | - | - | - | | 3.3 NACH | 10,755 | 13,503 | 16,426 | 10,26,641 | 12,80,219 | 16,78,769 | | 3.4 NETC (linked to bank account) | 1,207 | 1,626 | 1,629 | 1,689 | 2,601 | 2,777 | | 4. Card Payments | 61,783 | 63,325 | 58,470 | 17,01,851 | 21,52,245 | 24,23,563 | | 4.1 Credit Cards | 22,399 | 29,145 | 35,610 | 9,71,638 | 14,32,255 | 18,31,134 | | 4.2 Debit Cards | 39,384 | 34,179 | 22,860 | 7,30,213 | 7,19,989 | 5,92,429 | | 5. Prepaid Payment Instruments | 65,783 | 74,667 | 78,775 | 2,79,416 | 2,87,111 | 2,83,048 | | 6. Paper-based Instruments | 6,999 | 7,109 | 6,632 | 66,50,333 | 71,72,904 | 72,12,333 | | Total Digital Payments (1+2+3+4+5) | 7,19,768 | 11,39,382 | 16,44,302 | 17,44,01,233 | 20,86,84,872 | 24,28,23,799 | | Total Retail Payments (2+3+4+5+6) | 7,24,689 | 11,44,065 | 16,48,234 | 5,23,94,049 | 6,59,11,490 | 7,91,49,461 | | Total Payments (1+2+3+4+5+6) | 7,26,767 | 11,46,491 | 16,50,934 | 18,10,51,565 | 21,58,57,776 | 25,00,36,131 | | Source: RBI. |
 9.2 ATMs IV.68 During 2023-24, the total number of automated teller machines (ATMs) (on-site and off-site) declined moderately, primarily driven by PSBs and white-label ATMs (WLAs). At end-March 2024, PSBs and PVBs accounted for 61.6 per cent and 36.5 per cent, respectively, of total ATMs deployed by all SCBs (Table IV.25 and Appendix Table IV.12). | Table IV.25: Number of ATMs | | (At end-March) | | Bank Group | On-site ATMs | Off-site ATMs | Total Number of ATMs | | 2023 | 2024 | 2023 | 2024 | 2023 (2+4) | 2024 (3+5) | | 1 | 2 | 3 | 4 | 5 | 6 | 7 | | PSBs | 78,777 | 77,033 | 59,646 | 57,661 | 1,38,423 | 1,34,694 | | PVBs | 41,426 | 45,438 | 35,549 | 34,446 | 76,975 | 79,884 | | FBs | 612 | 603 | 612 | 566 | 1,224 | 1,169 | | SFBs* | 2,797 | 3,042 | 24 | 26 | 2,821 | 3,068 | | PBs | 1 | 0 | 62 | 0 | 63 | 0# | | All SCBs | 1,23,613 | 1,26,116 | 95,893 | 92,699 | 2,19,506 | 2,18,815 | | WLAs | 0 | 0 | 35791 | 34602 | 35,791 | 34,602 | | Total | 1,23,613 | 1,26,116 | 1,31,684 | 1,27,301 | 2,55,297 | 2,53,417 | Notes: 1. *: Data pertain to 12 scheduled SFBs.
2. #: Significant decline due to closure of ATMs by a PB.
Source: RBI. | IV.69 At end-March 2024, the share of PSBs and PVBs in metropolitan ATMs was almost equal. In contrast, PSBs operated 78.7 per cent of ATMs in rural areas. The majority of WLAs (83.9 per cent) were concentrated in rural and semi-urban areas (Table IV.26). | Table IV.26: Geographical Distribution of ATMs: Bank Group-wise | | (At end-March 2024) | | Bank group | Rural | Semi-urban | Urban | Metropolitan | Total | | 1 | 2 | 3 | 4 | 5 | 6 | | Public Sector Banks | 28,784 | 39,773 | 34,100 | 32,037 | 1,34,694 | | | (78.7) | (63.9) | (62.1) | (49.2) | (61.6) | | Private Sector Banks | 7,400 | 21,207 | 19,607 | 31,670 | 79,884 | | | (20.2) | (34.1) | (35.7) | (48.7) | (36.5) | | Foreign Banks | 112 | 317 | 320 | 420 | 1,169 | | | (0.3) | (0.5) | (0.6) | (0.6) | (0.5) | | Small Finance Banks* | 282 | 938 | 896 | 952 | 3,068 | | | (0.8) | (1.5) | (1.6) | (1.5) | (1.4) | | Payments Banks | 0 | 0 | 0 | 0 | 0 | | | (0.0) | (0.0) | (0.0) | (0.0) | (0.0) | | All SCBs | 36,578 | 62,235 | 54,923 | 65,079 | 2,18,815 | | | (100) | (100) | (100) | (100) | (100) | | All SCBs (y-o-y growth) | 0.15 | 0.97 | -0.84 | -1.25 | -0.29 | | WLAs | 17,496 | 11,550 | 3,766 | 1,790 | 34,602 | | WLAs (y-o-y growth) | -4.63 | -0.28 | -1.23 | -12.64 | -3.32 | Notes: 1. Figures in parentheses indicate percentage share in total ATMs of SCBs in each geographical region.
2. *: Data pertain to 12 scheduled SFBs.
Source: RBI. | 10. Technology Adoption and Scheduled Commercial Banks IV.70 The banking sector has undergone profound transformation in recent years, driven by rapid advancements in technology. From digital payments to other technologies that have revolutionised the financial landscape, the growing interest in generative artificial intelligence (GenAI) and its integration into the financial sector has the potential to drive further advancements, fostering innovation, efficiency, and resilience for the benefit of the financial sector. A recent Reserve Bank survey indicates that banks in India are at a nascent stage in adoption of GenAI although majority of the respondents recognise its potential benefits (Box IV.4). 11. Consumer Protection IV.71 With the advent of technology-based banking products and growing usage of these products by vulnerable sections of the society, consumer education and protection have assumed unprecedented importance. To this effect, the Reserve Bank administers an Alternate Grievance Redress (AGR) mechanism18 and regulates the Internal Grievance Redressal mechanism (IGR) at the REs. 11.1 Grievance Redressal IV.72 During 2023-24, the Centralised Receipt and Processing Centre (CRPC) and Offices of Reserve Bank of India Ombudsman (ORBIOs) received 9.34 lakh complaints, an increase of 32.8 per cent over the previous year. Of these complaints, 31.5 per cent were received by the ORBIOs and the rest were received at the CRPC. Majority of the complaints received by the ORBIOs during the year pertained to PSBs, although their share in the total declined (Chart IV.32). IV.73 Structural changes in the Reserve Bank – Integrated Ombudsman Scheme (RB-IOS), effective November 2021, rationalised complaints categories, making ‘deficiency in service’ as the sole ground for lodging a complaint, with a specified list of exclusions. Hence, data on the nature of complaints may not be strictly comparable across the years. With this caveat, grievances relating to loans and advances, mobile/electronic banking and deposit accounts were the highest during 2023-24, contributing 64 per cent of the total complaints (Table IV.27). Box IV.4: Adoption of Generative AI by Regulated Entities GenAI can perform routine and repetitive tasks effectively, and enhance the efficiency of operations, improve productivity and add to customer satisfaction. At the same time, it could also introduce new risks such as infringement of privacy, intentional misuse, introduction of biases or amplification of the existing risks like cyber security and third-party dependency. According to a survey conducted by the Reserve Bank in October 2024, 45 per cent of the respondent REs indicated that they were using it for tasks such as providing assistance to employees and document summarisation (Chart IV.4.1a). 55 per cent of the respondents, who were not leveraging GenAI when the survey was conducted, were considering its adoption in the near future for similar tasks (Chart IV.4.1b). 20 per cent of the adopters reported their preference for building models from scratch for specific uses. Extending the existing models via fine tuning and/or data retrieval was the most accepted approach (Chart IV.4.2). These strategies allow REs to tailor GenAI models for specific use cases, enhance performance and seamlessly incorporate AI capabilities into existing workflows.
Amongst the concerns, most REs acknowledged data bias and representativeness as challenges, followed by data privacy and explainability & interpretability of models (Chart IV.4.3). To address such concerns, most REs adopt the human-in-the-middle (HITM) approach19. To mitigate data privacy concerns, REs reported using publicly available data or pseudonymised internal information instead of using confidential or sensitive data for training or fine-tuning GenAI-based tools. 90 per cent of the survey participants preferred not to use GenAI for critical applications like core banking and payment systems. |
 IV.74 The share of complaints emanating from urban and metropolitan areas accounted for 71.6 per cent of the total complaints received by RBIOs during 2023-24, which could reflect greater awareness in these regions regarding the Reserve Bank’s grievance redress mechanism (Chart IV.33a). PSBs and PVBs together accounted for 72.7 per cent of the total complaints received by RBIOs. Almost all pension-related complaints were filed against PSBs __ traditionally preferred by pensioners. On the other hand, a large share of complaints (60.1 per cent) relating to credit cards were filed against PVBs (Chart IV.33b). | Table IV.27: Nature of Complaints Received by ORBIOs | | | 2021-22 | 2022-23 | 2023-24 | | 1 | 2 | 3 | 4 | | Loans and Advances | 30,734 | 59,762 | 85,281 | | Mobile/ Electronic Banking | 42,271 | 43,167 | 57,242 | | Deposit Accounts | 16,989 | 34,481 | 46,358 | | Credit Cards | 34,828 | 34,151 | 42,329 | | ATM/ Debit Cards | 41,849 | 29,929 | 25,231 | | Others | 36,607 | 22,551 | 24,355 | | Para-banking | 1,608 | 2,782 | 4,380 | | Pension Payments | 6,206 | 4,380 | 4,108 | | Remittances | 3,443 | 2,940 | 4,101 | | Notes and Coins | 302 | 511 | 539 | | Non-observance of Fair Practice Code | 37,880 | 20 | - | | Levy of Charges without Prior Notice | 14,519 | 3 | - | | DSAs and Recovery Agents | 1,640 | 7 | - | | Failure to Meet Commitments | 22,420 | 5 | - | | Non-adherence to BCSBI Codes | 5,069 | 1 | - | | Out of Purview of BO Scheme | 8,131 | - | - | | Total | 3,04,496* | 2,34,690^ | 2,93,924@ | Notes: 1. *: Excludes 1,13,688 complaints handled by CRPC.
2. ^: Excludes 4,68,854 complaints handled by CRPC.
3. @: Excludes 6,40,431 complaints handled at CRPC.
Source: RBI. | 11.2 Deposit Insurance IV.75 Deposit insurance is a vital pillar of the financial safety-net system, playing a crucial role in bolstering public confidence in the banking sector, especially among small depositors, and fostering overall financial stability. In India, the Deposit Insurance and Credit Guarantee Corporation (DICGC), a wholly-owned subsidiary of the Reserve Bank, administers deposit insurance covering all commercial banks, including RRBs, LABs, and co-operative banks. At end-March 2024, 1,997 banks were insured by DICGC. At present, the deposit insurance coverage limit in India stands at ₹5 lakh per depositor per account. This limit covers 97.7 per cent of deposit accounts and in terms of value, 43.1 per cent of assessable deposits are insured (Table IV.28). IV.76 The proportion of insured deposits to assessable deposits declined in 2023-24, reflective of the growing deposit base (Chart IV.34). IV.77 The deposit insurance fund (DIF) is constituted with DICGC to settle the claims of insured deposits in the event of liquidation or imposition of all-inclusive directions (AID). During 2023-24, claims amounting to ₹1,432 crore were settled through DIF. At end-March 2024, the balance in DIF stood at ₹1,98,753 crore. With the growth of DIF (17.2 per cent) above that of insured deposits (9.1 per cent), the reserve ratio (RR)20 improved to 2.11 per cent at end-March 2024 from 1.96 per cent a year ago. Under Section 21 of the DICGC Act, 1961, the corporation has the mandate to recover insurance claim payouts. During 2023-24, the DICGC made a total recovery of claims amounting to ₹901 crore as compared to ₹883 crore during 2022-23. 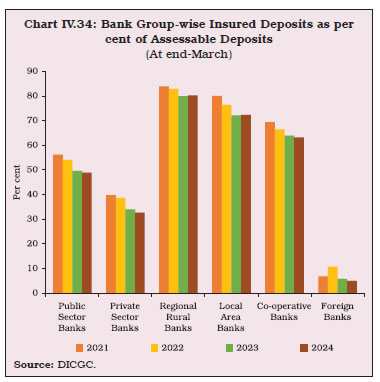
| Table IV.28: Bank Group-wise Insured Deposits | | (Amount in ₹ crore) | | Bank Groups | As on March 31, 2023 | As on March 31, 2024 | | No. of Insured Banks | Insured Deposits | Assessable Deposits | IDR {(3) / (4)} | No. of Insured Banks | Insured Deposits | Assessable Deposits | IDR {(7) / (8)} | | 1 | 2 | 3 | 4 | 5 | 6 | 7 | 8 | 9 | | I. Commercial Banks (i to vii) | 139 | 79,22,120 | 1,83,48,838 | 43.2 | 140 | 86,66,416 | 2,06,73,077 | 41.9 | | i) Public Sector Banks | 12 | 52,20,324 | 1,05,07,639 | 49.7 | 12 | 56,47,846 | 1,15,76,001 | 48.8 | | ii) Private Sector Banks | 21 | 21,20,937 | 62,37,833 | 34.0 | 21 | 23,63,912 | 72,35,902 | 32.7 | | iii) Foreign Banks | 43 | 50,037 | 8,62,909 | 5.8 | 44 | 50,568 | 10,08,506 | 5.0 | | iv) Small Finance Banks | 12 | 66,745 | 1,63,183 | 40.9 | 12 | 89,532 | 2,15,426 | 41.6 | | v) Payments Banks | 6 | 12,533 | 12,694 | 98.7 | 6 | 16,794 | 16,937 | 99.2 | | vi) Regional Rural Banks | 43 | 4,50,675 | 5,63,377 | 80.0 | 43 | 4,96,827 | 6,19,010 | 80.3 | | vii) Local Area Banks | 2 | 869 | 1,204 | 72.2 | 2 | 937 | 1,295 | 72.4 | | II. Co-operative Banks (i to iii) | 1,887 | 7,09,139 | 11,10,076 | 63.9 | 1,857 | 7,46,290 | 11,79,084 | 63.3 | | i) Urban Co-operative Banks | 1,502 | 3,62,991 | 5,34,413 | 67.9 | 1,472 | 3,71,846 | 5,56,962 | 66.8 | | ii) State Co-operative Banks | 33 | 64,041 | 1,46,931 | 43.6 | 33 | 64,202 | 1,48,080 | 43.4 | | iii) District Central Co-operative Banks | 352 | 2,82,107 | 4,28,733 | 65.8 | 352 | 3,10,242 | 4,74,041 | 65.4 | | Total (I+II) | 2,026 | 86,31,259 | 1,94,58,915 | 44.4 | 1,997 | 94,12,705 | 2,18,52,160 | 43.1 | Note: IDR: Insured Deposits Ratio.
Source: DICGC. | 12. Financial Inclusion IV.78 The Reserve Bank persevered with its initiatives to improve financial access, including by leveraging technology-driven innovations to bring the benefits of financial services to all sections of society. Despite fast paced digitalisation in India, the number of commercial bank branches per one lakh population increased 1.5 times during the period 2010 to 2023 (Chart IV.35a). Per capita availability of ATMs in India has also increased threefold since 2010 (Chart IV.35b). 12.1 Financial Inclusion Plans IV.79 Financial Inclusion Plans (FIPs) capture banks’ achievements on parameters, such as, the number of banking and BC outlets, basic savings bank deposit accounts (BSBDAs), overdraft (OD) facilities availed in these accounts, transactions in KCC and General Credit Cards (GCCs) and transactions through the Business Correspondents - Information and Communication Technology (BC-ICT) channel. At end-March 2024, deposits in BSBDAs through the BC mode surpassed those through the branches mode, indicating the effectiveness of the BC model at the grassroots level (Table IV.29). 12.2 Financial Inclusion Index IV.80 The Reserve Bank’s Financial Inclusion Index (FII) monitors the progress of financial inclusion in the country. It captures information on 97 indicators, based on three dimensions, viz., access, usage and quality. The index rose to 64.2 in March 2024 from 60.1 in March 2023, with growth across all sub-indices (Chart IV.36). The improvement in the FII in 2023-24 was largely contributed by the usage dimension, reflecting deepening of financial inclusion. 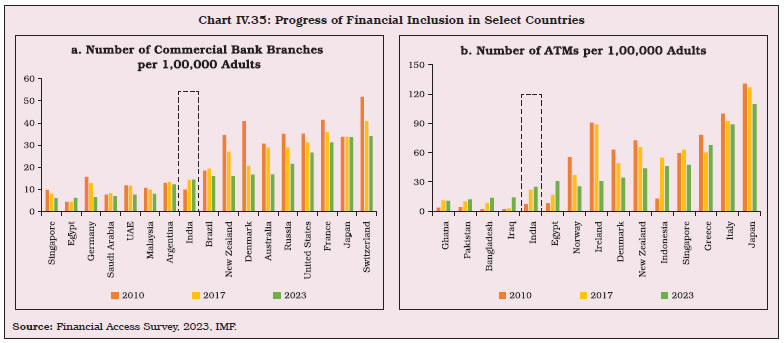
| Table IV.29: Progress in Financial Inclusion Plan | | (At end-March) | | S. No. | | 2015 | 2020 | 2021 | 2022 | 2023 | 2024* | | 1 | 2 | 3 | 4 | 5 | 6 | 7 | 8 | | Banking Outreach | | 1 | Banking Outlets in Villages- Branches | 49,571 | 54,561 | 55,112 | 53,287 | 53,802 | 54,198 | | 2 | BC Outlets in Villages with population >2000 | 90,877 | 1,49,106 | 8,50,406 | 18,92,462 | 13,48,038 | 12,66,756 | | 3 | BC Outlets in Villages with population <2000 | 4,08,713 | 3,92,069 | 3,40,019 | 3,26,008 | 2,77,844 | 2,80,922 | | 4 | Total BC Outlets in Villages | 4,99,590 | 5,41,175 | 11,90,425 | 22,18,470 | 16,25,882 | 15,47,678 | | 5 | Urban Locations Covered Through BCs | 96,847 | 6,35,046 | 4,26,745 | 12,95,307 | 4,15,218 | 3,06,658 | | Basic Saving Bank Deposits Account (BSBDA) | | 6 | BSBDA - Through Branches (No. in lakh) | 2,103 | 2,616 | 2,659 | 2,661 | 2,750 | 2,768 | | 7 | BSBDA - Through Branches (Amt. in ₹ crore) | 36,498 | 95,831 | 1,18,392 | 1,20,464 | 1,33,661 | 1,46,306 | | 8 | BSBDA - Through BCs (No. in lakh) | 1,878 | 3,388 | 3,796 | 4,015 | 4,105 | 4,290 | | 9 | BSBDA - Through BCs (Amt. in ₹ crore) | 7,457 | 72,581 | 87,623 | 1,07,415 | 1,29,531 | 1,53,489 | | 10 | BSBDA - Total (No. in lakh) | 3,981 | 6,004 | 6,455 | 6,677 | 6,856 | 7,059 | | 11 | BSBDA - Total (Amt. in ₹ crore) | 43,955 | 1,68,412 | 2,06,015 | 2,27,879 | 2,63,192 | 2,99,795 | | 12 | OD Facility Availed in BSBDAs (No. in lakh) | 76 | 64 | 60 | 68 | 51 | 48 | | 13 | OD Facility Availed in BSBDAs (Amt. in ₹ crore) | 1,991 | 529 | 534 | 516 | 572 | 564 | | KCC and General Credit Card (GCC) | | 14 | KCC - Total (No. in lakh) | 426 | 475 | 466 | 473 | 493 | 515 | | 15 | KCC - Total (Amt. in ₹ crore) | 4,38,229 | 6,39,069 | 6,72,624 | 7,10,715 | 7,68,339 | 8,47,237 | | 16 | GCC - Total (No. in lakh) | 92 | 202 | 202 | 96 | 66 | 23 | | 17 | GCC - Total (Amt. in ₹ crore) | 1,31,160 | 1,94,048 | 1,55,826 | 1,70,203 | 1,90,568 | 34,340 | | Business Correspondents | | 18 | ICT-A/Cs-BC-Total Transactions (No. in lakh) # | 4,770 | 32,318 | 30,551 | 28,533 | 34,055 | 36,388 | | 19 | ICT-A/Cs-BC-Total Transactions (Amt. in ₹ crore) # | 85,980 | 8,70,643 | 8,49,771 | 9,05,252 | 11,39,521 | 13,10,973 | Notes: 1. *: Provisional
2. #: Transactions during the financial year.
Source: FIP returns submitted by PSBs, PVBs and RRBs. |
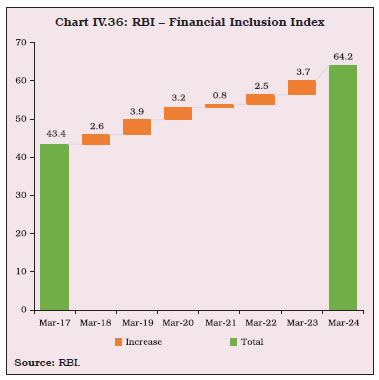 12.3 Pradhan Mantri Jan Dhan Yojana (PMJDY) IV.81 The PMJDY, which has played a pivotal role in fostering financial inclusion in marginalised areas and sections of society, completed 10 years of its inception in August 2024. The number of beneficiaries under PMJDY reached 54.2 crore, with deposits of ₹2.4 lakh crore as on December 11, 2024 and 66.6 per cent of the beneficiaries are in rural/semi-urban areas (Chart IV.37a). Notwithstanding some recent moderation, the average balance in PMJDY accounts has expanded four times since its launch, reflecting growing usage and successful integration of previously unbanked individuals into the formal financial system (Chart IV.37b). 12.4 New Bank Branches by SCBs IV.82 While banks are increasingly emphasising digital channels, physical branches remain the core of customer engagement. During 2023-24, 41.9 per cent of the bank branches were opened in centers with population less than 50,000, improving banking penetration in smaller towns and villages (Table IV.30). | Table IV.30: Tier-wise Break-up of Newly Opened Bank Branches by SCBs | | | 2020-21 | 2021-22 | 2022-23 | 2023-24 | | 1 | 2 | 3 | 4 | 5 | | Tier 1 | 1,545 | 1,558 | 2,285 | 2,675 | | | (50.0) | (47.9) | (43.1) | (49.7) | | Tier 2 | 278 | 233 | 468 | 452 | | | (9.0) | (7.2) | (8.8) | (8.4) | | Tier 3 | 475 | 427 | 812 | 683 | | | (15.4) | (13.1) | (15.3) | (12.7) | | Tier 4 | 265 | 292 | 545 | 433 | | | (8.6) | (9.0) | (10.3) | (8.0) | | Tier 5 | 179 | 229 | 424 | 368 | | | (5.8) | (7.0) | (8.0) | (6.8) | | Tier 6 | 347 | 512 | 768 | 768 | | | (11.2) | (15.7) | (14.5) | (14.3) | | Total | 3,089 | 3,251 | 5,302 | 5,379 | | | (100.0) | (100.0) | (100.0) | (100.0) | Notes: 1. Tier-wise classification of centres is as follows: ‘Tier 1’ includes centres with population of 1,00,000 and above, ‘Tier 2’ includes centres with population of 50,000 to 99,999, ‘Tier 3’ includes centres with population of 20,000 to 49,999, ‘Tier 4’ includes centres with population of 10,000 to 19,999, ‘Tier 5’ includes centres with population of 5,000 to 9,999, and ‘Tier 6’ includes centres with population of less than 5000.
2. Data exclude ‘Administrative Offices’.
3. All population figures are as per census 2011.
4. Figures in the parentheses represent proportion of the branches opened in a particular area vis-à-vis the total.
Source: CISBI, RBI. CISBI data are dynamic in nature and are updated based on information received from banks. | IV.83 During 2023-24, 65.5 per cent of the new branches opened were by PVBs, with 44.1 per cent of these branches in rural and semi-urban areas (Chart IV.38). 12.5 Microfinance Programme IV.84 Microfinance serves as an effective instrument for advancing financial inclusion, entailing the delivery of financial services, including small-value credit, to the underserved and unbanked segments of the population, thereby fostering social equity and empowerment. During 2023-24, steady progress was observed in the delivery of micro-credit through self-help groups (SHGs) and joint liability groups (JLGs). The number of SHGs accessing credit from banks rose from 43.0 lakh in 2022-23 to 54.8 lakh in 2023-24. The outstanding loans of SHGs increased by 38.1 per cent during 2023-24 as compared with 24.5 per cent in the previous year. A significant portion of the credit disbursement to SHGs remained concentrated in the southern and eastern regions of the country (Chart IV.39). Credit disbursed to JLGs grew by 41.2 per cent during 2023-24 as compared with 18.3 per cent in the previous year (Appendix Table IV.13). 12.6 Trade Receivables Discounting System (TReDS) IV.85 TReDS is an electronic platform for facilitating the financing/discounting of trade receivables of MSMEs through multiple financiers. These receivables can be due from corporates and other buyers, including Government departments and public sector undertakings (PSUs). The revisions in TReDS guidelines on June 7, 2023 enabled insurance for financiers to hedge against default risk, expanded the pool of financiers, and enabled secondary market for factoring units. Reflecting these changes, the number and amount of invoices uploaded and financed increased sharply in 2023-24. The success rate of number of invoices financed improved from 93.9 per cent in 2022-23 to 94.4 per cent in 2023-24 (Table IV.31). 12.7 Regional Banking Penetration IV.86 During the last five years, banking penetration, gauged by population per bank branch, improved across all regions. The improvement in usage, measured by the number of deposit accounts per thousand population, was most evident in the northern region (Chart IV.40). | Table IV.31: Progress in MSME Financing through TReDS | | Financial Year | Invoices Uploaded | Invoices Financed | | Number | Amount | Number | Amount | | 1 | 2 | 3 | 4 | 5 | | 2020-21 | 8,61,560 | 19,670 | 7,86,555 | 17,080 | | 2021-22 | 17,33,553 | 44,112 | 16,40,824 | 40,309 | | 2022-23 | 27,24,872 | 83,955 | 25,58,531 | 76,646 | | 2023-24 | 44,04,148 | 1,51,343 | 41,58,554 | 1,38,241 | | Source: RBI. |
13. Regional Rural Banks21 IV.87 At end-March 2024, there were 43 RRBs sponsored by 12 SCBs operating through 22,078 branches in 26 States and 3 Union Territories (Puducherry, Jammu & Kashmir, Ladakh). In line with their mandate, 91.8 per cent of RRB branches were in rural/semi-urban areas. The southern region has the highest number of RRBs, and the region contributed nearly half to the RRBs’ total profit (Appendix Table IV.14). 13.1 Balance Sheet Analysis IV.88 The growth in the combined balance sheet of RRBs decelerated to 8.9 per cent during 2023-24 from 9.4 per cent in the previous year on account of a slowdown in borrowings on the liabilities side, even as there was an acceleration in deposits and credit growth (Table IV.32). | Table IV.32: Consolidated Balance Sheet of Regional Rural Banks | | (Amount in ₹ crore) | | Sr. No. | Item | At end-March | Y-o-y growth (in per cent) | | 2023 | 2024 (P) | 2022-23 | 2023-24 | | 1 | 2 | 3 | 4 | 5 | 6 | | 1 | Share Capital | 17,232 | 19,042 | 15.8 | 10.5 | | 2 | Reserves | 40,123 | 46,659 | 16.8 | 16.3 | | 3 | Deposits | 6,08,509 | 6,59,815 | 8.2 | 8.4 | | | 3.1 Current | 11,945 | 11,952 | -0.8 | 0.1 | | | 3.2 Savings | 3,19,572 | 3,47,193 | 8.5 | 8.6 | | | 3.3 Term | 2,76,992 | 3,00,670 | 8.2 | 8.5 | | 4 | Borrowings | 84,712 | 92,444 | 14.7 | 9.1 | | | 4.1 from NABARD | 73,119 | 77,166 | 9.0 | 5.5 | | | 4.2 Sponsor Bank | 3,408 | 4,293 | -12.1 | 26.0 | | | 4.3 Others | 8,185 | 10,986 | 177.7 | 34.2 | | 5 | Other Liabilities | 20,885 | 22,120 | 5.8 | 5.9 | | | Total Liabilities/Assets | 7,71,462 | 8,40,080 | 9.4 | 8.9 | | 6 | Cash in Hand | 2,888 | 2,933 | -7.4 | 1.6 | | 7 | Balances with RBI | 29,332 | 30,990 | 32.3 | 5.7 | | 8 | Balances in Current Account | 7,150 | 8,173 | -12.0 | 14.3 | | 9 | Investments | 3,13,401 | 3,19,099 | 6.0 | 1.8 | | 10 | Loans and Advances (net) | 3,86,951 | 4,45,286 | 13.0 | 15.1 | | 11 | Fixed Assets | 1,406 | 1,581 | 12.0 | 12.4 | | 12 | Other Assets, of which, | 30,333 | 32,019 | -6.9 | 5.6 | | | 12.1 Accumulated Losses | 9,841 | 8,921 | 8.6 | -9.4 | Note: P: Provisional.
Source: NABARD. | IV.89 Deposits accounted for 78.5 per cent of RRBs’ total sources of funds, although their deposit growth remained below that of SCBs during 2023-24. Low-cost CASA deposits had a share of 54.4 per cent in RRBs’ total deposits during 2023-24, the highest amongst all categories of SCBs, except PBs22. The average PMJDY deposit amount per account was ₹4,667 in RRBs, higher than ₹4,432 for other categories of banks. The C-D ratio of RRBs increased to 71.4 per cent at end-March 2024, its highest level in 33 years, as growth of loans and advances outpaced deposit growth. 13.2 Financial Performance IV.90 After reporting net losses during 2018-20, RRBs reported their highest ever consolidated net profit of ₹7,571 crore during 2023-24. Higher income growth and contraction in operating expenses, especially staff cost, boosted profitability (Table IV.33). | Table IV.33: Financial Performance of Regional Rural Banks | | (Amount in ₹ crore) | | Sr. No. | Item | Amount | Y-o-y change (in per cent) | | 2022-23 | 2023-24(P) | 2022-23 | 2023-24 | | 1 | 2 | 3 | 4 | 5 | 6 | | A | Income (i + ii) | 59,427 | 70,443 | 5.0 | 18.5 | | | i. Interest Income | 53,640 | 61,341 | 11.6 | 14.4 | | | ii. Other Income* | 5,787 | 9,101 | -32.2 | 57.3 | | B | Expenditure (i+ii+iii) | 54,454 | 62,872 | 2.0 | 15.5 | | | i. Interest Expended | 26,704 | 33,237 | 7.6 | 24.5 | | | ii. Operating Expenses | 21,878 | 21,267 | 2.7 | -2.8 | | | of which, Wage Bill | 16,683 | 15,305 | 2.1 | -8.3 | | | iii. Provisions and Contingencies* | 5,872 | 8,368 | -19.1 | 42.5 | | | of which, Income Tax | 1,424 | 2,430 | 11.4 | 70.7 | | C | Profit | | | | | | | i. Operating Profit | 10,845 | 15,938 | 4.9 | 47.0 | | | ii. Net Profit | 4,974 | 7,571 | 54.5 | 52.2 | | D | Total Average Assets | 7,16,796 | 7,90,902 | 7.5 | 10.3 | | E | Financial ratios # | | | | | | | i. Operating Profit | 1.5 | 2.0 | | | | | ii. Net Profit | 0.7 | 1.0 | | | | | iii. Income (a + b) | 8.3 | 8.9 | | | | | a) Interest Income | 7.5 | 7.8 | | | | | b) Other Income | 0.8 | 1.2 | | | | | vi. Expenditure (a+b+c) | 7.6 | 7.9 | | | | | a) Interest Expended | 3.7 | 4.2 | | | | | b) Operating Expenses | 3.1 | 2.7 | | | | | of which, Wage Bill | 2.3 | 1.9 | | | | | c) Provisions and Contingencies | 0.8 | 1.1 | | | | F | Analytical Ratios (%) | | | | | | | Gross NPA Ratio | 7.3 | 6.2 | | | | | CRAR | 13.4 | 14.2 | | | Notes: 1. P: Provisional
2. #: as per cent of average total assets.
3. *: As per the Reserve Bank’s extant master directions on presentation of financial statements, provision for depreciation in investments, which was earlier reported under provisions and contingencies head of expenditure, is now required to be deducted from other income. Accordingly, an amount of ₹2,204.4 crore provisioned by RRBs for MTM losses has been deducted from other income during 2022-23.
Source: NABARD. | IV.91 The GNPA ratio of RRBs reached a decadal low of 6.2 per cent at end-March 2024 (Chart IV.41). The improvement in asset quality was accompanied by higher provision buffers. IV.92 Consequent upon the capital infusion of ₹10,890 crore during 2021-23, the number of RRBs with CRAR below the regulatory minimum of 9 per cent declined (Chart IV.42a). The consolidated CRAR stood at an all-time high of 14.2 per cent at end-March 2024 (Chart IV.42b). The number of loss-making RRBs has steadily declined from 18 in 2019-20 to 3 in 2023-24 (Appendix Table IV.14). IV.93 During 2023-24, priority sector lending accounted for 87.0 per cent of RRBs’ total lending and all banks met their target of lending 75 per cent of their ANBC/CEOBE to the priority sector (Table IV.34 and Appendix Table IV.15).
14. Local Area Banks23 IV.94 At end-March 2024, there were two LABs (down from four at end-March 2004), with 79 branches in operation. During 2023-24, the consolidated balance sheet growth of LABs decelerated, with slowdown in credit as well as deposit growth. With credit growth above deposit growth, the C-D ratio increased to 81.4 per cent at end-March 2024 from 81.1 per cent a year ago (Table IV.35). | Table IV.34: Purpose-wise Outstanding Advances by RRBs | | (At end-March) | | (Amount in ₹ crore) | | Sr. No. | Purpose | 2023 | 2024(P) | | 1 | 2 | 3 | 4 | | I | Priority (i to v) | 3,62,503 | 4,08,810 | | | Per cent of total loans outstanding | 88.3 | 87.0 | | | i. Agriculture | 2,81,971 | 3,16,671 | | | ii. Micro, Small and Medium Enterprises | 49,323 | 57,639 | | | iii. Education | 1,744 | 1,609 | | | vi. Housing | 24,503 | 26,047 | | | v. Others | 4,963 | 6,843 | | II | Non-priority (i to vi) | 48,236 | 61,300 | | | Per cent of total loans outstanding | 11.7 | 13.0 | | | i. Agriculture | 16 | 17 | | | ii. Micro Small and Medium Enterprises | 84 | 187 | | | iii. Education | 218 | 343 | | | iv. Housing | 9,100 | 13,620 | | | v. Personal Loans | 12,985 | 17,788 | | | vi. Others | 25,833 | 29,345 | | | Total (I+II) | 4,10,738 | 4,70,109 | Note: P: Provisional.
Source: NABARD. | 14.1 Financial Performance of LABs IV.95 Profits of LABs fell during 2023-24, as interest income growth decelerated, while interest expenditure growth accelerated (Table IV.36). | Table IV.35: Profile of Local Area Banks | | (At end-March) | | (Amount in ₹ crore) | | | 2023 | 2024 | | 1 | 2 | 3 | | 1. Assets | 1,474 | 1,584 | | | (15.7) | (7.5) | | 2. Deposits | 1,190 | 1,271 | | | (16.6) | (6.8) | | 3. Gross Advances | 965 | 1,034 | | | (15.1) | (7.2) | Note: Figures in parentheses represent y-o-y growth in per cent.
Source: Off-site returns (global operations), RBI. |
| Table IV.36: Financial Performance of Local Area Banks | | Sr. No. | | Amount (in ₹ crore) | Y-o-y growth (in per cent) | | 2022-23 | 2023-24 | 2022-23 | 2023-24 | | 1 | 2 | 3 | 4 | 5 | 6 | | A. | Income (i+ii) | 179 | 197 | 12.6 | 10.1 | | | i. Interest Income | 153 | 172 | 17.1 | 12.8 | | | ii. Other Income | 26 | 25 | -7.6 | -5.7 | | B. | Expenditure(i+ii+iii) | 143 | 162 | 7.7 | 13.7 | | | i. Interest Expended | 63 | 79 | 8.8 | 25.9 | | | ii. Provisions and Contingencies | 21 | 15 | -6.8 | -26.0 | | | iii. Operating Expenses | 59 | 68 | 12.5 | 14.6 | | | of which, Wage Bill | 29 | 33 | 14.6 | 13.5 | | C. | Profit | | | | | | | i. Operating Profit/Loss | 57 | 50 | 17.3 | -11.9 | | | ii. Net Profit/Loss | 36 | 35 | 37.7 | -3.9 | | D. | Net Interest Income | 90 | 93 | 23.6 | 3.7 | | E. | Total Assets | 1,474 | 1,584 | 15.7 | 7.5 | | F. | Financial Ratios | | | | | | | (as per cent of total assets) | | | | | | | i. Operating Profit | 3.9 | 3.2 | | | | | ii. Net Profit | 2.5 | 2.2 | | | | | iii. Income | 12.1 | 12.4 | | | | | iv. Interest Income | 10.4 | 10.9 | | | | | v. Other Income | 1.8 | 1.6 | | | | | vi. Expenditure | 9.7 | 10.2 | | | | | vii. Interest Expended | 4.3 | 5.0 | | | | | viii.Operating Expenses | 4.0 | 4.3 | | | | | ix. Wage Bill | 1.9 | 2.1 | | | | | x. Provisions and Contingencies | 1.4 | 1.0 | | | | | xi. Net Interest Income | 6.1 | 5.9 | | | Note: Wage Bill is taken as payments to and provisions for employees.
Source: Off-site returns (global operations), RBI. | 15. Small Finance Banks24 IV.96 Following the merger of Fincare Small Finance Bank with AU Small Finance Bank, 11 SFBs with 7,230 domestic branches were operational in India at end-June 2024. 15.1 Balance Sheet IV.97 During 2023-24, SFBs’ combined balance sheet growth was in double digits, in line with the trend observed since their inception. SFBs’ credit growth decelerated and deposit growth accelerated during 2023-24, thereby reducing their reliance on borrowings. The C-D ratio of SFBs moderated to 90.1 per cent at end-March 2024 from 93.0 per cent a year ago, though it remained higher than that of SCBs (Table IV.37). 15.2 Financial Performance IV.98 The asset quality of SFBs improved for the third consecutive year during 2023-24. The net profit ratio also increased during the year, as gains in the income ratio exceeded the increase in expenditure ratio. Provisions and contingencies (as per cent of total assets) declined due to the improvement in asset quality (Table IV.38). | Table IV.37: Consolidated Balance Sheet of Small Finance Banks | | (At end-March) | | (Amount in ₹ crore) | | Sr. No. | Item | Amount | Y-o-y growth (in per cent) | | 2023 | 2024 | 2023 | 2024 | | 1 | 2 | 3 | 4 | 5 | 6 | | 1 | Share Capital | 7,811 | 7,844 | 8.6 | 0.4 | | 2 | Reserves & Surplus | 23,557 | 32,957 | 38 | 39.9 | | 3 | Tier 2 Bonds and Tier 2 Debt | 1,926 | 2,458 | -15.7 | 27.6 | | 4 | Deposits | 1,91,372 | 2,50,896 | 28 | 31.1 | | | 4.1 Current Demand Deposits | 7,456 | 10,895 | 22.7 | 46.1 | | | 4.2 Savings | 54,667 | 59,691 | 16.2 | 9.2 | | | 4.3 Term | 1,29,248 | 1,80,310 | 34.1 | 39.5 | | 5 | Borrowings (Including Tier II Bonds) | 31,170 | 28,261 | 10.8 | -9.3 | | | 5.1 Bank | 4,241 | 4,500 | -6.3 | 6.1 | | | 5.2 Others | 26,929 | 23,761 | 14.1 | -11.8 | | 6 | Other Liabilities & provisions | 13,606 | 15,326 | 14.1 | 12.6 | | | Total liabilities/Assets | 2,67,517 | 3,35,284 | 25.1 | 25.3 | | 7 | Cash in Hand | 1,371 | 1,333 | 9.7 | -2.8 | | 8 | Balances with RBI | 16,468 | 16,170 | 115.8 | -1.8 | | 9 | Other Bank Balances/ Balances with Financial Institutions | 4,484 | 6,261 | -69 | 39.6 | | 10 | Investments | 58,115 | 74,283 | 30.8 | 27.8 | | 11 | Loans and Advances | 1,77,887 | 2,26,148 | 28.7 | 27.1 | | 12 | Fixed Assets | 2,734 | 3,353 | 18.7 | 22.6 | | 13 | Other Assets | 6,455 | 7,736 | 15.5 | 19.8 | Note: Data pertains to 12 SFBs.
Source: Off-site returns (global operations), RBI. | 16. Payments Banks25 IV.99 At end-March 2024, six PBs were operational with 82 branches. Of these, five PBs reported operational profit during 2023-24. | Table IV.38: Financial Performance of Small Finance Banks | | (Amount in ₹ crore) | | Sr. No. | Item | Amount | Y-o-y growth (in per cent) | | 2022-23 | 2023-24 | 2022-23 | 2023-24 | | 1 | 2 | 3 | 4 | 5 | 6 | | A | Income (i + ii) | 33,827 | 45,437 | 35.1 | 34.3 | | | i. Interest Income | 29,806 | 39,588 | 34.7 | 32.8 | | | ii. Other Income | 4,022 | 5,848 | 38.1 | 45.4 | | B | Expenditure (i+ii+iii) | 29,663 | 39,214 | 23.3 | 32.2 | | | i. Interest Expended | 12,139 | 17,473 | 27.6 | 43.9 | | | ii. Operating Expenses | 13,153 | 17,186 | 34.0 | 30.7 | | | of which, Staff Expenses | 6,707 | 8,494 | 26.4 | 26.6 | | | iii. Provisions and contingencies | 4,371 | 4,555 | -7.6 | 4.2 | | C | Profit (Before Tax) | 5,417 | 7,835 | 321.9 | 44.6 | | | i. Operating Profit (EBPT) | 8,534 | 10,774 | 49.7 | 26.2 | | | ii. Net Profit (PAT) | 4,162 | 6,219 | 327.3 | 49.4 | | D | Total Assets | 2,67,517 | 3,35,284 | 31.8 | 25.3 | | E | Financial Ratios # | | | | | | | i. Operating Profit | 3.2 | 3.2 | | | | | ii. Net Profit | 1.6 | 1.9 | | | | | iii. Income (a + b) | 12.6 | 13.6 | | | | | a. Interest Income | 11.1 | 11.8 | | | | | b. Other Income | 1.5 | 1.7 | | | | | iv. Expenditure (a+b+c) | 11.1 | 11.7 | | | | | a. Interest Expended | 4.5 | 5.2 | | | | | b. Operating Expenses | 4.9 | 5.1 | | | | | of which, Staff Expenses | 2.5 | 2.5 | | | | | c. Provisions and Contingencies | 1.6 | 1.4 | | | | F | Analytical Ratios (%) | | | | | | | Gross NPA Ratio | 4.7 | 2.4 | | | | | CRAR | 22.5 | 21.6 | | | | | Core CRAR | 19.9 | 19.4 | | | Note: #: As per cent of total assets.
Source: Off-site returns (domestic operations), RBI. | 16.1 Balance sheet IV.100 During 2023-24, the combined balance sheet growth of PBs decelerated, primarily driven by slowdown in deposit growth on the liabilities side as well as slowdown in growth of cash and balances with the RBI and investments on the asset side. Deposits constituted 62.4 per cent of the liabilities of PBs (Table IV.39). 16.2 Financial Performance IV.101 PBs turned profitable for the first time since their inception during 2022-23 and this momentum continued during 2023-24, albeit at a slower pace (Table IV.40). The share of non-interest income in total income of PBs declined from 91.3 per cent during 2021-22 to 81.7 per cent during 2023-24. | Table IV.39: Consolidated Balance Sheet of Payments Banks | | (At end-March) | | Sr No. | Item | Amount (in ₹ crore) | Y-o-y growth (in per cent) | | 2022 | 2023 | 2024 | 2022 | 2023 | 2024 | | 1 | 2 | 3 | 4 | 5 | 6 | 7 | 8 | | 1 | Total Capital and Reserves | 2,485 | 2,938 | 3,440 | 41 | 18.2 | 17.1 | | 2 | Deposits | 7,859 | 12,222 | 16,330 | 69.9 | 55.5 | 33.6 | | 3 | Other Liabilities and Provisions | 7,771 | 8,380 | 6,385 | 28 | 7.8 | -23.8 | | | Total Liabilities/Assets | 18,115 | 23,540 | 26,155 | 45 | 29.9 | 11.1 | | 1 | Cash and Balances with RBI | 1,560 | 2,453 | 3,094 | 24.3 | 57.3 | 26.1 | | 2 | Balances with Banks and Money Market | 3,322 | 5,008 | 4,350 | 39 | 50.7 | -13.1 | | 3 | Investments | 10,178 | 12,397 | 14,627 | 43 | 21.8 | 18.0 | | 4 | Fixed Assets | 372 | 562 | 1,266 | 4.7 | 51.1 | 125.3 | | 5 | Other Assets | 2,683 | 3,120 | 2,819 | 98.8 | 16.3 | -9.6 | Note: Data pertain to 6 PBs.
Source: Off-site returns (domestic operations), RBI. |
| Table IV.40: Financial Performance of Payments Banks | | Sr. No. | | Amount (in ₹ crore) | Y-o-y growth (in per cent) | | 2021-22 | 2022-23 | 2023-24 | 2021-22 | 2022-23 | 2023-24 | | 1 | 2 | 3 | 4 | 5 | 6 | 7 | 8 | | A | Income | | | | | | | | | i. Interest Income | 460 | 877 | 1,441 | 27.5 | 90.7 | 64.3 | | | ii. Non-interest Income | 4,801 | 5,630 | 6,416 | 34.8 | 17.3 | 14.0 | | B | Expenditure | | | | | | | | | i. Interest Expenses | 157 | 247 | 356 | 56.0 | 57.5 | 44.1 | | | ii. Operating Expenses | 5,216 | 6,154 | 7,292 | 13.8 | 18.0 | 18.5 | | | iii. Provisions and Contingencies | 20 | 15 | 115 | -44.4 | -25.5 | 688.6 | | | of which, | | | | | | | | | Risk Provisions | 21 | 4 | 11 | 133.3 | -81.7 | 185.3 | | | Tax Provisions | -2 | 8 | 68 | -111.0 | 415.8 | 773.4 | | C | Net Interest Income | 303 | 630 | 1,085 | 15.7 | 107.7 | 72.2 | | D | Profit | | | | | | | | | i. Operating Profit (EBPT) | -111 | 106 | 209 | 85.4 | 195.4 | 97.0 | | | ii. Net Profit/Loss | -131 | 92 | 94 | 83.6 | 170.0 | 3.0 | | Source: Off-site returns (domestic operations), RBI. | IV.102 Their NIM improved from 3.7 per cent at end-March 2023 to 5.7 per cent at end-March 2024, reflecting higher increase in interest income relative to interest expenses (Chart IV.43). RoA and RoE of PBs remained positive at end-March 2024. IV.103 PBs’ cost-to-income ratio declined further during 2023-24, suggesting improvement in efficiency (Table IV.41). 17. Overall Assessment IV.104 During 2023-24, banks’ consolidated balance sheet expanded at a healthy pace, with robust deposit and credit growth. Broad-based credit growth was led by personal loans and services sectors. Banks’ profitability improved, while liquidity and provision buffers remained comfortable. Lower slippages helped strengthen asset quality across the board. The share of unsecured advances in total advances declined, reflecting the Reserve Bank’s measures to contain build-up of risk in these sectors. IV.105 New and emerging technologies are reshaping the banking industry by bringing in innovative solutions along with new challenges. Indian banks are at the forefront of digitalisation, aiming to leverage technology for productivity and efficiency gains. With the adoption of new technology, however, the risks of cyber attacks, digital frauds, data breaches and operational failures have also increased. | Table IV.41: Select Financial Ratios of Payments Banks | | (At end-March) | | Sr. No. | Item | 2022 | 2023 | 2024 | | 1 | 2 | 3 | 4 | 5 | | 1 | Return on Assets | -0.7 | 0.4 | 0.4 | | 2 | Return on Equity | -5.3 | 3.1 | 2.7 | | 3 | Investments to Total Assets | 56.1 | 52.7 | 55.9 | | 4 | Net Interest Margin | 2.3 | 3.7 | 5.7 | | 5 | Efficiency (Cost-Income Ratio) | 102.2 | 98.3 | 97.2 | | 6 | Operating Profit to Working Funds | -0.6 | 0.5 | 0.8 | | 7 | Profit Margin | -2.6 | 1.5 | 1.3 | Note: Data pertain to 6 PBs.
Source: Off-site returns (domestic operations), RBI. | IV.106 Going forward, there is a continuing need for banks to strengthen their risk management standards, IT governance arrangements and customer onboarding and transaction monitoring systems to check unscrupulous activities, including suspicious and unusual transactions.
|