In response to the adjustment of the rupee exchange rate, slowdown in imports, particularly gold, as also improvements in global trade, India’s trade deficit contracted y-o-y for the sixth consecutive month in December 2013. Consequent upon the shrinking of the trade deficit, the CAD declined from 4.9 per cent of GDP in Q1 to 1.2 per cent of GDP in Q2 of 2013-14. The full year CAD is likely to be contained within the sustainable level of about 2.5 per cent of GDP. This, along with renewed capital inflows, bolstered through the Reserve Bank’s swap windows helped reduce external vulnerabilities and boost confidence. The forex reserve loss earlier in the year has been more than recouped and near-term external vulnerabilities have been mitigated. However, as the capital flows to EMDEs could moderate over 2014-15, there is no scope for complacency and the breather provided by a reduction in the immediate risks needs to be used for developing the resilience of the external sector over the medium term.
Gradual recovery in world trade
III.1 Global growth remained below the trend in 2013, though activity strengthened during H2 of 2013 (see also Chapter I). In line with the expanding activity, world trade is gradually recovering albeit at a pace lower than that observed before the global financial crisis. Amongst EMDEs, upward momentum in exports has been particularly observed in the case of Brazil, South Africa and Russia (Chart III.1).
Trade deficit continued to narrow in Q3
III.2 India’s exports benefited from a moderate recovery in major advanced economies. With a pickup in merchandise exports since July 2013 and a moderation in imports since June 2013, the trade deficit at US$ 110 billion during April-December 2013 was 25 per cent lower than that in the corresponding period of 2012-13 (Table III.1 and Chart III.2a). Export growth is gradually becoming more broad-based both in terms of destination countries as well as commodities. In recent months, exports to the US, Germany, Saudi Arabia, China, Hong Kong SAR and Malaysia have grown significantly. Commodity-wise, exports of engineering goods, readymade garments, cotton yarn, basic chemicals, plastic & linoleum, leather & leather products, manmade fiber and marine products have grown significantly in recent months. Moreover, the Reserve Bank’s and the Government’s policies relating to gold imports, including increases in customs duty, helped in moderating gold imports since July 2013. This accounted for nearly 72 per cent of the total decline in imports during July-December 2013 (Chart III.2b).
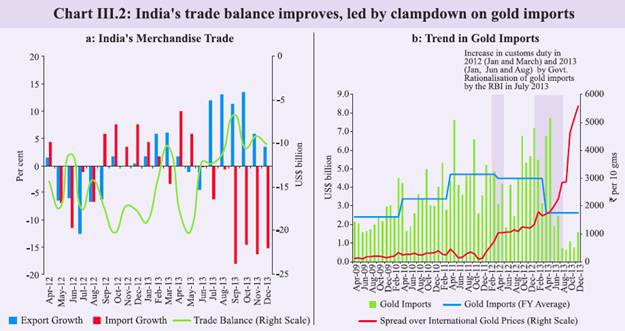
Table III.1: Trade deficit narrowed significantly in H1 of 2013-14 reflecting turnaround in Q2 of 2013-14 |
India’s merchandise trade |
(US$ billion) |
Item |
April-March |
April-December |
2011-12 |
2012-13 |
2012-13 |
2013-14 |
Value |
Growth |
Value |
Growth |
Value |
Growth |
Value |
Growth |
1 |
2 |
3 |
4 |
5 |
6 |
7 |
8 |
9 |
Exports |
306.0 |
21.8 |
300.4 |
-1.8 |
217.4 |
-4.0 |
230.3 |
5.9 |
Of which: Oil |
56.0 |
35.1 |
60.9 |
8.6 |
44.8 |
5.7 |
45.4 |
1.5 |
Non-oil |
249.9 |
19.2 |
239.5 |
-4.2 |
172.7 |
-6.3 |
184.9 |
7.1 |
Gold |
6.7 |
10.8 |
6.5 |
-3.2 |
4.7 |
-6.0 |
4.4 |
-5.4 |
Non-Oil Non-Gold |
243.2 |
19.5 |
233.0 |
-4.2 |
168.0 |
-6.3 |
180.5 |
7.4 |
Imports |
489.3 |
32.3 |
490.7 |
0.3 |
364.2 |
0.1 |
340.4 |
-6.6 |
Of which: Oil |
155.0 |
46.2 |
164.0 |
5.9 |
121.8 |
9.8 |
125.0 |
2.6 |
Non-oil |
334.4 |
26.7 |
326.7 |
-2.3 |
242.4 |
-4.1 |
215.4 |
-11.1 |
Gold |
56.3 |
39.1 |
53.7 |
-4.7 |
38.0 |
-9.0 |
23.7 |
-37.6 |
Non-Oil Non-Gold |
278.0 |
24.5 |
273.0 |
-1.8 |
204.4 |
-3.2 |
191.7 |
-6.2 |
Trade Balance |
-183.4 |
|
-190.3 |
|
-146.8 |
|
-110.0 |
|
Of which: Oil |
-98.9 |
|
-103.2 |
|
-77.1 |
|
-79.5 |
|
Non-oil |
-84.4 |
|
-87.2 |
|
-69.7 |
|
-30.5 |
|
Non-Oil Non-Gold |
-34.8 |
|
-40.0 |
|
-36.4 |
|
-11.2 |
|
Note: Negative value indicates deficit.
Source: DGCI&S. |
Lower trade deficit in Q2 and Q3 of 2013-14 brings CAD to sustainable levels
III.3 Following a lower trade deficit in Q2, India’s current account deficit narrowed sharply to US$ 5.2 billion (1.2 per cent of GDP) in Q2 of 2013-14 from US$ 21 billion (5.0 per cent of GDP) in Q2 of 2012-13, also much lower than the 4.9 per cent of GDP in Q1 of 2013-14 (Table III.2). Besides the fall in trade deficit, net invisibles improved during Q2 of 2013-14, essentially reflecting a rise in net services exports, mainly on account of ‘computer services’. DGCI&S trade data for Q3 suggests that the CAD correction in Q2 has been sustained in Q3. So, unless unforeseen factors again make a dent in the CAD in the last quarter, the full-year CAD will fall below 2.5 per cent of GDP. However, given continuing uncertainty of global capital flows, this should not breed complacency.
Table III.2: Significant improvement in trade balance leads to a lower CAD to GDP ratio |
Major items in India's balance of payments |
(US $ billion) |
| |
2012-13 (PR) |
2012-13 |
2013-14 |
Q1 (PR) |
Q2 (PR) |
Q3 (PR) |
Q4 (PR) |
Q1 (P) |
Q2 (P) |
1 |
2 |
3 |
4 |
5 |
6 |
7 |
8 |
1. Goods Exports |
306.6 |
75.0 |
72.6 |
74.2 |
84.8 |
73.9 |
81.2 |
2. Goods Imports |
502.2 |
118.9 |
120.4 |
132.6 |
130.4 |
124.4 |
114.5 |
3. Trade Balance (1-2) |
-195.7 |
-43.8 |
-47.8 |
-58.4 |
-45.6 |
-50.5 |
-33.3 |
4. Services Exports |
145.7 |
35.8 |
35.0 |
37.1 |
37.8 |
36.5 |
36.7 |
5. Services Imports |
80.8 |
20.8 |
18.7 |
20.4 |
20.9 |
19.7 |
18.3 |
6. Net Services (4-5) |
64.9 |
15.0 |
16.3 |
16.6 |
17.0 |
16.9 |
18.4 |
7. Goods & Services Balances (3+6) |
-130.7 |
-28.9 |
-31.5 |
-41.7 |
-28.7 |
-33.6 |
-14.9 |
8. Primary Income (Net) |
-21.5 |
-4.9 |
-5.6 |
-5.8 |
-5.2 |
-4.8 |
-6.3 |
9. Secondary Income (Net) |
64.4 |
16.9 |
16.1 |
15.7 |
15.8 |
16.7 |
16.1 |
10. Net Income (8+9) |
42.9 |
11.9 |
10.5 |
9.9 |
10.6 |
11.8 |
9.8 |
11. Current Account Balance (7+10) |
-87.8 |
-16.9 |
-21.0 |
-31.9 |
-18.1 |
-21.8 |
-5.2 |
12. Capital Account Balance |
-0.3 |
-0.2 |
-0.2 |
0.0 |
0.2 |
0.8 |
-0.1 |
13. Financial Account Balance |
85.4 |
16.1 |
21.0 |
30.8 |
17.6 |
20.1 |
5.0 |
of which: Change in Reserves |
-3.8 |
-0.5 |
0.2 |
-0.8 |
-2.7 |
0.3 |
10.4 |
14. Errors & Omissions (11+12+13) |
2.7 |
1.1 |
0.2 |
1.1 |
0.3 |
0.9 |
0.2 |
Memo: As a ratio to GDP |
|
|
|
|
|
|
|
15. Trade Balance |
-10.6 |
-10.2 |
-11.4 |
-12.0 |
-9.0 |
-11.3 |
-7.9 |
16. Net Services |
3.5 |
3.5 |
3.9 |
3.4 |
3.3 |
3.8 |
4.4 |
17. Net Income |
2.3 |
2.8 |
2.5 |
2.0 |
2.1 |
2.6 |
2.3 |
18. Current Account Balance |
-4.8 |
-4.0 |
-5.0 |
-6.5 |
-3.6 |
-4.9 |
-1.2 |
19. Capital and Financial Account, Net (Excl. changes in reserves) |
4.8 |
3.8 |
4.9 |
6.5 |
4.0 |
4.6 |
-1.3 |
Note: Total of sub-components may not tally with aggregate due to rounding off.
P: Preliminary. PR: Partially Revised. |
CAD in Q2 financed by drawdown of foreign exchange reserves
III.4 Although the CAD in Q2 was significantly lower than Q1, there was net outflow of capital thereby leading to a drawdown of India’s foreign exchange reserves (on BoP basis) by US$ 10.4 billion in Q2 (Chart III.3). Although flows under net FDI and NRI deposits rose in Q2 as compared to the preceding quarter, these were offset by outflows under FIIs, repayments of short-term trade credit and an overseas build up of assets by commercial banks particularly in September 2013 (Table III.3). Subsequent to the Fed’s indication on QE tapering on May 22, 2013, there were large FII outflows, particularly in the debt segment as bond prices fell, the cost of hedging a volatile rupee rose and yield differentials narrowed for FII debt investors. However, the trend in FII flows reversed since mid-November 2013 and there was a net capital inflow of nearly US$ 7.7 billion up to January 24, 2014, comprising of US$ 3.7 billion of equity and US$ 3.9 billion of debt.
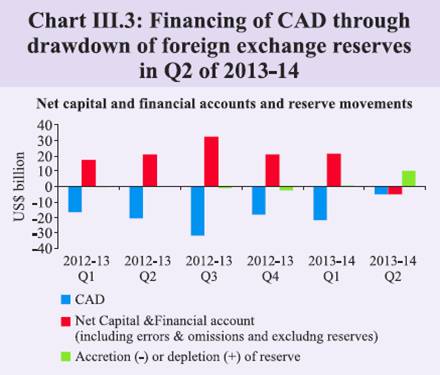
Table III.3: In Q2, forex reserve declined mainly due to outflow of FII investment in debt |
Disaggregated items of the financial account |
(US$ billion) |
| |
2012-13 (PR) |
2012-13 |
2013-14 |
Q1 (PR) |
Q2 (PR) |
Q3 (PR) |
Q4 (PR) |
Q1 (P) |
Q2 (P) |
1 |
2 |
3 |
4 |
5 |
6 |
7 |
8 |
1. Direct Investment (net) |
19.8 |
3.8 |
8.2 |
2.1 |
5.7 |
6.5 |
6.9 |
1.a Direct Investment to India |
26.9 |
5.9 |
9.5 |
4.3 |
7.2 |
6.5 |
7.5 |
1.b Direct Investment by India |
-7.1 |
-2.1 |
-1.4 |
-2.2 |
-1.4 |
0.0 |
-0.6 |
2. Portfolio Investment |
26.7 |
-2.0 |
7.6 |
9.8 |
11.3 |
-0.2 |
-6.6 |
2.a Portfolio Investment in India |
27.6 |
-1.7 |
7.9 |
9.8 |
11.5 |
-0.5 |
-6.6 |
2.b Portfolio Investment by India |
-0.9 |
-0.3 |
-0.3 |
-0.1 |
-0.2 |
0.2 |
0.0 |
3. Financial Derivatives & Employee Stock Options |
-2.3 |
-0.6 |
-0.5 |
-0.4 |
-0.9 |
-0.5 |
-1.6 |
4. Other Investment |
45.2 |
15.4 |
5.6 |
20.0 |
4.2 |
14.0 |
-4.0 |
4.a Other equity (ADRs/GDRs) |
0.2 |
0.1 |
0.1 |
0.0 |
0.0 |
0.0 |
0.0 |
4.b Currency and deposits |
15.3 |
6.4 |
3.5 |
2.6 |
2.8 |
5.6 |
8.4 |
Deposit-taking corporations, except the central bank: (NRI Deposits) |
14.8 |
6.6 |
2.8 |
2.7 |
2.8 |
5.5 |
8.3 |
4.c Loans* |
10.7 |
3.5 |
3.0 |
5.7 |
-1.6 |
5.9 |
-5.3 |
4.c.i Loans to India |
11.1 |
3.5 |
3.3 |
5.9 |
-1.6 |
5.4 |
-5.5 |
Deposit-taking corporations, except the central bank |
1.3 |
3.0 |
2.0 |
2.6 |
-6.3 |
4.7 |
-6.7 |
General government (External Assistance) |
1.3 |
0.1 |
0.1 |
0.4 |
0.6 |
0.3 |
-0.1 |
Other sectors (ECBs) |
8.6 |
0.4 |
1.2 |
2.9 |
4.1 |
0.4 |
1.3 |
4.c.ii Loans by India |
-0.4 |
0.1 |
-0.3 |
-0.2 |
0.0 |
0.4 |
0.2 |
General government (External Assistance) |
-0.3 |
-0.1 |
-0.1 |
-0.1 |
-0.1 |
-0.1 |
-0.1 |
Other sectors (ECBs) |
-0.1 |
0.1 |
-0.3 |
-0.1 |
0.1 |
0.5 |
0.2 |
4.d Trade credit and advances |
21.7 |
5.4 |
4.1 |
7.7 |
4.5 |
2.5 |
-1.9 |
4.e Other accounts receivable/payable - other |
-2.7 |
-0.1 |
-5.1 |
4.0 |
-1.5 |
0.2 |
-5.3 |
5. Reserve assets |
-3.8 |
-0.5 |
0.2 |
-0.8 |
-2.7 |
0.3 |
10.4 |
Financial Account (1+2+3+4+5) |
85.4 |
16.1 |
21.0 |
30.8 |
17.6 |
20.1 |
5.0 |
P: Preliminary. PR: Partially Revised.
*: Includes external assistance, ECBs, non-NRI banking capital and short term trade credit.
Note: Total of sub-components may not tally with aggregate due to rounding off. |
III.5 In September 2013, the Reserve Bank had offered a window for the banks to swap the fresh FCNR(B) dollar funds with the Reserve Bank, and increased their overseas borrowing limit from 50 to 100 per cent of the unimpaired Tier-I capital of banks (with the option of swap with the Reserve Bank). Accordingly, a significant rise was discernible in NRI deposits in the recent period (Table III.4). Inflows of US$ 34.3 billion under the swap windows have helped to rebuild foreign exchange reserves thus covering possible external financing requirements and concomitantly providing stability to the foreign exchange market. These swap schemes were closed on November 30, 2013. Since end-August 2013, India’s foreign exchange reserves had surged by US$ 16.6 billion to US$ 292.1 billion as on January 17, 2014.
Table III.4: FII fows reversed since mid-November 2013 |
Trend in capital fows |
(US$ billion) |
Monthly Average |
2012-13 |
2013-14 |
Q1 |
Q2 |
Q3 |
Q4 |
Q1 |
Q2 |
Q3 |
1 |
2 |
3 |
4 |
5 |
6 |
7 |
8 |
FDI in India |
2.0 |
3.2 |
1.4 |
2.4 |
2.2 |
2.5 |
1.6 |
FDI by India |
0.7 |
0.5 |
0.7 |
0.5 |
0.0 |
0.2 |
-0.2 |
FIIs |
-0.6 |
2.6 |
3.3 |
3.8 |
-0.2 |
-2.2 |
0.8 |
ADRs/GDRs |
0.03 |
0.03 |
0.0 |
0.0 |
0.0 |
0.0 |
0.0 |
ECB |
0.1 |
0.4 |
1.0 |
1.4 |
0.1 |
0.4 |
1.8# |
NRI |
2.2 |
0.9 |
0.9 |
0.9 |
1.8 |
2.7 |
9.7 |
#: Estimate (Oct-Dec, 2013).
Note: Data for Q3 pertain to October-November 2013 only
except for FII and ECB. |
Exchange rate stabilised in a narrow range since mid-September 2013
III.6 With the Fed’s first indication on QE tapering on May 22, 2013, sudden and large capital outflows occurred from most EMDEs, including from India. These outflows caused EMDE-currencies to come under intense pressure. However, several measures relating to the policy rate, liquidity and forex swap facilities by the Reserve Bank have helped in containing forex volatility (Chart III.4). These policy measures and the postponement of QE tapering by the US Fed helped the rupee to recover since early-September 2013.
III.7 On December 18, 2013, the US Fed announced a modest tapering of QE from January 2014. In sharp contrast to the experience in May 2013, the Indian rupee exhibited strong resilience in relation to other currencies in terms of exchange rate movements and its volatility in the post announcement period. This was mainly because of the rebuilding of buffers and shrinking of the CAD supported by appropriate policies, including exchange rate adjustment (Chart III.5).
III.8 In terms of the real exchange rate, as on January 24, 2014, the 6-currency and 36-currency REER showed a depreciation of 10.4 and 7.8 per cent respectively over March 2013 (Table III.5).
Table III.5: Real exchange rate movements indicate rupee depreciation |
Nominal and real effective exchange rates: trade-based (base: 2004-05=100)* |
Index |
Jan 24, 2014 (P) |
Y-o-Y Variation 2012-13 over 2011-12 |
FY Variation (Jan 24, 2014) over Mar 2013) |
1 |
2 |
3 |
4 |
36- REER |
87.7 |
-6.7 |
-7.8 |
36-NEER |
69.9 |
-10.4 |
-11.2 |
6-REER |
95.8 |
-5.9 |
-10.4 |
6-NEER |
65.0 |
-10.5 |
-15.4 |
` /US$ |
62.2 |
-11.9 |
-12.5 |
P: Provisional;
*: For countries other than India, CPI is used,
while for India WPI is used.
Rise in indices indicates appreciation of the rupee and vice versa.
Note: NEER: Nominal Effective Exchange Rate.
REER: Real
Effective Exchange Rate. |
Some external sector vulnerability indicators show improvement in Q2 of 2013-14
III.9 India’s external debt stock has not increased during H1 of 2013-14. However, external debt as a ratio to GDP was marginally higher at end-September 2013, mainly reflecting rupee depreciation. Composition-wise, while the level of long-term debt rose in Q2 of 2013-14, short term external debt (original as well as residual maturity) as a ratio of total external debt decline marginally. This decline reflected a fall in the short-term trade credit and FII outflows from the debt segment during the period (Table III.6).
Table III.6: India’s external debt remains unchanged in H1 of 2013-14 |
(US$ billion) |
Item |
End-Mar 2013 (PR) |
End-Jun 2013 (PR) |
End-Sep 2013 (QE) |
Per cent Variation (4) over (3) |
1 |
2 |
3 |
4 |
5 |
1. Multilateral |
51.6 |
51.7 |
52.5 |
1.6 |
2. Bilateral |
25.1 |
24.8 |
24.7 |
-0.3 |
3. IMF |
6.0 |
6.0 |
6.1 |
2.0 |
4. Trade Credit (above 1 year) |
17.8 |
17.4 |
16.6 |
-4.5 |
5. Commercial Borrowings |
131.0 |
131.6 |
129.1 |
-1.9 |
6. NRI Deposits |
70.8 |
71.1 |
75.1 |
5.5 |
7. Rupee Debt |
1.3 |
1.2 |
1.4 |
10.5 |
8. Long-term (1 to 7) |
303.6 |
303.9 |
305.5 |
0.5 |
9. Short-term |
96.7 |
96.8 |
94.8 |
-2.1 |
Total (8+9) |
400.3 |
400.6 |
400.3 |
-0.1 |
| PR: Partially Revised. QE: Quick Estimates. |
III.10 Broadly reflecting a fall in India’s foreign exchange reserves during Q2 of 2013- 14, most reserve based external sector vulnerability indicators worsened during the period. In spite of a fall in India’s reserves by US$ 5.2 billion in Q2, the import cover fell only marginally as imports contracted during this period (Table III.7). In line with capital outflows, net external liabilities, as reflected by the net international investment position (net IIP) - GDP ratio, declined at end-September 2013.
Table III.7: External sector vulnerability indicators showed a mixed trend |
(Ratios in per cent) |
Indicator |
End-Mar 2013 |
End-Jun 2013 |
End-Sep 2013 |
1 |
2 |
3 |
4 |
1. Ratio of Total Debt to GDP |
21.7 |
23.4 |
23.8 |
2. Ratio of Short-term to Total Debt (Original Maturity) |
24.2 |
24.2 |
23.7 |
3. Ratio of Short-term to Total Debt (Residual Maturity)# |
43.1 |
42.5 |
42.3 |
4. Ratio of Concessional Debt to Total Debt |
11.4 |
11.3 |
11.5 |
5. Ratio of Reserves to Total Debt |
73.0 |
71.1 |
69.3 |
6. Ratio of Short-term Debt to Reserves (Original Maturity) |
33.1 |
34.0 |
34.2 |
7. Ratio of Short-term Debt to Reserves (Residual Maturity) |
59.0 |
60.2 |
61.0 |
8. Reserves Cover of Imports (in months) |
7.0 |
6.7 |
6.6 |
9. Reserves Cover of Imports and Debt Service Payments (in months) |
6.6 |
6.3 |
6.2 |
10.Debt-Service Ratio (Debt Service Payments to Current Receipts) |
5.9 |
6.3 |
5.4 |
11.External Debt (US$ billion) |
400.3 |
400.6 |
400.3 |
12.Net International Investment Position (IIP) (US$ billion) |
-317.6 |
-309.0 |
-296.2 |
13.Net IIP/GDP Ratio |
-17.2 |
-16.6 |
-15.9 |
#: RBI Estimate. |
Moderation in CAD should not build complacency given volatility in capital flows
III.11 An improved trade performance and a sharp decline in CAD in recent months have instilled confidence in India’s external sector. A sustained improvement in India’s trade performance over the long run will, however, hinge on the pace of global recovery and improvement in the competitiveness of Indian exports.
III.12 It is important that the lower CAD in recent quarters does not breed complacency, particularly after the US Fed’s asset purchase tapering announcement, which could impact capital flows. Looking ahead improving global trade and a reduced CAD are likely to keep external sector risks manageable in face of external shocks.
|