by Yuvraj Kashyap, Kamal Gupta and Arvind Jha^ This article investigates the transmission of monetary policy to banks' fresh lending rates in India by decomposing changes in the weighted average lending rate (WALR) into interest rate (repricing) effects and composition (weight) effects. The repricing component is observed to closely align with changes in the policy rate, while compositional shifts in bank credit also substantially influence overall WALR movements. The findings emphasise that although the WALR is a good measure of lending rates, assessing pass-through should also consider changes in credit mix across banks and sectors, which can dampen or amplify the effects of interest rate adjustments. Introduction Monetary policy transmission describes how changes in the policy rate, among others, pass-through to prices/quantities in financial markets/ intermediaries, which in turn affect inflation and real economic activity, such as output and consumption. It operates through several channels, including the interest rate, exchange rate, asset price, credit, and expectations channels. As financial systems become more advanced, most central banks use a short-term interest rate as the primary monetary policy tool; India uses the weighted average call rate (WACR). In this context, the interest rate channel gains prominence, with policy rate changes first affecting short-term money market rates and then influencing a broader range of interest rates, including bank deposit and lending rates (Sharma et al., 2021; Mitra & Chattopadhyay, 2020). Empirical evidence on the pass-through of policy rate changes to bank lending rates in India, however, is mixed. Existing studies investigate asymmetries and non-linearities in the transmission to bank lending rates (e.g., Kashyap et al., 2023; Kumar et al., 2022). Most of this literature relies on the weighted average lending rate (WALR) as a key indicator of borrowing costs within the banking system. While the WALR offers a convenient aggregate measure, its interpretation is complex, as movements in WALR reflect both changes in interest rates and shifts in the composition of credit across banks and sectors. Hence, changes in WALR over time can stem from two sources: changes in interest rates on loans, i.e., the interest rate effect and shifts in the distribution of credit among various loan types or borrower groups with different interest rates (weight or composition effect). The change in credit mix is more prominent in the fresh rupee loans compared to outstanding loans. The composition mix of outstanding loans are relatively sticky. Thus, overlooking this distinction, especially in fresh loans, may lead to an overly simplistic understanding of how monetary policy transmits to lending rates, especially when changes in loan composition can obscure or amplify underlying movements in lending rates. Therefore, the significance of distinguishing between repricing and composition effects has been emphasised in the Reserve Bank’s communications after MPC meetings. In recent post-MPC statements, the interest rate effect1 was explicitly highlighted along with the overall change in WALR on fresh loans. Although empirical studies of monetary policy transmission widely use aggregate lending rates (i.e., WALR), they have paid limited attention to decomposing their movements into re-pricing and composition components. Huerga & Steklacova (2008) demonstrate that aggregate interest rates can be viewed as index numbers, providing a formal framework for decomposing changes in aggregate rates into interest rate effects and composition effects. Likewise, the Banco Central de Chile (2019) estimates the interest rate effect using loan weights averaged over the past twelve months. In India, the Monetary Policy Report (April 2026 ) illustrates the decomposition of weighted average lending rate (WALR) on fresh loans into interest rate and composition effects, emphasising the need to differentiate these components when analysing monetary policy transmission2. Nonetheless, academic research has yet to explore the theoretical basis, methodological details, and robustness of alternative index-number approaches. This article applies the index-number framework to decompose monetary policy transmission to the weighted average lending rate (WALR) on fresh loans of scheduled commercial banks (SCBs) in India, separating interest rate and composition effects using detailed bank- and sectoral-level data. It makes three main contributions: first, it creates a formal method to decompose WALR changes into interest rate and composition effects; second, it evaluates the robustness of this decomposition across different index-number formulations; and third, it highlights how shifts in sectoral lending distribution can significantly affect the measurement of monetary policy transmission. The rest of the paper is organised as follows: Section II discusses the key features of WALR on fresh loans, Section III explains the methodological derivation, Section IV presents results from various decomposition methods, and Section V concludes the paper. II. Evidence from the Indian Banking Sector At the customer level, scheduled commercial banks (SCBs) can offer loans at either fixed or floating rates. For floating-rate loans, the rates may be linked to the marginal cost of funds-based lending rate (MCLR) or the external benchmark-based lending rate (EBLR), along with other legacy benchmarks, in accordance with regulatory guidance issued by the Reserve Bank from time to time. The WALR is derived by accounting for all such loans and the interest rates applied to them. Besides the benchmark, the customer’s risk profile and other commercial considerations are also factored in when deciding the lending rate to a particular sector/borrower. Essentially, the WALR captures the current demand and supply conditions for loans within a particular sector. This results in asymmetric variations in interest rates across banks and sectors. Bank lending activity in India shows a distinct seasonal trend, with loan approvals peaking at quarter-ends, particularly in March (Chart 1). This trend stems from several institutional factors, including balance-sheet considerations, regulatory and internal performance goals, and higher credit demand from firms aiming to finalise financial transactions before year-end. As a result, loan approvals and disbursements are generally front-loaded at the end of each quarter. Following the surge in loan sanctions in March, banks prefer to reallocate their portfolios early in the new financial year, focusing more on lower-cost segments like working capital renewals, short-term loans, and high-rated borrowers. This shift in composition exerts downward pressure on WALR due to the weight effect. Thus, the observed moderation in WALR in June is mainly resulting from typical normalisation in loan composition after the fiscal year, rather than from targeted interest rate cuts. 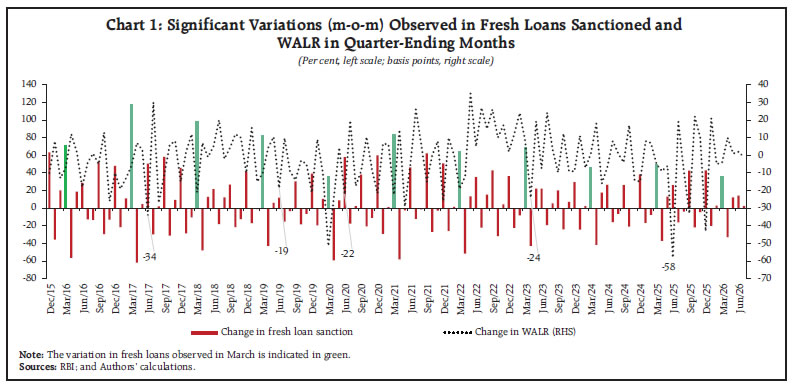 In response to a 100-basis point cut in the policy repo rate by June 2025, which began in February 2025, WALR on fresh rupee loans fell by 78 bps;58 bps of that decline happened in June alone. In contrast, there was an increase in WALR by 32 bps between September-November 2025. As alluded to earlier, the movement in WALR may also reflect changes in the composition of lending across different loan segments. Such changes in lending composition can, therefore, influence the observed movement in WALR alongside changes in lending rates charged by individual banks. This highlights the need to distinguish changes arising from loan repricing from those arising from shifts in the composition of lending. The following section develops an index-number-based decomposition framework to identify these two influences on WALR separately. III. Methodology Decomposition of Weighted Average Lending Rate Huerga & Steklacova (2008) provide an index-number- based framework that decomposes shifts in overall interest rates into repricing and composition effects. Building on this idea, this article applies index-number theory to the WALR of SCBs to measure the relative significance of loan repricing and changes in credit composition in shaping observed WALR trends. The primary decomposition is performed at levels to maintain a straightforward interpretation in terms of basis points (bps). The decomposition is demonstrated below. To assess monetary policy transmission, let us consider WALR (Rt) for two time periods t = 1, and 2. Transmission can be defined as the change in walr at time 2 relative to time 1.
Interpretation: The interest rate effect measures how changes in sector- and bank-specific lending rates affect overall WALR, assuming no compositional shift in credit across banks or sectors, i.e., keeping weights constant. The composition effect, on the other hand, reflects the impact of shifts in the distribution of credit across banks and sectors on overall WALR. Intuitively, even if the individual lending rate remains unchanged, a shift in the share of loans toward a higher- or lower-rate segment can alter aggregate WALR and, in turn, the extent of transmission. For sector-wise analysis, the above decomposition can be written for a given sector i as: Interpretation: The interest rate effect for a particular sector measures the contribution of changes in bank-specific lending rate to changes in aggregate WALR, assuming constant share of banks in credit to that sector. The composition effect, on the other hand, reflects the distribution of credit across banks. Intuitively, even if the lending rate remains unchanged, a shift in the share of loans towards an entity (bank) with higher or lower rate can change the aggregate WALR. IV. Results This section presents the results obtained using the methodologies discussed in the previous section. The aggregate level results are presented first, followed by a particular sector. The section also reports each sector’s contribution to transmission at the aggregate level. Additionally, results obtained using alternative decomposition methodologies are presented, which can be used for a long-lasting policy cycle. Aggregate-level transmission: The above computation is carried out hierarchically, aggregating bank-level data to the sectoral level and then to the system level. For example, during February 2025 - March 2026, in response to the 125-bps reduction in the policy repo rate, the aggregate WALR on fresh rupee loans declined by 93 bps (Chart 2). The decomposition, based on the constant weight of the base period (January 2025)3, indicates that the overall transmission to WALR of (-) 93 bps has been amplified by the corresponding weight effect of (-) 13 bps; the interest rate effect, however, was (-) 80 bps. This suggests that, along with moderation in interest rates, there has been a compositional shift in the sanctioned loans towards lower interest rate segments across sectors and banks. Similarly, in the tightening cycle, the overall WALR increased by 181 bps, with an interest rate effect of 191 bps. The negative weight effect of 10 bps dampened the overall effect. Despite the tightening cycle, negative weight effects were observed in large industry, other personal loans, professional services, housing, vehicle, and MSMEs (Annex I). Moreover, the weight effect can be positive or negative within a single monetary policy cycle, depending solely on the direction of the reallocation of the loan share across sectors and banks during that period. Consequently, this shift in product mix affects the pass-through of the policy repo rate to the overall lending rate. 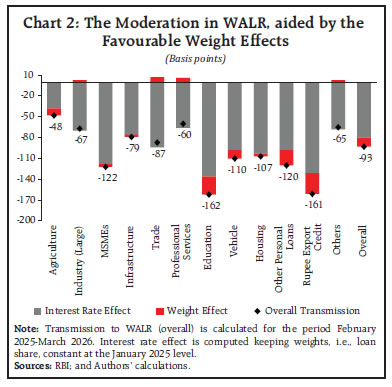 A closer examination indicates that interest rates on fresh loans across sectors have continued to decline following the policy rate cut since February 2025. The increased share of sectors with relatively higher lending rates, indicated by positive weight effect, led to moderation in overall transmission to WALR (Table 1). This may also reflect a strategic move by some banks to protect their margins, particularly during easing cycles. | Table 1: Contribution to Monetary Policy Transmission (Feb 2025 - Mar 2026) | | (In basis points) | | Sectors | Interest Rate Effect | Weight Effect | Overall Transmission | | Agriculture | -4 | -12 | -16 | | Industry (large) | -22 | 9 | -13 | | MSMEs | -12 | 24 | 12 | | Infrastructure | -3 | 16 | 13 | | Trade | -9 | -9 | -18 | | Professional services | -2 | -2 | -4 | | Credit Cards | 0 | -13 | -13 | | Education | 0 | -1 | -1 | | Vehicle | -2 | -6 | -8 | | Housing | -6 | -9 | -15 | | Other personal loans | -9 | -6 | -15 | | Rupee export credit | -3 | -5 | -8 | | Others | -8 | 1 | -7 | | Overall | -80 | -13 | -93 | Note: Interest rate effect and weight effect are computed keeping weights and lending rates constant at the January 2025 level, respectively.
Sources: RBI; and Authors’ calculations. | Sector-wise transmission: At the sectoral level, transmission in lending rates depends not only on changes in the lending rates charged by individual banks but also on changes in the weights, i.e., the share of different banks in lending to a particular sector. The sectoral WALR can therefore be influenced by changes in the composition of lending across banks, reflecting differences in their business models and commercial objectives. Thus, a shift in the composition of lending towards banks with relatively lower (higher) lending rates would exert a downward (upward) weight effect on the sectoral WALR. During February 2025 to March 2026, the pass-through of the 125 bps repo rate cut to WALR was relatively higher for education (-162 bps) and rupee export credit (-161 bps), followed by MSMEs (-122 bps) and other personal loans (-120 bps) (Chart 2). The decomposition shows that these sectors also experienced a favourable and relatively larger weight effect, suggesting a shift in lending shares towards banks with relatively lower lending rates, which reinforced the decline in sectoral WALR. The weight effect was largest for education loans followed by rupee export credit, loans to MSMEs and housing indicating major loans has been catered by the banks with relatively lower rate of interest. In contrast, large industry, trade and professional services recorded a positive weight effect, indicating a shift in lending shares towards banks with relatively higher lending rates, which partly offset the decline in WALR arising from the interest rate effect. This compositional shift may reflect stronger credit demand being met by these banks; however, the weight effect should not be interpreted as a direct measure of credit demand, as changes in bank-level lending shares may also reflect supply-side factors. Alternative methodologies In practice, a monetary policy cycle usually lasts several months, during which credit demand and portfolio composition change continuously. In such a situation, keeping the weight constant for a single base month may weaken the influence of the structural shifts underway, such as shifting loan demand. To address this, an alternative method using a symmetric midpoint (average weight) may be useful. To measure the relative contribution of interest rates and composition shift to the WALR, using average weights, two approaches, namely, the direct difference index and the chain difference index, can be deployed. The direct index approach measures the contribution of interest rates and composition changes in the current month relative to the base month. However, this decomposition does not explicitly account for changes in portfolio composition and lending rates during the intervening period. The chain difference index approach addresses this limitation by decomposing the change in WALR between each pair of consecutive months and cumulatively aggregating the monthly effects over the period. The decomposition based on this approach is given as, 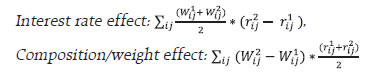 In the modified decomposition, both effects rely on average weights and rates over the considered period, offering a more balanced view of evolving loan portfolios. Chart 3 and Chart 4 provide sector-wise transmission based on the direct and chain difference index approaches, respectively. The interpretations are similar to those under the first methodology. Similarly, a decomposition based on the cumulative moving average may also be used (Annex-II). 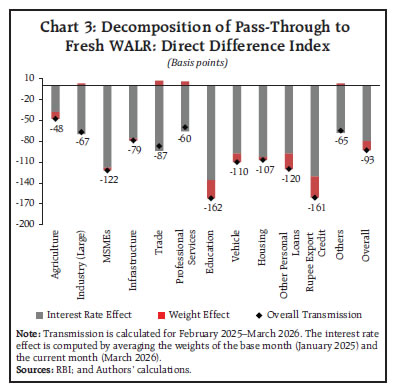 A cumulative moving average-based weight can be equally helpful as it considers the average of loan shares from the start of the policy cycle up to the current period, enabling the decomposition to reflect gradual and persistent shifts in credit composition. However, the underlying calculations could become complex. To evaluate robustness, alternative index-number methods, including ‘Marshall–Edgeworth direct difference’, ‘Marshall–Edgeworth chain difference’, and cumulative moving average weight indices, are also used. Huerga & Steklacova (2008) provide a detailed comparison of several index-number approaches, including the Laspeyres, Paasche, Walsh, and Marshall–Edgeworth indices, and demonstrate that the Marshall–Edgeworth index satisfies a broader set of axiomatic properties (Annex III). 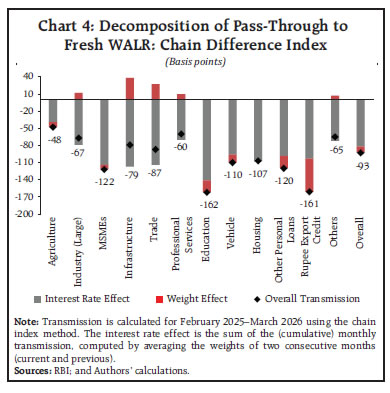 Additionally, we compare the robustness of the level-based decomposition with the log-based Divisia-Törnqvist index decomposition (Annex-IV). The level decomposition is more appropriate given the discrete nature of WALR and small monthly changes, allowing direct interpretation in basis points. The Divisia- Törnqvist decomposition, however, is log-based and therefore yields approximate percentage changes. Based on the decomposition methodologies discussed, a time-series plot of the interest rate effect on WALR shows that it has broadly followed policy rate changes during both cycles (Chart 5). The gap between the plotted interest rate changes and changes in overall WALR reflects the prevailing weight effect. The consistent concordance across index-number methodologies indicates stable repricing behaviour over time, implying that variations in overall WALR dynamics mainly stem from changes in credit composition. Consequently, shifts in the product-mix towards sectors with higher or lower rates also play a key role in shaping overall lending rates, i.e., WALR dynamics and pass-through. Summarising the monetary policy transmission to fresh lending rates, during the ongoing easing phase (February 2025–March 2026), the pass-through of a cumulative 125 bps reduction in the policy repo rate to WALR on fresh loans was 93 basis points. During the tightening phase (May 2022–January 2025), in response to a cumulative 250 bps increase in the policy repo rate, the WALR rose by 181 bps (Table 2). The decomposition-based analysis shows that the negative weight effect, observed across all measures, contributed to the pass-through in a desirable direction during the ongoing easing cycle. However, recently, the interest rate effect has hardened across all indices in March 2026, indicating higher fresh lending rates. This aligns with current developments in lending rates. In March 2026, many banks began raising their benchmark rates in response to higher funding costs. There has also been an increase in the spread or margin. Thus, a positive interest rate effect exists despite the easing cycle. This suggests that, in any cycle, the interest rate or weight effect can be positive or negative, depending on prevailing macro-financial conditions. 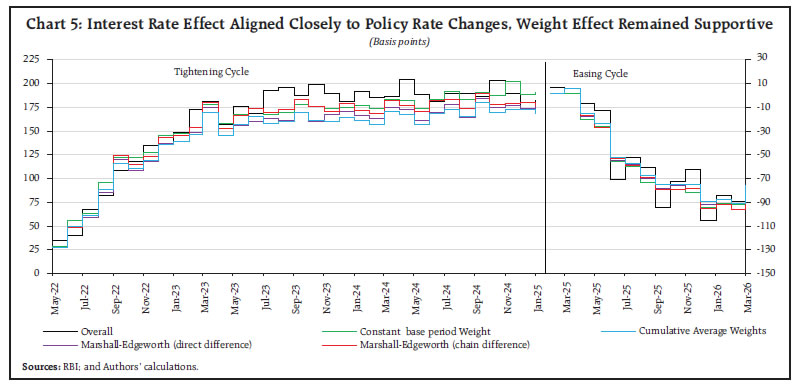
| Table 2: Monetary Policy Transmission to Fresh Lending Rates | | (In basis points) | | Period | Repo Rate | Overall | Base period | Direct difference | Chain difference | Cumulative Moving Average | | IE | WE | IE | WE | IE | WE | IE | WE | | Tightening Phase May 22 to Jan 25 | +250 | 181 | 191 | -10 | 176 | 5 | 177 | 4 | 169 | 12 | | Easing Phase Feb 25 to Mar 26 | -125 | -93 | -80 | -13 | -80 | -13 | -82 | -11 | -78 | -15 | | Memo | | Dec – 2025 | -25 | -43 | -12 | -31 | -14 | -29 | -17 | -26 | -14 | -29 | | Jan – 2026 | 0 | 21 | 3 | 18 | 4 | 17 | 3 | 18 | 1 | 20 | | Feb – 2026 | 0 | -5 | -1 | -4 | -3 | -2 | -4 | -1 | -3 | -2 | | Mar – 2026 | 0 | -4 | 12 | -16 | 11 | -15 | 14 | -18 | 13 | -17 | Note: WALR: - Weighted average lending rate; IE: -Interest Rate Effect; WE: - Weight Effect.
Sources: RBI and Authors’ calculations. | During the tightening cycle, the interest rate effect aligned with the expected line across indices; however, the weight effect was opposite for the constant base based decomposition. This contradiction with other indices may arise from the statistical mechanism of using a reference period to compute the extent of monetary policy transmission. Therefore, alternative decomposition methods aligned with the latest macro-financial developments can be employed, considering the ongoing demand and supply factors specific to the sector. V. Conclusion and Policy Implications This study shows that movements in the weighted average lending rate reflect both loan repricing and shifts in credit composition across banks and sectors. Using index number-based decomposition, the analysis demonstrates that while interest rate effect systematically respond to policy rate changes, composition effects also play a key role in shaping overall WALR dynamics, especially during easing cycles and policy pauses. From a policy perspective, results suggest that the assessments of monetary policy transmission would benefit from complementing aggregate WALR indicators with decomposition-based diagnostics that separately monitor interest rate and composition effects. In short, monetary policy transmission depends not only on how lending rates change but also on where credit flows. Moreover, future research could extend the decomposition framework to explicitly examine whether apparent lags in aggregate WALR transmission arise from delayed repricing or from changes in the composition of credit. References Banco Central de Chile. (2019). Financial Stability Report; Second Half 2019, p. 40. https://www.bcentral.cl/en/content/-/details/financial-stability-report-second-half-2019. Divisia, F. (1925). L’indice Monétaire Et La Théorie De La Monnaie. Revue d’Économie Politique, 39, 842-861. Huerga, J., & Steklacova, L. (2008). An Application of Index Numbers Theory to Interest Rates. European Central Bank Working Paper No. 939. https://www.ecb.europa.eu/pub/pdf/scpwps/ecbwp939.pdf Kashyap, Y., Kumar, A., Prakash, A., & Latey, S. V. (2023). Monetary Policy Transmission in India: Recent Dynamics. Reserve Bank of India Bulletin, LXXVII(11), 97-111. Kumar, A., Prakash, A., & Latey, S. V. (2022). Monetary Transmission to Banks’ Interest Rates: Implications of External Benchmark Regime. Reserve Bank of India Bulletin, LXXVI(4), 185-204. Mitra, A. K., & Chattopadhyay, S. K. (2020). Monetary Policy Transmission in India—Recent Trends and Impediments. Reserve Bank of India Bulletin, LXXIV(3), 11-26. Sharma, M., Jha, A. K., Suresh, A. K., & Maji, B. (2021). Monetary Policy Transmission Through the Lens of Monetary Conditions Index for India. Reserve Bank of India Occasional Papers, 42(1), 123-162.
Annex-I Annex-II Cumulative Moving Average based decomposition: Annex-III | Table 1: Axiomatic results for tests applicable at individual component level | | Index | Exhaus tiveness | Scale Invaria nce | Identity | Monoton icity | Sign Consis tency | Proporti onality | Translation Invar iance | Time Reversal | Symmetry | Factor Rev ersal | Continuity | Transitivity | | Laspeyres 3 terms | Y | Y | Y | Y | Y | Y | Y | N | N | Y | Y | N | | Laspeyres 3 terms extended | N | Y | Y | Y/N | Y/N | Y/N | Y/N | N | N | N | Y | N | | Laspeyres 2 terms | Y | Y | Y | Y | Y | Y | Y | N | N | Y | Y | N | | Laspeyres 2 terms extended | N | Y | Y | Y/N | Y/N | Y/N | Y/N | N | N | N | Y | N | | Paasche 3 terms | Y | Y | Y | Y | Y | Y | Y | N | N | Y | Y | N | | Paasche 3 terms extended | N | Y | Y | Y/N | Y/N | Y/N | Y/N | N | N | N | Y | N | | Paasche 2 terms | Y | Y | Y | Y | Y | Y | Y | N | N | Y | Y | N | | Paasche 2 terms extended | N | Y | Y | Y/N | Y/N | Y/N | Y/N | N | N | N | Y | N | | Marshall-Edgeworth | Y | Y | Y | Y | Y | Y | Y | Y | Y | Y | Y | N | | Marshall-Edgeworth ext. | N | Y | Y | Y/N | Y/N | Y/N | Y/N | Y | Y/N | N | Y | N | | Walsh 3 terms | N | Y | Y | Y | Y | Y | Y | Y | Y | Y | Y | N | | Source: Huerga and Steklacova, (2008), pp 32 (http://dx.doi.org/10.2139/ssrn.1265502) | Annex-IV Decomposition of Transmission to WALR using Divisia-Törnqvist Index
• Decomposition of Transmission to WALR: Level-based versus Divisia -Törnqvist Index I. Level-based decomposition provides the exact identity of interest rate and weight effects; Divisia-Törnqvist decomposition is a log-based approximation. II. The transmission and decomposition unit is expressed as a percentage change in Divisia-Törnqvist, whereas it is measured in basis points in level-based decomposition. III. If the associated share of loans of any bank or sector is zero, in some rare cases, the log-based Divisia-Törnqvist decomposition will not be feasible.
|