by Ankon Ghosh, Bipul Ghosh and Sandhya Kuruganti^ The heightened influence of geopolitical tensions on asset market dynamics raises important questions on how safe haven assets respond to changing geopolitical risk and whether nonlinear models offer superior volatility forecasts, making the issue both topical and policy relevant. We find that while crude oil price volatility is acutely sensitive to such shocks, gold price volatility remains consistently stable. Silver and US Treasury securities exhibit intermediate behaviour, reflecting mixed properties of industrial exposure and flight-to-safety demand. The analysis further shows that neural network based models, particularly nonlinear frameworks incorporating country specific geopolitical risk indices, outperform traditional econometric models in forecasting volatility. These results indicate that safe haven assets react heterogeneously to geopolitical stress and that nonlinear amplification effects are economically meaningful. Hence, investors and policymakers need to recognise asset specific risk transmission channels and avoid overreliance on linear frameworks. Introduction Since the Global Financial Crisis (GFC) of 2007-2008, the concept of safe haven assets has attracted scholarly and practitioner interest, as market participants increasingly seek shelter during periods of elevated uncertainty. A safe haven asset is typically characterised as one that either retains or appreciates in value amidst market turmoil, thereby positioning itself as a compelling investment choice during episodes of economic and financial stress. These assets are generally highly liquid and benefit from persistent and stable demand factors that contribute to their enduring relevance and resilience against obsolescence or substitution. Building on this foundational understanding, a substantial body of research has evaluated the historical performance of various safe haven assets during significant global disruptions, such as the GFC and the Covid-19 pandemic. However, most of this literature adopts a retrospective lens, assessing asset performance on a post-facto basis. In contrast, this study adopts a forward-looking perspective by forecasting the volatility of widely acknowledged safe haven assets and quantifying their relative sensitivity to external shocks, with a particular emphasis on geopolitical risk. Among the various exogenous forces influencing markets, geopolitical tensions have emerged as potent volatility drivers. Events such as terrorism and international conflicts carry substantial implications for asset price dynamics. The conflicts between Russia and Ukraine since February 2022, as well as persistent unrest in the Middle East, have exemplified significant market disruptions arising from geopolitical instability. The Global Financial Stability Report (GFSR) dated April 2025 identifies two principal transmission mechanisms through which geopolitical risk affects asset volatility, namely the economic and market sentiment channels. According to the GFSR, prices of key commodities including safe haven assets typically rise in response to geopolitical shocks, while US Treasury yields tend to fall, reflecting a flight-to-safety response. Prior studies, including those by Apergis et al. (2017) and Gkillas et al. (2018), corroborate the predictive value of geopolitical risk indicators in explaining volatility patterns. Building upon these insights, the present study incorporates geopolitical risk into asset volatility forecasting models by employing the news-based Geopolitical Risk Index (GPR) developed by Caldara and Iacoviello (2022). The analysis focuses on four widely recognised safe haven assets – gold, silver, crude oil and US Treasury securities. Against this backdrop, the study addresses three key questions: how safe haven assets respond to geopolitical risk, whether nonlinear neural-network models provide superior volatility forecasts compared with linear econometric benchmarks and how sensitive each asset is to escalating geopolitical tensions. In brief, the study finds that gold remains the most stable asset, crude oil exhibits pronounced sensitivity, silver and US Treasuries display intermediate behaviour and neural-network models consistently outperform traditional approaches. These results demonstrate that safe haven assets exhibit heterogeneous volatility responses and that incorporating geopolitical risk within nonlinear frameworks significantly enhances forecast accuracy. Furthermore, the study simulates the dynamic responses of these assets to escalating levels of geopolitical risk, highlighting their relative sensitivity to such shocks. By doing so, the study contributes a practical framework that enables investors to evaluate and select safe haven assets tailored to their risk preferences and investment objectives. The remainder of this paper is organised as follows. Section II provides a historical overview of safe haven assets and discusses key stylised facts pertaining to their behaviour. Section III surveys the relevant literature. Section IV outlines the data employed in the analysis. Section V describes the methodological framework and presents the empirical findings. Section VI concludes the study. II. Historical Overview and Stylised Facts on Safe Haven Assets In this section, we trace the historical development of safe haven assets and highlight the stylised facts that underscore their behaviour through recent geopolitical crises. Historical Overview of Safe Haven Assets The concept of safe haven assets has evolved significantly over time, with gold, silver, crude oil and US Treasury securities emerging as primary instruments sought during episodes of economic or geopolitical turbulence for their stability and low risk characteristics. Among these, gold and silver have served as mediums of exchange and store of value across ancient and modern civilisations, prized for their intrinsic worth, scarcity and durability. As financial systems matured, early instruments such as goldsmith-issued bills of exchange gradually gave way to more sophisticated forms of credit and government-backed securities. The industrial revolution and the expansion of global trade further heightened the need for assets that could preserve value and ensure liquidity in times of stress. During periods of systemic disruption such as the World War I and the 1929 stock market crash, gold and sovereign bonds played a critical role in maintaining market confidence and financial stability. Crude oil, although not traditionally viewed as a monetary safe haven, rose to strategic importance during the 20th century. The World War I – marked a turning point, as oil became indispensable to military logistics and industrial production, thereby elevating its economic status. In the 1970s, a series of geopolitical shocks, particularly conflicts in the Middle East, disrupted global oil supplies, leading to dramatic price spikes and cementing oil’s role as a crisis responsive commodity. This behavioural pattern among investors persists today, as evidenced by sharp surges in crude oil prices during the Russia - Ukraine conflict in 2022. The 21st century has been characterised by recurring financial crises and escalating geopolitical instability, reinforcing the relevance of safe haven assets in both institutional and retail investment portfolios. Events such as the GFC and recent military conflicts in the Middle East have led to pronounced increase in the value of traditional safe haven assets, notably gold, silver and crude oil. Central banks and sovereign institutions continue to hold these assets as part of their risk management and macroprudential frameworks, while individual investors seek them to hedge against uncertainty and systemic shocks. As market volatility becomes an enduring feature of the global financial landscape, the identification and comparative evaluation of effective safe haven assets have become critical components of strategic asset allocation and portfolio resilience. Stylised Facts on Safe Haven Assets Safe haven assets preserve or increase in value during episodes of financial instability and geopolitical unrest. They are typically liquid, low risk and sought after in times of crisis. Historical price trajectories and volatility responses reveal several key stylised facts that underscore their distinct behaviours under stress. Price Dynamics of Safe Haven Assets Gold continues to serve as the archetypal safe haven asset. Its long run price trend reveals strong upward momentum with sharp surges during the early 1980s, the GFC and the Covid-19 pandemic (Chart 1). The recent rally in 2022-25 further reflects investors’ response to systematic uncertainty and global tensions. Gold’s reputation as a hedge against inflation and a store of value makes it attractive to central banks and institutional investors. Silver, although more volatile, shares many of gold’s safe haven characteristics. As seen in Chart 2, silver experienced dramatic spikes during the 1980 Hunt Brothers crisis, the 2010-11 commodity boom and periods of pandemic-related supply disruptions. Its industrial utility, especially in renewable energy, adds a demand channel that amplifies its price volatility during geopolitical shocks.
Crude oil reflects a different behavioural pattern. It is highly sensitive to global supply chains, making it more vulnerable to geopolitical disruptions than demand side contractions. Sharp volatility around the Gulf War, the GFC, and the Russia-Ukraine conflict is clearly visible (Chart 3). While not a conventional safe haven, crude oil is often used to hedge inflationary risk stemming from supply shocks. US Treasury securities (10 year treasury bill) conversely, exhibit classic countercyclical safe haven properties. Their yields have trended downward over the long term, with steep declines during major crises, reflecting heightened demand amid flight-to-safety behaviour (Chart 4). Their deep liquidity and sovereign backing make them the most widely accepted risk free asset. Volatility Response to Geopolitical Events Geopolitical shocks frequently lead to sharp increases in asset price volatility. This is evident in the ratio of the coefficient of variation (CV) of asset prices during major geopolitical events relative to the pre-event period, where a ratio above 1 denotes heightened volatility (Chart 5). The results highlight distinct patterns across events and asset classes. The GFC triggered a broad based surge in volatility, with silver experiencing the most pronounced increase. Events such as the Gulf War and the Russia-Ukraine conflict disproportionately affected crude oil, reflecting heightened supply side risk and geopolitical sanctions. 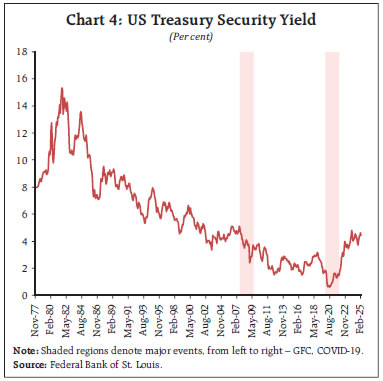
 Meanwhile, the Israel-Gaza conflict produced significant spikes in the CV of gold and silver, suggesting, in particular, their sensitive to instability in Middle East. In contrast, US Treasuries showed the most pronounced volatility response during the Tiananmen Square protests and the Arab Spring, indicating their exposure to global sentiment and shifts in risk appetite. These findings underscore how different safe haven assets respond uniquely to the nature and geography of geopolitical events. Conditional Volatility from GARCH Models To further assess asset responses to geopolitical shocks, we estimate monthly conditional volatilities using GARCH models for recent high impact events (Table 1). Conditional volatility, a forward looking metric, captures how markets anticipate future fluctuations based on past variability. The results reveal sharp spikes in volatility for most assets’ price, with crude oil and US Treasuries exhibiting over threefold increases during the Russia-Ukraine conflict, reflecting heightened uncertainty surrounding energy supply and safe asset demand. Silver also registered significant amplification in volatility across three analysed events, due to its dual role as a hedging instrument and industrial input. | Table 1: Conditional Volatility during Geopolitical Events | | Event | Asset | Conditional Volatility | | Minimum | Maximum | | | Crude oil | 0.008 | 0.026 | | | Gold | 0.001 | 0.001 | | Russia Ukraine conflict | Silver | 0.003 | 0.007 | | | US Treasury security | 0.008 | 0.028 | | | Crude oil | 0.003 | 0.008 | | | Gold | 0.001 | 0.002 | | Israel Gaza conflict | Silver | 0.002 | 0.006 | | | US Treasury security | 0.003 | 0.008 | | | Crude oil | 0.002 | 0.007 | | | Gold | 0.001 | 0.002 | | US Election | Silver | 0.002 | 0.006 | | | US Treasury security | 0.002 | 0.005 | | Source: Authors' Calculations. | In contrast, gold demonstrated remarkable stability, with only modest increases in conditional volatility even during acute geopolitical stress. This subdued reaction reinforces gold’s reputation as a reliable safe haven, offering consistency- when other asset classes are more reactive. These differentiated volatility responses highlight the importance of asset specific characteristics in risk management and portfolio construction during a crisis. III. Reviewed Literature The complex and evolving relationship between geopolitical risk and the price volatility of safe haven assets is well documented in the recent literature. Gupta et al. (2024) show that incorporating country specific geopolitical risk (GPR) data into machine learning models significantly improves forecasts of gold price volatility. Similarly, Gkillas et al. (2018) examine the nonlinear influence of geopolitical uncertainty on volatility spikes in the Dow Jones Industrial Average, finding that the persistence and magnitude of these shocks vary by event and time horizon. Building on these insights, this study employs artificial neural networks (ANNs) to flexibly capture such nonlinear dynamics. The oil market shows particular sensitivity to geopolitical tensions. Liu et al. (2020) quantify the impact of extreme geopolitical events on oil prices, underscoring the need for robust risk mitigation. Jiao et al. (2021) identify supply side disruptions and political instability as the main channels through which geopolitical risk affects oil market dynamics. These findings highlight the need to systematically assess how safe haven assets respond to geopolitical developments. Kundu et al. (2023) examine the price dynamics of gold in the Indian context. The authors establish that volatility of returns for gold declines during heightened period of risk. In such periods, risk tolerance reduces among investors and a flight to safe haven commodity like gold is generally observed. IV. Data Whereas earlier studies often focused on individual assets using traditional econometric models, this paper applies a comparative framework across multiple safe haven assets using neural networks. Asset price volatility under evolving geopolitical conditions is analysed, capturing intricate, nonlinear relationships with improved accuracy. Unlike Gupta et al. (2024), who use both aggregate and all country level geopolitical risk (GPR) indices, the approach followed in this paper relies on relevant country specific GPR data aligned with each asset’s supply-demand structure. A simulation analysis is used to evaluate volatility responses to geopolitical shocks. This integrated framework supports forward looking, evidence-based decision making by investors and policymakers navigating a climate of protracted geopolitical uncertainty. To capture geopolitical uncertainty, the GPR developed by Caldara and Iacoviello (2022) is employed. This index quantifies both global and country specific geopolitical risks using newspaper based metrics at a monthly frequency. The methodology identifies the frequency and context of geopolitical terms in major news publications, measuring both the intensity and salience of geopolitical tensions. Notably, the country specific GPR covers 44 countries across multiple regions, enabling a nuanced understanding of how geopolitics affect asset level volatility. This refined measure enhances our ability to assess the transmission of geopolitical risk across diverse financial markets. Four safe haven assets – gold, silver, crude oil and US Treasury securities are considered for the analysis. Gold prices on a monthly frequency (USD per troy ounce), are obtained from the World Gold Council. Silver prices (USD per troy ounce) and crude oil prices (USD per barrel) are sourced from the World Bank’s Pink Sheet database. US Treasury yields, specifically the 10-year constant maturity yields, are retrieved from the Federal Reserve Bank of St. Louis and converted into monthly averages. The empirical analysis covers the period from January 1978 to February 2025. The selection of 1978 as the starting point is motivated by both historical context and data stability. It immediately precedes major geopolitical disruptions such as the Iranian Revolution and the Soviet invasion of Afghanistan in 1979, allowing the model to capture asset behaviour before and after these shocks. Furthermore, this date lies sufficiently beyond the collapse of the Bretton Woods system (1971) and the OPEC oil embargo (1973), by which time commodity and financial markets had largely adjusted to the new regime of flexible exchange rates and market-driven pricing. Starting in 1978 thus ensures a long, stable sample that reflects mature post–Bretton Woods dynamics and historically significant levels of safe-asset valuation. For robustness, three recursive sub-samples are constructed, each beginning in January 1978. The first sample ends in September 2021, while the second and third samples expand sequentially by 12 month intervals. For each sample, we generate 12 months ahead forecasts of asset price volatility, which are benchmarked against volatility estimates from a GARCH (1,1) model. This recursive forecast structure enables a rigorous evaluation of model performance under changing geopolitical conditions. V. Methodology and Results This section establishes the methodological framework of the study and presents the findings from the study. Methodology The methodological framework, consisting of GARCH-based conditional volatility estimation, neural-network and econometric forecasting models and a structured simulation of geopolitical risk scenarios, is designed to directly answer the research questions posed in the Introduction. This study estimates conditional volatility for each safe haven asset using a GARCH (1,1) model. The resulting conditional volatility series serves as the target variable for forecasting. Detailed volatility estimates and model diagnostics are provided in the Annexure. Conditional volatility is preferred over realised volatility in this context, as it is better suited for monthly frequency data and effectively captures the time-varying and persistent nature of financial market volatility. Two separate forecasting frameworks are considered: (i) forecasting volatility using the past values of the volatility series; and (ii) framework 1 augmented by a set of exogenous variables. For these two cases, the traditional econometric benchmarks are first established - an autoregressive (AR) model for the univariate case and an autoregressive integrated moving average with exogenous variables (ARIMAX) model for the multivariate case. Subsequently, the nonlinear autoregressive (NAR) and nonlinear autoregressive with exogenous inputs (NARX) models are implemented for the respective forecasting scenarios. These models are advanced forms of Artificial Neural Networks (ANNs), well suited for capturing nonlinear and dynamic patterns in time series data.1 The Nonlinear Autoregressive (NAR) model, whose foundations were introduced by Narendra and Parthasarathy (1990), extends artificial neural networks (ANNs) to time series forecasting by capturing nonlinear dependencies that traditional linear models fail to account for. It models future values as a nonlinear function of past observations: Building on the NAR framework, the NARX model enhances forecasting accuracy by incorporating external predictors. It estimates volatility as a function of both lagged values of the volatility series and lagged values of exogenous variables specifically, country specific geopolitical risk indices (GPR):  These models are selected for their ability to model complex, nonlinear interactions and to effectively handle high dimensional data, making them well suited for capturing the dynamics of geopolitical shocks in financial markets. For the NARX model, asset specific set of exogenous variables drawn from country specific GPR indices is constructed, as outlined in Table 2. Countries are selected based on their significance in the global supply and demand chain of the respective asset, and from this set, only those for which GPR data is available are included in the empirical framework. The GPR specific to United States is included as an exogenous variable for all four assets; due to its dominant role in the global market. | Table 2: Exogenous Variables for NARX Model | | Asset | Variables | | Gold | GPR specific to US, China & Russia | | Silver | GPR specific to US, China, India & Japan | | Crude oil | GPR specific to Egypt, Israel, Russia, US & China | | US Treasury security | GPR specific to China, US; GPR index, GPR Threat index and GPR Act index | The NARX model is trained on the latest recursive sample, comprising data from January 1978 to September 2023, and is used to forecast monthly volatility up to March 2025 in a recursive manner. Starting in October 2023, a one-step-ahead forecast is generated, the predicted volatility is put back into the model and the country specific GPR inputs are updated at each step to produce the next forecast. To assess each asset’s sensitivity to geopolitical risk, a simulation exercise is conducted by varying the US specific GPR index across four scenarios – low, medium, high and extreme – based on the historical distribution of risk. The first three correspond to observed levels of geopolitical stress, while the extreme scenario simulates unobserved risk conditions. This is operationalised by inflating the historical median and maximum of the US specific GPR by 50 per cent, then randomly drawing GPR values within this inflated range to generate a synthetic extreme scenario. This simulation enables the evaluation of how volatility in each asset responds to escalating geopolitical tensions. The results offer valuable insights for market participants and policymakers, supporting the selection of appropriate safe haven assets in alignment with individual risk tolerance and investment strategies. Results This section presents the results of the forecasting models and the simulation exercise assessing the sensitivity of safe haven assets to geopolitical risk. It begins with conditional volatility estimates from the fitted GARCH models, which form the foundation for both forecasting and simulation. Asset specific volatilities are shown in Charts 6 to 9. Gold exhibits episodic volatility spikes during major crises such as the Asian Financial Crisis (1997-98), the GFC and the Covid-19 pandemic (2020-21). Despite these episodes, its overall volatility remains moderate, reaffirming gold’s role as a stable hedge (Chart 6). Silver, by contrast, displays a more erratic pattern, with sharper and more frequent spikes; particularly in the early 1980s, post-2008, and during the European debt crisis, reflecting its dual nature as both a precious and an industrial metal (Chart 7). Crude oil shows the most pronounced volatility, with peaks during the 1986 price collapse, the Gulf War, the GFC and the Russia-Ukraine conflict, driven by geopolitical tensions, supply disruptions and OPEC decisions (Chart 8). US Treasury yields, though typically stable, exhibit noticeable spikes during the GFC, the 2013 taper tantrum and the 2020 pandemic, reflecting shifts in global risk sentiment and expectations around monetary policy (Chart 9). Overall, the analysis confirms that volatility dynamics are asset specific, shaped by both structural traits and external shocks. These GARCH based series provide the foundation for evaluating forecast models, linear (AR, ARIMAX) and nonlinear (NAR, NARX), as well as the geopolitical sensitivity simulations discussed in the next section. Volatility Forecasts To evaluate model effectiveness, Root Mean Squared Errors (RMSE) of each model are compared using a relative performance metric:
A positive value indicates Model A outperforms Model B, while a negative value implies the opposite. The results confirm the predictive strength of neural networks over traditional benchmarks (Table 3). Additionally, the forecasted volatilities are compared from the NARX model (trained on data from January 1978 to September 2023) with actual volatilities up to February 2025 (Chart 10). A key observation is the consistent outperformance of neural networks. Except for one instance involving gold, the NAR model performs better than the AR model across most assets and samples, reflecting its strength in capturing complex, nonlinear relationships (Chart 10). Similarly, the NARX model consistently surpasses ARIMAX, even though both use the same set of exogenous variables. This shows that neural networks can better learn and exploit the lagged and nonlinear effects of geopolitical risk compared with traditional econometric approaches. 

| Table 3: Comparison of Model Performance Comparison Metric | | Sample | Asset | NAR vs AR | NARX vs ARIMAX | | January 1978 - September 2021 | Gold | 0.27 | 0.88 | | Silver | 0.76 | 0.65 | | Crude oil | 0.28 | 0.39 | | US Treasury security | 0.34 | 0.37 | | January 1978 - September 2022 | Gold | 0.48 | 0.90 | | Silver | 0.39 | 0.67 | | Crude oil | 0.55 | 0.81 | | US Treasury security | 0.19 | 0.65 | | January 1978 - September 2023 | Gold | -0.18 | 0.64 | | Silver | 0.71 | 0.76 | | Crude oil | 0.70 | 0.85 | | US Treasury security | 0.33 | 0.75 | Notes: 1. For each pairing of sample and asset, four models are built.
2. For the comparison metrics, in the first column NAR (Model A) is compared with AR (Model B).
3. For the comparison metrics, in the second column NARX (Model A) is compared with ARIMAX (Model B).
Source: Authors’ calculations. | The improvement is especially notable when moving from ARIMAX to NARX , underscoring the added predictive value of GPR data when used within a neural framework. Together, these results highlight the effectiveness of neural networks in improving forecast accuracy and integrating geopolitical signals, offering practical value to policymakers, investors, and risk managers operating in uncertain macrofinancial conditions. The deviation in silver price volatility highlights the diverse behaviour of safe assets under changing geopolitical conditions. Unlike crude oil, and US Treasuries, which respond more predictably to geopolitical shocks, silver’s volatility reflects its dual role as both a safe-haven and an industrial metal. Its sensitivity to industrial demand and macroeconomic cycles leads to regime shifts that linear models often miss. This reinforces that safe-haven assets do not react uniformly to global risks, and adaptive nonlinear models like neural networks are better suited to capture and forecast such complex, assetspecific dynamics. Volatility Simulation Each asset responds differently to changes in geopolitical risk. To quantify this responsiveness, we compute a sensitivity metric that captures how volatility changes in response to variations in the GPR. Using the NARX model developed in the forecasting stage, asset volatilities across five GPR levels are simulated. These levels are – observed, low, medium, high, and extreme (Chart 11). The sensitivity metric is calculated as: where, n is the number of risk levels, VOLi represents the volatility forecast from the simulation at ith risk level, and avg_GPRi denotes the average of the GPR index specific to US from the simulation at ith risk level over all the lags as required by the model for each asset. Based on this metric, gold exhibits the lowest sensitivity to GPR changes. Using gold as the base, we derive a relative sensitivity index for all assets (Table 4), where higher values indicate greater responsiveness to geopolitical stress. Among the assets, crude oil emerges as most sensitive to geopolitical shocks. Its price volatility rises sharply with increased GPR, reflecting exposure to supply disruptions, regional conflicts and sanctions, highlighting its vulnerability to geopolitical instability. In contrast, gold shows minimal sensitivity, reaffirming its role as a safe haven. Investors often shift to gold during global uncertainty, which stabilises its volatility across risk regimes and supports its continued use in hedging strategies during crises.
| Table 4: Relative Sensitivity of Assets under Simulation for March 2025 (Relative to Gold) | | Asset | Relative Sensitivity | | Gold | 1.00 | | Silver | 1.92 | | US Treasury security | 2.31 | | Crude oil | 10.92 | | Source: Authors’ calculations. | Silver exhibits intermediate sensitivity. As both a precious metal and an industrial input, its volatility responds to investor sentiment and geopolitical effects on industrial demand, placing its sensitivity between gold and crude oil. In contrast, US Treasury securities show a steady rise in volatility as geopolitical risk increases2. This reflects flight to safety behaviour, where demand driven price changes lower yields but generate moderate market volatility due to shifting capital flows. Overall, the simulation results reveal clear heterogeneity in the response of safe haven assets to geopolitical risk. Crude oil is highly reactive, gold remains stable, while silver and Treasuries occupy intermediate positions. These findings offer valuable guidance for portfolio diversification, risk management and policy formulation amid growing geopolitical uncertainty. VI. Conclusion This study highlights the complex relationship between geopolitical risk and the volatility of safe haven assets, providing actionable insights for risk managers, policymakers and investors. Using a simulation-based sensitivity framework, the response of four major asset class – gold, silver, crude oil and US Treasury securities – to escalating geopolitical tensions is analysed. The results offer a clearer understanding of asset behaviour under episodes of uncertainty and summarise the key results emerging from the analysis. The findings show that crude oil is most sensitive to geopolitical shocks, consistent with its exposure to supply disruptions and regional conflicts. In contrast, gold remains the most stable, reaffirming its traditional role as a safe haven asset. Silver lies in between; more volatile than gold due to industrial demand exposure, but less sensitive than oil. US Treasury securities exhibit a steady rise in volatility with increasing geopolitical risk, reflecting their role as a flight-to-safety asset during global stress and confirming the heterogenous volatility response across assets. Importantly, the study also demonstrates the forecasting superiority of neural network models, particularly the nonlinear neural network architecture. The empirical assessment highlights the nonlinear, time dependent effects of geopolitical risk on asset price volatility. By incorporating country specific geopolitical risk indices, the nonlinear autoregressive neural network model with exogenous inputs consistently outperforms traditional econometric benchmarks, thus offering a more reliable tool for volatility forecasting in volatile macro-financial conditions and reinforcing the central result that nonlinear approaches outperform linear models in geopolitical stress environments.
Annexure This section provides additional details on the volatility estimation methodology. Volatility estimates from GARCH Monthly log returns on asset prices (or yields) are used to estimate conditional volatility via GARCH models. ACF/PACF plots guide lag selection, while ADF, KPSS, and Engle’s ARCH tests confirm stationarity and heteroscedasticity (Table 5). Final GARCH model parameters for each asset are reported in Table 6. | Table 5: Statistical Tests | | Asset | Test | Test Statistic | P-Value | Result | | Gold | ADF | -12.83 | 0.001 | Stationary | | KPSS | 0.17 | 0.100 | Stationary | | Engle’s ARCH | 20.06 | 0.000 | Conditional | | | | | Heteroscedasticity | | Silver | ADF | -13.06 | 0.001 | Stationary | | KPSS | 0.07 | 0.100 | Stationary | | Engle’s ARCH | 65.83 | 0.000 | Conditional | | | | | Heteroscedasticity | | Crude oil | ADF | -12.88 | 0.001 | Stationary | | KPSS | 0.04 | 0.100 | Stationary | | Engle’s ARCH | 84.68 | 0.000 | Conditional | | | | | Heteroscedasticity | | US Treasurysecurity | ADF | -12.00 | 0.001 | Stationary | | KPSS | 0.07 | 0.100 | Stationary | | Engle’s ARCH | 31.18 | 0.000 | Conditional | | | | | Heteroscedasticity | Note: Significance level of all tests are 5 Per cent.
Source: Authors’ calculations. |
| Table 6: Parameter Estimates from GARCH Models | | Asset | Parameter | Value | Standard Error | t Statistic | P-Value | | Gold | Constant | 0.00008 | 0.000023 | 3.6358 | 0.00028 | | GARCH{1} | 0.80708 | 0.027795 | 29.037 | 0.00000 | | ARCH{1} | 0.15318 | 0.022013 | 6.9588 | 0.00000 | | Silver | Constant | 0.00038 | 0.000091 | 4.1533 | 0.00003 | | GARCH{1} | 0.73466 | 0.045191 | 16.2569 | 0.00000 | | ARCH{1} | 0.21311 | 0.044073 | 4.8355 | 0.00000 | | Crude oil | Constant | 0.00088 | 0.000195 | 4.4927 | 0.00001 | | GARCH{1} | 0.49786 | 0.040391 | 12.3259 | 0.00000 | | ARCH{1} | 0.50214 | 0.049362 | 10.1727 | 0.00000 | | US Treasury security | Constant | 0.00021 | 0.000058 | 3.6589 | 0.00025 | | GARCH{1} | 0.70876 | 0.032924 | 21.527 | 0.00000 | | ARCH{1} | 0.29124 | 0.030584 | 9.5223 | 0.00000 | | Source: Authors’ calculations |
Reference Apergis, N., Bonato, M., Gupta, R., & Kyei, C. (2017). Does geopolitical risks predict stock returns and volatility of leading defense companies? Evidence from a nonparametric approach. Defence and Peace Economics, 28(5), 542–554. Baur, D. G., & Smales, L. A. (2020). Hedging geopolitical risk with precious metals. Journal of Banking & Finance, 112, 105217. Caldara, D., & Iacoviello, M. (2022). Measuring geopolitical risk. American Economic Review, 112 (4), 1194–1225. Gkillas, K., Gupta, R., & Wohar, M. E. (2018). Volatility jumps: The role of geopolitical risks. Finance Research Letters, 24, 1–7. Gupta, R., Karmakar, S., & Pierdzioch, C. (2024). Safe havens, machine learning, and the sources of geopolitical risk: A forecasting analysis using over a century of data. Journal of International Money and Finance, 126, 102653. International Monetary Fund. (2025). Geopolitical risks, implications for asset prices and financial stability. In Global financial stability report, April 2025 (Chapter 2). International Monetary Fund Jiao, J.-W., Yin, J.-P., Xu, P.-F., Zhang, J., & Liu, Y. (2021). Transmission mechanisms of geopolitical risks to the crude oil market: A pioneering two-stage geopolitical risk analysis approach. Energy, 223, 120063. Kundu, S., Dilip, A (2023). Changing Risk Appetite and Price Dynamics of Gold Vis-a-Vis Real and Financial Assets: Perspective from the Indian Market. J. Quant. Econ. 21, 899–923. Liu, J., Ma, F., Tang, Y., & Zhang, Y. (2020). Geopolitical risk and oil volatility: A new insight. Energy Economics, 92, 104934. Narendra, K. S., & Parthasarathy, K. (1990). Identification and control of dynamical systems using neural networks. IEEE Transactions on Neural Networks, 1(1), 4–27. Zhang, Y., He, J., He, M., & Li, S. (2022). Geopolitical risk and stock market volatility: A global perspective. Global Finance Journal, 54, 100639.
|