by Snigdha Yogindran, Sukti Khandekar, Rajesh Kavediya and Kamal Gupta^ India’s private corporate sector showed a strong post-COVID recovery, led by manufacturing and non-IT services companies. Despite pandemic-related stress, large firms sustained high profitability, while medium and small firms enhanced their debt servicing. This article analyses trends using financial data of listed non-government non-financial companies. Operating profit margins remained stable, supported by efficient cost control. Balance sheet analysis indicates deleveraging, with financial improvement among vulnerable manufacturing firms. The study underscores the sector’s resilience and adaptability, with large firms driving earnings and smaller ones improving financial stability— signalling a stronger, more balanced corporate landscape in the aftermath of the pandemic. Introduction India’s corporate sector faced multiple economic shocks, from COVID-19 to geopolitical tensions. Despite challenges, it adapted swiftly, ensuring business continuity and economic recovery. The global economy has faced several major disruptions over the past few years, including the COVID-19 pandemic, geopolitical tensions, and rapid synchronised monetary policy tightening. These events have tested economic resilience worldwide, and India was no exception. Economies across the world have experiences many crises in the past, however, the COVID-19 pandemic induced shock was very intense due its widespread impact on both private and public segments of the economy (Mather, 2020; Kells, 2020). The pandemic caused an economic downturn of historic proportions, leading to a 3.0 per cent decline in global GDP in 2020 (IMF, 2022). Governments worldwide implemented lockdowns, travel restrictions, and social distancing measures to curb the spread of the virus, further straining economies. The crisis was exacerbated by the Russia-Ukraine war, which disrupted supply chains and fuelled inflation. India’s economy also suffered a significant setback, with GDP contracting by 23.8 per cent in Q1:2020-21, one of the steepest declines in the history. The corporate sector, especially contact-intensive industries, faced severe disruptions due to restrictions on movement and operations. Sales of private manufacturing and non-IT services sectors contracted sharply by 41 per cent in Q1:2020-21. However, timely policy interventions by the Indian government and the Reserve Bank of India (RBI) facilitated a swift recovery. The RBI undertook various measures numbering more than a hundred in total, some conventional and others out-of-the-box, to address pandemic-induced dislocations and constraints, both system level and also specific to sectors, institutions and financial instruments (Patra, 2022). These includes, inter alia, (i) cumulative reduction in policy repo rate by 250 basis points (bps) with reserve repo rate reduced by 155 bps, (ii) reduction in cash reserve ratio by 100 bps, (iii) increase in bank’s access to liquidity under marginal standing facility from 2 per cent to 3 per cent of net demand and time liabilities (NDTL), which resulted in liquidity enhancement of about ₹1.37 lakh crore, (iv) conduct of long-term repo operations (LTROs) and targeted long-term repo operations (TLTROs) to augment systemic liquidity and lower the banks’ cost of funds, (v) moratorium of three months on term loans and easing of working capital financing, etc. The nuanced and calibrated measures by the RBI and the government and adaptation by businesses and households to working in a pandemic environment resulted in faster recovery than expected. As, the private corporate sector plays a critical role in driving investment, employment, productivity, and overall economic growth, understanding the sector’s response to unprecedented shocks—such as the COVID-19 pandemic, global supply chain disruptions, and subsequent fiscal-monetary measures—is essential for assessing the broader trajectory of economic recovery and financial stability. Against this backdrop, this article is motivated by the need to evaluate how India’s private non-financial corporates adapted to these shocks, and whether the recovery was broad-based and sustainable across sectors and firm sizes. From a macroeconomic standpoint, the findings help assess the corporate sector’s preparedness to support future investment cycles, the evolving risks to financial stability, and the structural shifts in profitability dynamics and cost efficiencies. The article examines the performance of India’s private corporate sector during the COVID-19 pandemic and in the post-pandemic recovery phase across different sectors and firm sizes. The article also explores the role of cost management, policy support, and sector-specific dynamics in sustaining profitability and improving debt serviceability in the aftermath of pandemic shocks. The influence of sales growth on operating profit margin in the Indian manufacturing sector has also been examine under the panel regression framework, and how has this relationship evolved in the post-COVID period. The analysis finds that the corporate sector rebounded quickly and widely with varying speed of recovery. The evidence indicates that while large firms led the rebound in profitability, medium and small firms recorded notable improvement in debt serviceability and operational efficiency, pointing to a more balanced corporate landscape. From a macroeconomic perspective, the sector’s improved balance sheet position it as an important contributor to India’s medium-term growth momentum, while also reducing systemic vulnerabilities in the financial system. II. Corporate Performance: COVID-19 Impact and Recovery The pandemic led to a sharp decline in sales and profitability of corporates, but policy support and resilient strategies fuelled a strong comeback. The corporate sector’s ability to adapt was a key to its revival. India’s private corporate sector has experienced significant shifts in performance between the pre-COVID and post-COVID periods1, reflecting underlying dynamics of economic conditions. II.1 Sales Performance: Rebuilding Momentum – Corporate Sales Surge Post-Pandemic Sales rebounded sharply post-pandemic, peaking at 32.5 per cent growth in 2021-22 before stabilising. Non-IT services and manufacturing led the recovery, while IT sector growth remained steady. During pre-COVID period, the listed private non-financial corporates, at aggregate level, enjoyed steady growth before 2019-20, driven by robust consumption demand, favourable economic policies, and stable macroeconomic conditions. Sales growth showed a steady increase from 3.1 per cent in 2016-17 to 14 per cent in 2018-19, aligning with steady increase in commodity prices. This steady growth in sales is also characterized in manufacturing and non- IT service sector (Chart 1 and Annex Table A1, A2). However, during 2019-20, due to weak domestic and external demand, sales of listed NGNF companies contracted, mainly dragged by subdued performance of manufacturing companies. The onset of COVID-192 brought unprecedented challenges, including localised and regional lockdowns, supply chain disruptions, changes in consumer behaviour, and operational hurdles. The overall performance of corporate sector worsened further with continued contraction in sales of manufacturing sector and set backing non-IT services sector. The contact-intensive services sector was impacted severely due to pandemic with sales contracting by 14.6 per cent in 2020-21. 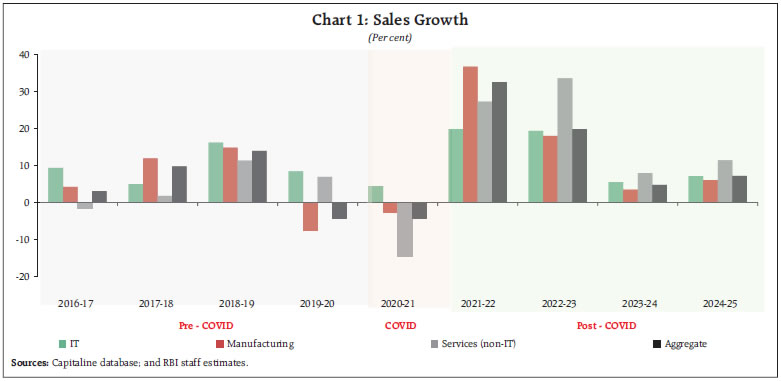 With the fiscal-monetary policy induced support, post-pandemic pent-up demand, and improved consumer confidence, corporate sector witnessed a remarkable recovery, with aggregate nominal sales growth peaking at 32.5 per cent during 2021-22, partly due to favourable base effect. Aggregate sales growth moderated to 19.8 per cent in the subsequent year. Post-COVID, all the major sectors rebounded strongly, with non-IT service sector showing the highest growth, followed by manufacturing and IT sectors, reflecting a broad-based recovery and increased economic activity across the board. However, with the fading of pent-up demand and normalisation of activities and ebbing of commodity prices, corporate sales growth moderated significantly to 4.7 per cent during 2023-24 over the high base growth. Momentum remained upbeat during 2024-25 with aggregate sales growth improving to 7.2 per cent, led by improvement in all the major sectors. II.2 Spending Smart: How Companies Managed Costs for Survival and Growth Companies managed costs effectively during the downturn, with lower raw material and staff costs helping offset losses. Post-pandemic, expenses surged in line with the pick-up in sales growth and reversal in commodity prices. Expense growth of listed NGNF companies broadly tracks the sales growth across the major sector as well as at aggregate level. During COVID, the expenditure at aggregate level contracted at a higher pace compared to sales, mainly due to contraction in raw material costs, along with significant moderation in staff costs growth. Contraction in expenditure is primarily contributed by manufacturing and non-IT services companies. In contrast, total expenses of IT companies exhibited positive growth, although at a slower pace, driven by healthy growth in staff cost, with staff cost to sales ratio remaining slightly lower than 50 per cent. As the economic activities gained traction during post-COVID period, in tandem with the sharp recovery in the corporates sales, as alluded earlier, and reversal of commodity cycle growth, the raw material cost at aggregate level surged sharply (47.6 per cent in 2021-22) post-COVID. The staff expenses also recorded double digit growth during 2021-22 and 2022-23, after remaining muted during 2020-21. Consequently, total expenditure increased significantly during 2021-22 and 2022-23. However, in subsequent period, with deceleration in raw material cost and staff costs growth, expenses expanded at a modest pace, in tandem with slowdown in sales growth (Chart 2). 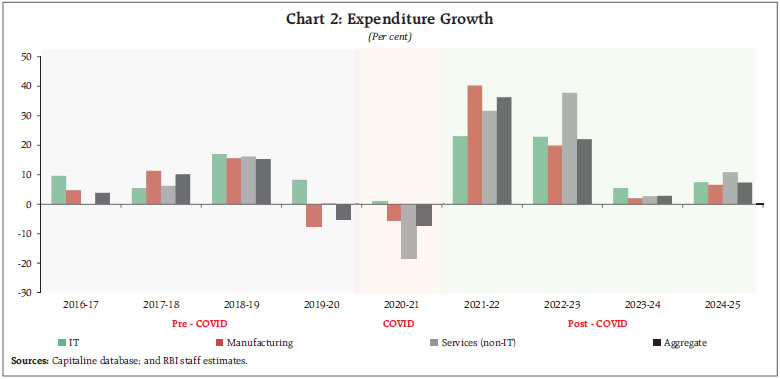 Consequently, on an average, the cost of raw material (CRM) to sales ratio during the post-COVID period remained higher than the pre-COVID levels. On the other hand, the staff cost to sales ratio, which increased during the pandemic, returned back to its pre-COVID levels, on an average (Chart 3). The input costs, as percentage of sales, varied across the sectors. For instance, for manufacturing sector, raw material cost to sales hovered around 50 per cent, while staff cost remained major component of expenditure for the IT companies, with staff cost to sales ratio remained close to 50 per cent. II.3 Turning Challenges into Profits: Corporates’ Financial Resurgence Despite initial setbacks, profitability improved during post-COVID due to effective cost management and demand recovery. Large firms led the way, while smaller firms also strengthened their financial footing. During pre-COVID period, barring the financial year 2019-20, even though high variability seen in net profit growth ((-) 0.3 per cent in 2017-18 to 36.2 per cent in 2018-19) of listed NGNF companies, led by non-operating income , net profit margins showed an increasing trend from 6.5 per cent in 2016-17 to 7.3 per cent in 2018-19, indicating improved efficiency in converting revenue into profit. Consistent growth at aggregate level was predominantly led by relatively stable and improving performance of manufacturing sector. In contrast, the non-IT services sector exhibited swings in net profit growth, due to volatile income from non-operating activities. During 2019-20, significant contraction in net profit at aggregate level, due to weak domestic and global demand, resulted in sharp moderation in net profit margin to 3.1 per cent from 7.3 per cent during the previous year, primarily dragged by non-IT services sector companies (Chart 4 and Annex Table A1, A2). During COVID, despite contraction in sales, decline in raw material cost due to softening of commodity prices, subdued wage growth, along with the favourable base effect, net profit at aggregate level rose sharply by 115.6 per cent. Consequently, net profit margin surpassed its pre-COVID level. During post-COVID period, with sharp rebound in sales growth led by pent-up demand, corporates’ profit increased significantly from Rs. 2.5 trillion in 2020- 21 to Rs. 7.1 trillion during 2024-25. Consequently, net profit margins improved and reached to double digit level in 2024-25, driven by manufacturing sector. While net profit margin of IT sector moderated during post-COVID period due to slowdown in activities coupled with higher salary outgo, net profit margin of non-IT service sector remained into negative zone since COVID before returning into positive territory in 2023-24. 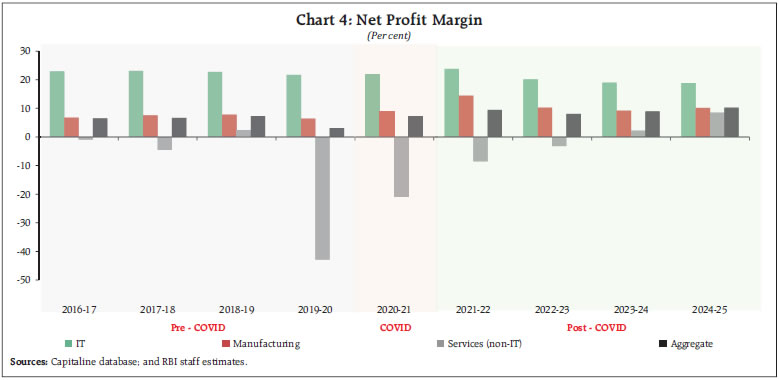
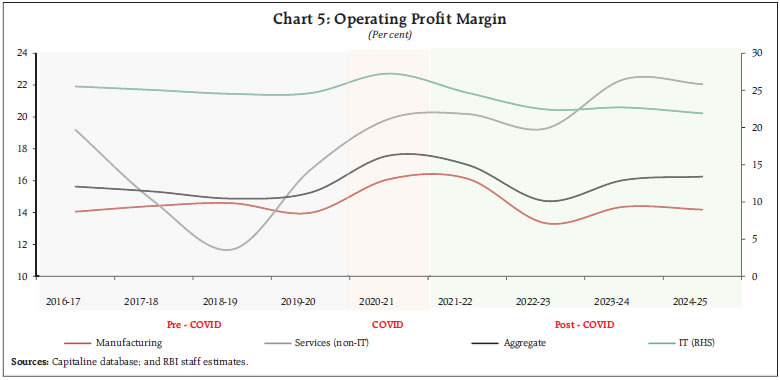 In contrast to the net profit margin, operating profit margin exhibited relatively lower volatility at aggregate level, though operating profit margin of non-IT sector remained volatile – from 19.2 per cent in 2016-17 to the low of 11.7 per cent in 2018-19 and bounced back to a high of 22.4 per cent in 2023-24. At aggregate level, benefiting from the lower input cost, operating profit margin improved by more than 200 bps during COVID period from average margin seen during the pre-COVID period. However, with fading off COVID led pent-up demand and rising commodity prices, corporates were able to pass on the rising input cost partially to their customers, as reflected in moderating operating profit margin during post-COVID period (Chart 5). II.4. Value Added by Private Corporates - Beyond Survival: How Businesses Drove Economic Value in Tough Times Global economy, including India, hit hard by multiple shocks – (i) COVID induced supply chain disruptions and halting of economic activities resulting into loss of output, (ii) Russia-Ukraine war triggering to a worldwide surge in inflation, and (iii) synchronised policy rate hikes by the central banks across economies to curb inflation. COVID-19 pandemic led to disruptions in global economic activity impacting not only the lives but also livelihoods. The Indian industry too faced disruptions in business activity leading to slowdown in its performance. Weak domestic economic activity underpinned by sluggish private consumption led to significant slowdown in nominal gross value added (GVA) of listed NGNF companies to 0.7 per cent growth in 2019-20 from 11.7 per cent in the previous year, which was mainly dragged by contraction (-7.0 per cent) in GVA of listed private manufacturing companies3. As per national accounts statistics, nominal GVA of manufacturing sector contracted by 3.8 per cent during 2019-20. During COVID, various monetary and fiscal supportive policy initiatives helped industries such as ‘Iron and Steel’, ‘Precious and Non-Ferrous Metals’, ‘Pharmaceuticals and Medicines’, ‘Food products and Beverages’, ‘Cement and Cement Products’, and ‘Chemical and chemical products’ to remain resilient. However, within services sector, due to severe slowdown in contact-intensive industries such as ‘Hotel and Restaurant’, ‘Transport and Storage Services’, ‘Hospital Services’ and ‘Real Estate’, their output contracted by 5.3 per cent during 2020-21. In contrast, nominal GVA of IT companies rose by 6.7 per cent during COVID due to adoption of work-from-home culture (Chart 6 and Annex Table A1, A2, A4). 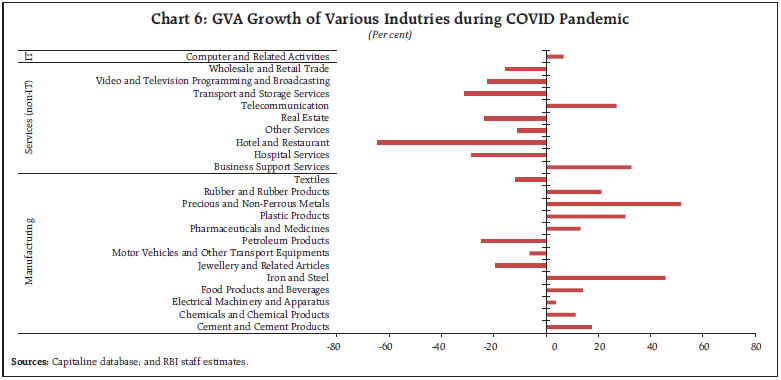 Overall, the Indian corporate sector sailed well through the pandemic recording faster recovery. Post-pandemic, nominal GVA experienced a significant increase in 2021-22, fuelled by improved sales driven by pent-up demand and higher profits. The IT sector saw a considerable rise in GVA, with staff cost growth quadrupling from the previous year. In the non-IT sector, recovery in GVA growth was primarily driven by a lowering of losses. II.5. Industry-wise analysis within Manufacturing Sector - Winners and Laggards: How different sectors fared post-COVID Industries within manufacturing sector recovered at different paces, with industries like ‘Petroleum’ and ‘Motor Vehicles and Other Transport Equipment’ (also called as ‘Automobiles’) bouncing back strongly. However, profit margins varied, reflecting industry-specific challenges. Impact of pandemic and subsequent recovery varied across industries within the manufacturing sector. Manufacturing sales growth was mainly led by industries such as ‘Petroleum Products’, ‘Iron and Steel’, and ‘Motor Vehicles and Other Transport Equipment’, with many industries surpassing the pre-COVID average sales growth. However, operating profit margins showed mixed results—industries like ‘Precious & Non-Ferrous Metals’, ‘Petroleum Products’, and ‘Cement and Cement Products’ saw margins decline compared to pre-pandemic levels (Chart 7). Before COVID, industries such as ‘Iron & Steel’, ‘Petroleum Products’, ’Chemicals and Chemical Products’, and ‘Cement and Cement Products’ outperformed the sector average in both sales growth and profit margins. In contrast, Electrical Machinery, Textiles, and Food Products consistently underperformed. During COVID period, depending upon the underlying demand conditions, pricing power and firms’ specific characteristics, financial performance of industries altered significantly. During post-pandemic period, even though industries such as ‘Petroleum’, and ‘Motor Vehicles and Other Transport Equipment’ recorded higher sales growth, their profit margin remained lower than that of manufacturing sector. In contrast, ‘Pharmaceutical’ industry was able to achieve higher profit margin despite lower sales growth. ‘Food Products’ and ‘Textiles’ remained as a laggard industry (Chart 8). 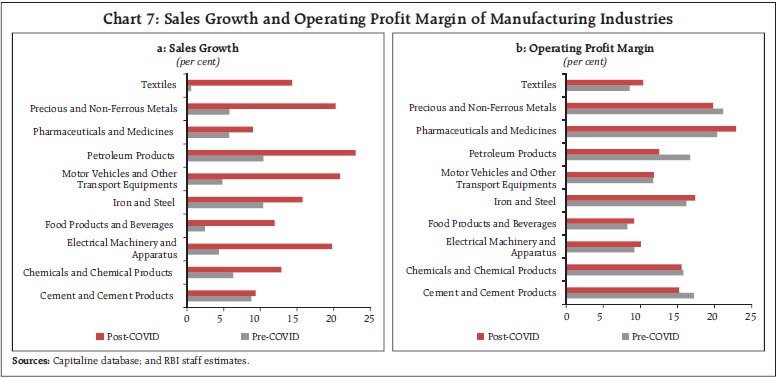 Thus, industry-wise profitability analysis reveals that while some industries were able to achieve higher sales growth along with higher profitability, other industries were able to maintain the sales growth by taking hit on their profit margins. This underlines the importance of firm specific characters that have played role in profitability dynamics since the pandemic. Industry level panel analysis suggests that corporates were able to maintain their profit margin with higher sales growth. Within manufacturing sector, the operating profit margin exhibits a positive relationship with sales growth for listed private corporates. This trend is observed in industries such as ‘Pharmaceuticals and Medicines’, ‘Precious and Non-Ferrous Metals’, ‘Iron and Steel’ and ‘Chemicals and Chemical Products’ (Box 1). 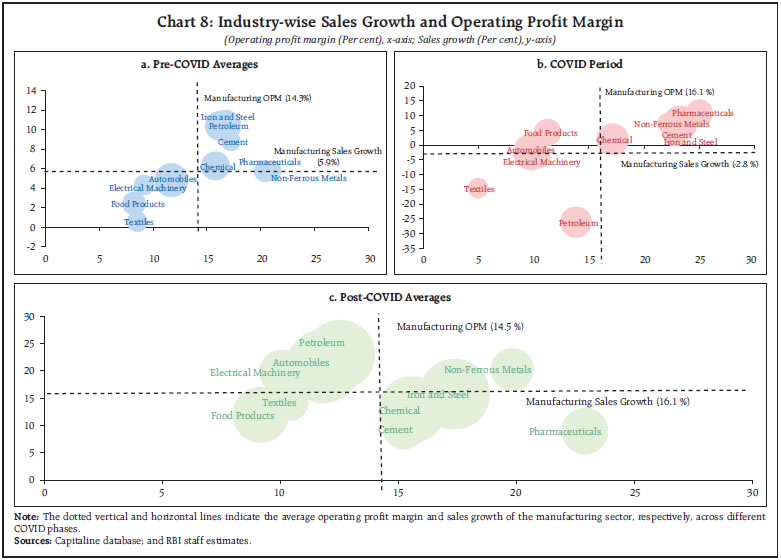
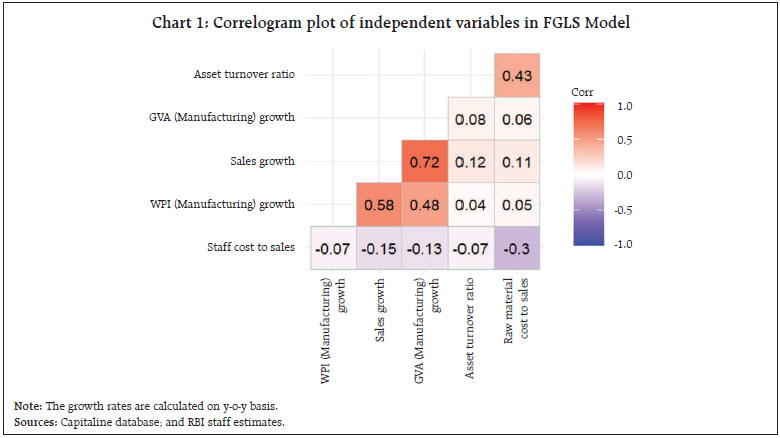
Box 1: Exploring operating profit margin dynamics in the Indian manufacturing sector The trade-off between sales growth and operating profit margin is a critical consideration for businesses striving to balance expansion with profitability. While rapid sales growth can drive market share and revenue, it often requires significant investment in marketing, infrastructure, and product development, which can erode profit margins. Conversely, focusing on maintaining or increasing operating profit margins may necessitate cost-cutting measures or price adjustments that could slow down sales growth. To empirically analyse the relationship between operating profit margin and sales growth, quarterly financial performance data on 11 major industries4 within manufacturing sector consisting of around 1,130 listed private non-financial companies have been used, covering the period from Q1:2018-19 to Q4:2024-25. Balanced panel data framework has been deployed. To control for the industry specific characters, asset turnover ratio (ATR), staff cost to sales ratio, raw material cost to sales ratio were included in the model. Further, to control for overall macroeconomic conditions, manufacturing gross value added (GVA) growth (nominal) and wholesale price index (WPI) manufacturing inflation were used as exogenous variables. The variables used in the analysis are described in the Annex Table A5. While the correlation test shows strong positive partial correlations of sales growth with GVA growth and WPI inflation among the exogenous variables (Annex Chart 1), the variance inflation factor (VIF) analysis confirms that no serious multi-collinearity among the variables. The cross-sectional (CD) dependence test (Pesaran, 2004) points to existence of cross-sectional dependence. Accordingly, a second-generation unit root test developed by (Pesaran, 2007) known as cross-sectional augmented Im, Pesaran, and Shin (CIPS) was performed to avoid spurious results. Lastly, considering the presence of cross-sectional dependence in the data, feasible generalised least square (FGLS) model was employed, which also take into account serial correlation and heteroscedasticity. The FGLS method is a static panel technique applicable for N < T, where N is the number of cross-sections and T is the number of time periods. To address endogeneity, a two-stage least square approach was implemented within framework of FGLS model. Baseline model in which i corresponds to industry in a sample and t refers to the quarter. γi represents industry fixed effects. Model specification was also augmented with COVID related dummy to disentangle the impact of pandemic, which takes value 1 during the periods Q4:2019-20 to Q4:2020-21, and 0 otherwise. Post COVID dummy takes value 1 for the periods Q1:2021-22 to Q4:2024-25 and 0 otherwise. The interaction of sales growth with the post-COVID dummy variable reflects how sales growth have influenced operating profit margins (OPM) during post-pandemic period. The Wald test revealed that the industry-specific effects are jointly significantly influencing the operating profit margin. Empirical findings suggest that sales growth have positive and statistically significant impact on the OPM. This indicates that firms’ high sales growth is typically associated with improvement profitability. However, the coefficient of sales growth interacted with post-COVID dummy is estimated to be negative, possibly indicating that during post-COVID period, corporates sacrifice sales growth to maintain their profitability (Table B1). Estimated coefficient of COVID dummy indicates that OPM experienced rise of 71 bps, at 5 per cent level of significance. The coefficient of ATR shows the perverse sign, however, it remained statistically insignificant. From the expenditure side, as expected, the ratio of raw material cost to sales exhibited negative relationship with OPM. Further, estimated coefficients of macro variables have the expected signs. | Table B1: Impact of Sales Growth on OPM | | Parameters | Coefficient Estimate | Standard Error | z-value | | Sales growth | 0.11 | 0.01 | 10.84*** | | Asset turnover ratio | -0.03 | 0.03 | -1.06 | | Staff cost to sales ratio | 0.63 | 0.35 | 1.82* | | Cost of raw material to sales ratio | -0.13 | 0.05 | -2.43** | | WPI manufacturing inflation | -0.05 | 0.03 | -1.44 | | GVA manufacturing growth | 0.02 | 0.01 | 1.67* | | COVID dummy variable | 0.71 | 0.36 | 1.97** | | Sales growth (y-o-y)* Post COVID Dummy | -0.09 | 0.01 | -9.50*** | | Constant | 17.81 | 3.84 | 4.64*** | ***p<0.01, **p<0.05, *p<0.1
Sources: Capitaline database; and RBI staff estimates. | References: 1. Pesaran, Hashem. (2004). General Diagnostic Tests for Cross Section Dependence in Panel. CESifo Working Papers. 69. 10.2139/ssrn.572504. 2. Pesaran, Hashem. (2007). A Simple Panel Unit Root Test in the Presence of Cross Section Dependence. Journal of Applied Econometrics. 22. 10.1002/jae.951. 3. Susanna Mansikkamaki. (2023). Firm growth and profitability: The role of age and size in shifts between growth–profitability configurations. Journal of Business Venturing Insights (Elsevier) 19 e00372. | II.6. Debt serviceability – Stronger Balance Sheets: How Companies Improved Their Financial Health Post-pandemic, companies improved their ability to service debt, with the interest coverage ratio (ICR) rising significantly. Manufacturing firms showed strong financial resilience. The interest coverage ratio, which measures a company’s ability to pay interest on its debt, shows a notable improvement at aggregate level during the post-COVID period compared to pre- COVID and during COVID times. During pre-COVID period, the ICR of listed NGNF companies ranged from 3.2 to 4.8, indicating a stable ability to cover interest expenses. During COVID, the ratio inched-up to 3.7 from 3.3 during the previous year, reflecting resilience amidst economic challenges. The decline in the ICR below unity was particularly pronounced within the non-IT services sector, underscoring increased financial strain during coronavirus pandemic. This trend was predominantly driven by significant downturn in the ‘Telecommunication’ and ‘Transport and Storage Services’ industries. ICR of non-IT services companies improved since pandemic and crossed unity. Due to substantial profit growth and effective cost management in the manufacturing sector, the ICR, on an average, improved to 7.7 post-COVID, signifying a notable enhancement in financial health and a stronger capacity to service debt. The improvement in debt serviceability was particularly attributed to the strong performance of the ‘Chemicals and Chemical Products’, ‘Motor Vehicles and Other Transport Equipment’, and ‘Pharmaceuticals and Medicines’ industries. Although the debt serviceability of ‘Petroleum Products’ industry improved after the pandemic, it remained below its pre-COVID levels. In contrast, ICR of IT sector exhibited moderating trend over the period but it remained at very high level, given its lower dependence on debt (Chart 9). 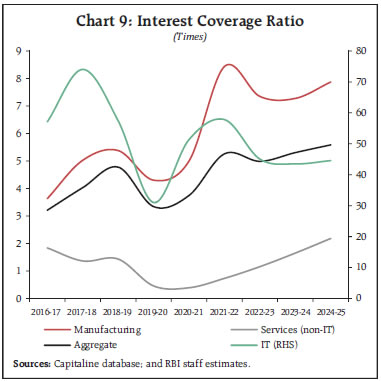 II.7. Firm size-wise analysis: Big vs Small: Who Led the Corporate Recovery? Large corporations drove overall profitability, but medium and small firms also demonstrated greater improvements in debt servicing. Cost efficiency helped all firm sizes recover from pandemic losses. To differentiate the corporate performance based on size of a company, listed companies were classified into three size groups according to their paid-up capital in the respective year. Companies having paid-up capital more than Rs. 25 crores, between Rs 10 crore to Rs 25 crore and less than Rs 10 crore were classified as large, medium and small companies, respectively. Aggregate level sales growth was mainly driven by large companies (having sales share of around 81-84 per cent across the periods). Across all size firms, corporates exhibited steady increase in sales growth during the pre-pandemic years. The onset of the pandemic and various social distancing norm related measures implemented by the government impacted the corporate performance severely across all firm sizes, as reflecting in contraction in sales and the nominal GVA growth during COVID period (Chart 10 and Annex Table A3). Large companies emerged as the primary contributors to overall profitability, consistently achieving higher operating profit margins compared to medium and small size firms. Despite the pandemic-induced decline in sales, firms managed to improve their operating profit margins through effective cost-cutting measures and operational efficiency enhancements during the crisis (Chart 11). Deleveraging of balance sheet by corporates and improved profitability helped better debt serviceability across the size categories. When examining debt serviceability across firm size, medium and small-sized companies demonstrated higher debt serviceability compared to their larger counterparts. However, it was the large companies that significantly drove the debt serviceability metrics of listed private non-financial corporates (Chart 12). III. Balance Sheet Analysis - Deleveraging for Stability: The Shift Towards Financial Strength Companies pursued deleveraging, reducing their debt burdens while improving financial health. At the aggregate, the listed private non-financial companies went through a gradual process of deleveraging, as exhibited by their debt5 to equity and debt to asset ratios, during the period under study, barring uptick seen during the pandemic year. Deleveraging trend was mostly observed in the manufacturing and IT sector companies. In contrast, the non-IT services sector witnessed higher leverage with consistent rise till 2022-23, which was mainly due to lower equity base primarily reflecting decrease in their retained earnings. Higher leverage of non-IT services companies was predominantly reflecting stress in the telecom and transport sector companies. However, capitalisation of higher profit during 2023-24 and 2024-25 helped the sector to arrest the rising leverage trend (Chart 13). 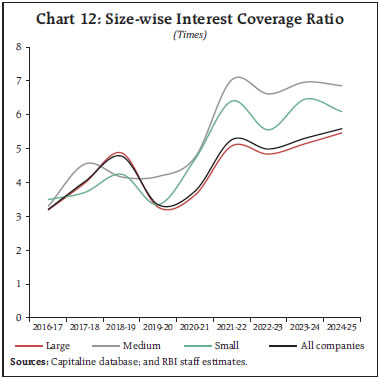 Overall, the level of debt of listed private non-financial corporates increased from pre-COVID to the latest year. But, there has been higher increase in borrowing by large companies than their counter parts. On the other hand, the level of equity base increased at a faster pace than the debt levels across all firm size companies. Consequently, the leverage ratio improved for all sized groups6, though the deleveraging was more evident for the other than larger sized companies (Chart 14). Analysis of sources and uses of funds for listed private manufacturing companies indicated that retained earnings remained the major source of funds, contributing to more than 55 per cent share in total equity and liabilities across all the years barring 2019-20. Capitalisation of higher net profit resulted in higher accumulation of retained profit across most of the periods (Chart 15). Build-up of total assets (i.e. annual absolute change) of the manufacturing companies rose gradually during post pandemic period. The manufacturing companies used more than 50 per cent of the funds for the purpose of building-up the fixed assets and non-current investments (financial) across the period under study, barring COVID and the following year. While during COVID, major portion of the funds were used for building up fixed assets, during 2021-22, funds were utilized for making noncurrent investments (Chart 16).
IV. Conclusion India’s private corporate sector has demonstrated significant resilience and adaptability amid economic disruptions led by the COVID-19 pandemic. While the weak domestic economic activity underpinned by sluggish private consumption during 2019-20 and the pandemic overblown the situation further causing a significant contraction in sales and profitability. Corporate sector rebounded strongly thereafter, supported by fiscal and monetary policies, pandemic-led pent up demand, and effective cost management. Sales growth peaked at 32.5 per cent in 2021-22 before normalising at 7.2 per cent in 2024-25, reflecting a transition from a rapid recovery phase to stable growth. Operating profit margins remained resilient, with large firms consistently outperforming medium and small enterprises. Despite challenges, cost optimisation strategies helped businesses sustain profitability. The manufacturing sector maintained stable profit margins, while non-IT services, after initial volatility, rebounded strongly. IT sector growth remained steady throughout. Balance sheet analysis indicates that corporates continued to deleverage their balance sheet, which will help to undertake fresh investment activities. Medium and small firms enhanced their debt servicing capacity, contributing to overall financial stability. The study underscores the corporate sector’s ability to navigate crises and emerge stronger, positioning itself as one of the important drivers of India’s economic growth. With a robust financial foundation and adaptive strategies, the sector remains well-placed to capitalize on future opportunities and contribute to sustained economic expansion. Looking ahead, sustaining corporate growth will largely depend on a combination of factors such as macroeconomic conditions, domestic demand, supportive policy measures, and global market dynamics. Additionally, strengthening supply chains, improving cost efficiencies, and fostering technological innovations will play a key role in maintaining competitiveness and shaping overall corporate performance. References: Bai, J., Choi, S. H., & Liao, Y. (2021). Feasible generalized least squares for panel data with cross-sectional and serial correlations. Empirical Economics, 60, 309-326. International Monetary Fund (IMF). World Economic Outlook: countering the Cost-of-Living Crisis. Washington, DC, October (2022).
Retrieved from https://www.imf.org/en/Publications/WEO/Issues/2022/10/11/world-economic-outlook-october-2022. Kells, S. (2020), “Impacts of COVID-19 on corporate governance and assurance, international finance and economics, and non-fiction book publishing: some personal reflections”, Journal of Accounting & Organizational Change, Vol. 16 No. 4, pp. 629-635. Mather, P. (2020), “Leadership and governance in a crisis: some reflections on COVID-19”, Journal of Accounting & Organizational Change, Vol. 16 No. 4, pp. 579-585. Patra, M. D. (2022), “RBI’s Pandemic Response: Stepping out of Oblivion”, Keynote Address delivered at the C D Deshmukh Memorial Lecture Organised by the Council for Social Development, Hyderabad on January 28, 2022. Retrieved from https://www.rbi.org.in/Scripts/BS_SpeechesView.aspx?Id=1195. Pramesti, N. P. E., Yasa, P. N. S., and Ningsih, N. L. A. P. (2021). The Effect of Capital Structure and Sales Growth on Company Profitability and Value in the Cosmetics Manufacturing and Household Needs Manufacturing Companies. Jurnal Ekonomi dan Bisnis Jagaditha, 8(2), 187-193. doi: https://doi.org/10.22225/jj.8.2.2021.187-193. Sharjil M. Haque and Richard Varghese (2021). The COVID-19 Impact on Corporate Leverage and Financial Fragility. International Monetary Fund (IMF) Working Paper (2021), WP/21/265. Topalova, P (2004). Overview of the Indian Corporate Sector: 1989–2002. International Monetary Fund (IMF) Working Paper (2004), WP/04/64. William C. House, and Michael E. Benefield (1995). The impact of sales and income growth on profitability and market value measures in actual and simulated industries. Developments In Business Simulation & Experiential Exercises, Volume 22, 1995.
Annex | Table A1: Performance of Listed Non-Government Non-Financial Companies (Growth in per cent) | | Year | Number of Companies | Sales Growth | Expenditure Growth | Cost of Raw material Growth | Staff Cost Growth | Power and Fuel Growth | Operating profit Growth | Net profit Growth | GVA Growth | | 2016-17 | 3,007 | 3.1 | 3.8 | 4.8 | 8.7 | -1.2 | 5.4 | 11.2 | 6.6 | | 2017-18 | 3,096 | 9.8 | 10.1 | 12.3 | 7.5 | 17.5 | 5.2 | -0.3 | 5.8 | | 2018-19 | 3,151 | 14.0 | 15.3 | 16.9 | 10.6 | 15.7 | 10.5 | 36.2 | 11.7 | | 2019-20 | 3,064 | -4.2 | -5.2 | -10.2 | 8.1 | -6.0 | -3.9 | -58.7 | 0.7 | | 2020-21 | 3,049 | -4.2 | -7.1 | -7.0 | 0.3 | -21.6 | 10.4 | 115.6 | 6.2 | | 2021-22 | 3,166 | 32.5 | 36.2 | 47.6 | 16.0 | 47.3 | 27.4 | 71.7 | 20.4 | | 2022-23 | 3,115 | 19.8 | 22.0 | 20.6 | 16.6 | 48.8 | 2.7 | -0.2 | 8.8 | | 2023-24 | 3,281 | 4.7 | 2.8 | 0.1 | 9.2 | -8.1 | 14.4 | 18.0 | 12.1 | | 2024-25 | 3,902 | 7.2 | 7.3 | 6.7 | 7.7 | -2.5 | 8.9 | 18.9 | 9.3 |
| Table A2: Sector-wise Performance Parameters of Listed Non-Government Non-Financial Companies (Growth in per cent) | | | Manufacturing | Services (IT) | Services (non-IT) | | Year | Number of Comp anies | Sales
Growth | Oper ating Profit Growth | Net Profit Growth | GVA
Growth | Num ber of Comp anies | Sales
Growth | Oper ating Profit Growth | Net Profit Growth | GVA
Growth | Number of Companies | Sales
Growth | Opera ting Profit Growth | Net Profit Growth | GVA
Growth | | 2016-17 | 1,875 | 4.2 | 12.2 | 28.0 | 10.6 | 199 | 9.4 | 8.0 | 8.7 | 8.7 | 579 | -1.5 | -7.7 | -114.5 | -2.0 | | 2017-18 | 1,891 | 11.9 | 10.4 | 2.0 | 9.7 | 192 | 5.0 | 3.2 | 10.1 | 6.0 | 626 | 1.8 | -17.9 | $ | -8.5 | | 2018-19 | 1,918 | 14.8 | 16.3 | 42.2 | 13.7 | 202 | 16.2 | 14.0 | 3.6 | 11.9 | 628 | 11.3 | -12.8 | $ | -2.5 | | 2019-20 | 1,841 | -7.4 | -11.6 | -11.0 | -7.0 | 195 | 8.4 | 8.7 | 10.0 | 10.5 | 616 | 6.9 | 47.9 | $ | 38.0 | | 2020-21 | 1,830 | -2.8 | 10.6 | 23.0 | 7.6 | 198 | 4.4 | 15.5 | 8.0 | 6.7 | 637 | -14.6 | 3.1 | $ | -5.3 | | 2021-22 | 1,865 | 36.7 | 34.5 | 50.2 | 24.3 | 216 | 19.8 | 11.0 | 21.1 | 18.3 | 699 | 27.2 | 21.9 | $ | 17.6 | | 2022-23 | 1,821 | 18.0 | -1.2 | -3.8 | 3.9 | 215 | 19.4 | 8.8 | -0.4 | 15.6 | 689 | 33.5 | 15.1 | $ | 18.0 | | 2023-24 | 1,846 | 3.5 | 12.4 | 8.5 | 10.5 | 211 | 5.5 | 5.6 | 10.5 | 7.8 | 927 | 7.9 | 27.9 | $ | 21.8 | | 2024-25 | 2,055 | 6.0 | 6.0 | 12.2 | 8.6 | 255 | 7.1 | 6.1 | 7.0 | 5.5 | 1,223 | 11.4 | 15.9 | @ | 17.3 | | Note: The ratio / growth rate for which denominator is negative or negligible, is not calculated and is indicated as ‘$’ and ‘@’ respectively. |
| Table A3: Size-wise Performance Parameters of Listed Non-Government Non-Financial Companies (Growth in per cent) | | | Large | Medium | Small | | Year | Sales
Growth | Expen diture Growth | Ope rating Profit Growth | Net Profit Growth | GVA
Growth | Sales
Growth | Expen diture Growth | Ope rating Profit Growth | Net Profit Growth | GVA
Growth | Sales
Growth | Expen diture Growth | Oper ating Profit Growth | Net Profit Growth | GVA
Growth | | 2016-17 | 3.2 | 4.0 | 5.4 | 11.2 | 6.7 | 4.4 | 4.5 | 9.8 | 19.7 | 8.3 | -1.8 | -0.8 | -5.0 | -3.8 | 0.6 | | 2017-18 | 9.9 | 10.1 | 5.8 | -1.8 | 5.4 | 9.0 | 10.2 | 1.2 | 10.1 | 9.4 | 9.6 | 10.4 | 2.6 | 4.7 | 5.8 | | 2018-19 | 14.6 | 16.0 | 11.0 | 43.2 | 13.0 | 11.2 | 12.7 | 5.0 | -2.2 | 3.1 | 11.4 | 12.3 | 12.5 | 18.4 | 10.2 | | 2019-20 | -4.1 | -4.9 | -3.8 | -67.5 | 0.7 | -3.7 | -5.1 | -1.7 | 2.0 | 2.5 | -7.6 | -8.8 | -11.9 | -17.8 | -2.8 | | 2020-21 | -4.6 | -7.4 | 8.7 | 146.8 | 5.9 | -2.3 | -5.7 | 24.0 | 38.3 | 8.4 | -3.1 | -6.1 | 17.8 | 29.8 | 6.0 | | 2021-22 | 33.3 | 36.9 | 28.4 | 75.3 | 20.5 | 29.1 | 32.6 | 19.6 | 58.7 | 20.0 | 30.6 | 35.9 | 24.4 | 36.8 | 17.4 | | 2022-23 | 20.7 | 23.4 | 1.9 | -0.1 | 8.5 | 16.3 | 16.3 | 10.3 | -2.5 | 11.7 | 13.3 | 13.0 | 4.1 | 6.6 | 7.9 | | 2023-24 | 4.6 | 2.3 | 15.2 | 18.1 | 12.1 | 6.3 | 6.4 | 8.0 | 15.7 | 11.5 | 3.8 | 1.8 | 14.3 | 24.8 | 14.0 | | 2024-25 | 6.6 | 6.7 | 8.8 | 21.0 | 9.2 | 10.6 | 10.2 | 10.3 | 7.3 | 11.1 | 9.5 | 11.0 | 5.6 | -3.7 | 6.8 |
| Table A4: Nominal Growth in Gross Value Added (per cent) | | Industry-group | 2016-17 | 2017-18 | 2018-19 | 2019-20 | 2020-21 | 2021-22 | 2022-23 | 2023-24 | 2024-25 | | Manufacturing | 10.6 | 9.7 | 13.7 | -7.0 | 7.6 | 24.3 | 3.9 | 10.5 | 8.6 | | Cement and Cement Products | 13.1 | 12.1 | 5.1 | 17.9 | 17.5 | -1.8 | -13.6 | 21.9 | -2.7 | | Chemicals and Chemical Products | 11.4 | 13.8 | 10.1 | 0.4 | 11.3 | 24.5 | 8.6 | -3.7 | 8.7 | | Computer and Electronic Equipments | -4.0 | 9.8 | 8.2 | -3.2 | 0.9 | 71.0 | 26.2 | 26.5 | 37.1 | | Electrical Machinery and Apparatus | 5.1 | 2.7 | 7.8 | -7.1 | 3.7 | 9.3 | 21.5 | 21.1 | 25.2 | | Fabricated Metal Products | 0.1 | 16.7 | 18.6 | -24.7 | -7.1 | 36.3 | 15.3 | 16.3 | 8.5 | | Food Products and Beverages | 16.6 | -19.4 | 28.9 | 11.8 | 14.0 | 11.7 | 12.0 | 8.9 | 6.8 | | Glass and Glass Products | 7.3 | 5.6 | 8.0 | 1.8 | -9.3 | 26.2 | 14.9 | 22.3 | -0.6 | | Iron and Steel | 40.0 | 20.2 | 28.4 | -18.9 | 45.7 | 53.6 | -30.3 | 16.9 | -3.8 | | Jewellery and Related Articles | 5.6 | 19.7 | -6.0 | 9.6 | -19.5 | 30.9 | 37.3 | 9.1 | 17.9 | | Leather | 4.3 | 18.2 | 12.2 | 14.7 | -19.9 | 23.0 | -2.2 | -0.3 | 4.3 | | Machinery and Machine Tools | 6.5 | 6.5 | 12.1 | -4.4 | 3.4 | 16.9 | 17.2 | 18.5 | 13.6 | | Medical Precision and Other Scientific Equipments | 9.1 | 32.1 | 16.0 | 8.0 | 16.3 | 19.2 | 22.3 | 28.4 | 28.6 | | Motor Vehicles and Other Transport Equipments | 8.0 | 15.1 | 12.1 | -18.6 | -6.4 | 11.8 | 34.3 | 31.0 | 12.6 | | Other Manufacturing | 17.7 | 60.8 | 68.6 | -61.2 | 5.7 | 38.3 | 7.8 | 5.8 | 5.9 | | Paper and Paper Products | 30.1 | 13.8 | 30.2 | -46.4 | -29.9 | 39.1 | 57.4 | -6.5 | -21.9 | | Petroleum Products | 11.0 | 15.0 | 13.4 | -1.5 | -24.8 | 33.3 | 16.2 | 11.8 | -11.7 | | Pharmaceuticals and Medicines | 1.7 | 6.7 | 11.8 | 10.0 | 13.2 | -0.9 | 8.2 | 19.5 | 20.1 | | Plastic Products | 3.0 | 6.1 | 12.5 | -4.3 | 30.4 | 12.2 | -9.0 | 9.5 | 11.2 | | Precious and Non-Ferrous Metals | 24.4 | 9.3 | -8.3 | -17.6 | 51.7 | 42.3 | 4.8 | -34.9 | 57.9 | | Rubber and Rubber Products | -16.4 | -3.5 | 9.0 | -0.2 | 21.3 | -8.6 | 10.1 | 38.0 | -5.0 | | Textiles | 5.2 | -7.7 | 7.6 | -10.2 | -11.8 | 60.7 | -14.3 | 2.2 | 8.6 | | Tobacco Products | 6.3 | 6.1 | 12.5 | 5.5 | -8.1 | 13.5 | 21.5 | 6.9 | 3.1 | | Wood Products | 10.8 | 7.0 | 7.1 | 8.0 | -1.9 | 39.6 | 17.3 | 2.3 | 1.8 | | Services (non-IT) | -2.0 | -8.5 | -2.5 | 38.0 | -5.3 | 17.6 | 18.0 | 21.8 | 17.3 | | Business Support Services | 8.6 | 3.3 | 2.8 | 7.0 | 32.6 | 25.6 | 33.8 | 15.2 | 14.8 | | Hospital Services | 8.6 | 10.3 | 22.1 | 31.7 | -28.5 | 36.5 | 16.4 | 16.7 | 56.1 | | Hotel and Restaurant | 2.9 | 2.8 | 0.5 | 1.4 | -64.5 | 86.7 | 58.7 | 15.5 | 10.2 | | Other Services | 4.1 | 5.9 | 4.3 | 7.1 | -11.0 | 19.1 | 17.3 | 18.3 | 15.5 | | Real Estate | -8.8 | -7.0 | -3.0 | 23.7 | -23.7 | 41.6 | 21.7 | -7.0 | 8.6 | | Telecommunication | -5.7 | -29.9 | -19.0 | 76.9 | 27.0 | 8.9 | 4.0 | 19.6 | 19.9 | | Transport and Storage Services | -2.8 | -1.9 | -15.0 | 64.1 | -31.2 | 0.3 | 54.1 | 53.9 | 13.5 | | Video and Television Programming and Broadcasting | 12.9 | 24.8 | 11.8 | -4.1 | -22.4 | 16.6 | 0.3 | 15.3 | -6.2 | | Wholesale and Retail Trade | -4.3 | 10.4 | 13.8 | 15.9 | -15.5 | 46.2 | 37.9 | 16.0 | 15.1 | | Services (IT) | | | | | | | | | | | Computer and Related Activities | 8.7 | 6.0 | 11.9 | 10.5 | 6.7 | 18.3 | 15.6 | 7.8 | 5.5 |
| Table A5: Description of Variables used in the FGLS model | | Sales growth (y-o-y) | It is the percentage change of a net sale over a given period of time. To compute the growth rates, a common set of companies for the current and previous period is considered. | | Asset turnover ratio | ATR is defined as net sales to total asset ratio which measures how efficiently a company uses its assets to generate revenue. Since, total assets of a company are available on half-yearly basis, for compiling quarterly data on ATR, average total assets is compiled as indicated below:
For Q1 and Q2 of current financial year,
For Q3 and Q4 of current financial year,
| | Staff cost to sales ratio | It is defined as ratio of total staff expenses to net sales of the given quarter. | | Cost of raw material to sales ratio | It is the ratio of cost of raw material to the net sales of the given quarter. | | WPI (Manufacturing) inflation (y-o-y) | WPI Manufacturing inflation is the y-o-y growth of quarterly average of monthly WPI (manufactured products) series published by OEA, DPIIT, MoCI. | | GVA (Manufacturing) growth (y-o-y) | GVA manufacturing is the y-o-y growth in quarterly manufacturing GVA (nominal), published in NAS, MoSPI. | | COVID dummy | COVID dummy takes value 1 during the periods Q4:2019-20 to Q4:2020-21 and 0 otherwise. | | Post COVID Dummy | Post-COVID dummy takes value 1 for the periods Q1:2021-22 to Q4:2024-25 and 0 otherwise. |
|