Pankaj Kumar and Ramesh Golait *
This paper examines the outreach of Self Help Group (SHG)-Bank Linkage Programme (SBLP) in the backdrop of growing banking and socio-economic divide between regions in India. The ‘defining event’ in the build-up of financial architecture in India was the nationalisation of major commercial banks. The aftermath of nationalisation witnessed a remarkable spread of the banking system to the unbanked and under-banked rural areas. However, the dependence on informal sources of credit has not decreased in rural areas. The problem accentuated as banks veered away from rural to urban India. The relative decline of commercial banking network in the rural areas runs contrary to the objective of financial inclusion and is a formidable challenge in the way of faster and more inclusive growth.
SBLP was conceived to fill the existing gap in the formal financial network and extending the outreach of banking to the poor. However, the present distribution of the SBLP is skewed against the poorer regions of the country. While less than one-fifth of total loans to SHGs went into the Eastern and Central Regions taken together, they accounted for more than three-fifth of the total poor in India. Banks need to be encouraged as facilitators in extending the SHG movement in the poorer regions, perhaps by introducing a scheme of performance-linked incentive. Specific funds may be created to address the regional imbalances in the SBLP. SHGs need to be formed around activities of rural infrastructure such as construction and renovation of minor irrigation tanks, feeder channels, rural roads, etc. This will generate significant external economies for agricultural yields and overall rural development. Enhanced efforts should be made towards embedding livelihood activities, micro-insurance and grain banks in the SHG model.
JEL Classification : G21, G29
Key words : Scheduled Commercial Banks, Credit, Deposit, Self-Help Groups
The ‘defining event’ in the build-up of financial architecture in India was the nationalisation of major commercial banks. It essentially reflected the national aspiration for rapid and equitable economic and social development. The aftermath of nationalisation witnessed a remarkable spread of the banking system to the hitherto neglected sectors and regions. Significant progress was made in terms of coverage of the rural population by formal credit institutions, with nearly 70 per cent of all commercial bank branches and approximately 1,00,000 cooperative credit outlets at present operating in the rural areas. These networks apart from working as financial institutions also play a pivotal role in the development and transformation of the rural and agrarian economy.
Notwithstanding concerted and multi-pronged efforts to extend institutional credit to all sections of society, the dependence on informal sources of credit has not decreased in rural areas and has, in fact, increased in several regions. The banking outreach continues to be unevenly spread with poorer regions at a particularly disadvantaged position. According to an estimate by the World Bank, the credit requirement of the poorer sections in India was placed at around Rs.50,000 crore per annum in 2002. Against this requirement, the credit outstanding of the poorer sections with the formal banking sector is stated to be Rs.5,000 crore or 10 per cent of the total demand (Planning Commission, 2007). Furthermore, the physical outreach of the rural credit has not been effective in achieving income expansion and poverty reduction, and access to needed financial services is still an issue in the rural areas.
Against this background, this paper presents the regionally disaggregated progress made in the last decade (1996-2006) in terms of spread and depth of commercial banks. Accordingly, Section I begins with the assessment of important banking indicators at the all-India level. Section II provides the disaggregated picture at the regional level. Section III covers the widely acclaimed outreach programme of Bank-SHG linkage in detail. Finally, Section IV on conclusion and policy implications sums up the insights of this enquiry.
Spread of Banking at All-India Level
Over the years, the spread of commercial banking network in India has skewed in favour of metropolitan centres. To illustrate, Table 1 presents population group-wise number of offices of Scheduled Commercial Banks (SCBs) in India at two points of time, March 1996 and March 2006. There are about 70,776 branches of SCBs in India. The decade since 1996 saw an addition of 6,320 offices of SCBs at the all-India level, 4,052 (64.1 per cent) of which was into the metropolitan category. On the contrary, rural category witnessed a decline of 2,371 offices leading to decline in its share in the total SCBs offices from 51.2 per cent in 1996 to 43.2 per cent in 2006. Diminishing presence of SCBs in the rural areas may constrain the objective of faster and more inclusive growth set out by the Government of India for the Eleventh Plan Period (2007-08 to 2011-12).
Table 1: Population Group-wise Offices of SCBs in India |
Region |
1996 |
2006 |
Change |
1 |
2 |
3 |
4 |
Rural |
32,981 |
30,610 |
-2,371 |
| |
(51.2) |
(43.2) |
(-37.5) |
Semi-Urban |
13,731 |
15,471 |
1,740 |
| |
(21.3) |
(21.9) |
(27.5) |
Urban |
9,798 |
12,697 |
2,899 |
| |
(15.2) |
(17.9) |
(45.9) |
Metropolitan |
7,946 |
11,998 |
4,052 |
| |
(12.3) |
(17.0) |
(64.1) |
All India |
64,456 |
70,776 |
6,320 |
| |
(100.0) |
(100.0) |
(100.0) |
Note: Figures in bracket are percentage share in total.
Source: Basic Statistical Returns (BSR) RBI (Various Issues). |
The pattern of population group-wise share in total credit outstanding of SCBs is shown in Chart 1. The share of rural regions in credit outstanding of SCBs declined to 8.3 per cent in 2006 from over 11.4 per cent in 1996. The share of semi-urban and urban centres also declined in credit outstanding during the decade leaving only the metropolitan centres to gain in share by about 7.6 percentage points.
All-India Credit-Deposit Ratio (CDR) stood at 72.4 per cent in 2006, which was about 12.6 percentage points higher than in 1996 partly reflecting buoyant credit growth in the recent years. While the CDR has increased for all population-groups during the decade ending 2006, it remains in the range of 50-55 per cent in the rural, semi-urban and urban centres and substantially higher at over 85 per cent in the metropolitan centres (Chart 2).
The shrinking share of smaller credit in total credit disbursed by the SCBs is highlighted in Table 2. The smallest category of Rs 25,000 and below accounted for only 3 per cent (14.2 per cent in 1996) of the total credit outstanding in 2006. While the increasing share of the category above Rs. 25,000 and upto Rs.25 lakh almost completely offset the shrinkage observed in the case of the smallest category of Rs 25,000 and below, the direction of change appears to be contrary to the objective of financial inclusion, which is to provide financial services and timely and adequate credit needed by vulnerable groups such as weaker sections and low income groups at an affordable cost.
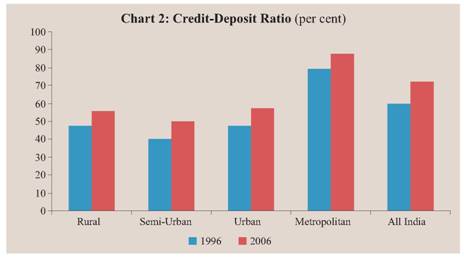
Table 2: Share of SCBs Credit according to Size Limit |
(per cent) |
Size of Credit Limit |
1996 |
2006 |
No. of Accounts |
Amount Outstanding |
No. of Accounts |
Amount Outstanding |
< Rs. 25,000 |
91.6 |
14.2 |
45.0 |
3.0 |
Rs. 25,000 - Rs.25 lakh |
8.2 |
24.6 |
54.6 |
36.0 |
Rs. 25 lakh - Rs.10 crore |
0.2 |
41.1 |
0.4 |
21.2 |
> Rs.10 Crore |
0.0 |
20.1 |
0.0 |
39.8 |
Source: Own computations based on BSR (Various Issues). |
An overview of the operations of SCBs during the past ten years reveals that their presence in the rural areas has been declining in terms of number of offices and credit disbursal. Furthermore, there has been a disconcertingly significant decline in the smallest category of credit (Rs. 25,000 and less) in terms of both, number of accounts and amount outstanding. These trends indicate that the banking system is still hesitant on various grounds to purvey credit to the poor and low income groups especially in the rural areas.
Regional Spread of Banking
Like many other socio-economic indicators, banking indicators also are not uniform across regions in India. Lower value of population per office indicates higher banking density. It is observed that the banking density is significantly higher in the Southern, Northern and Western Region as compared with North-Eastern, Central and Eastern Region (Table 3). Further, the banking density has deteriorated more in the North-Eastern, Central and Eastern Region, where it was already low, in the decade since 1996.
In the context of regional spread of SCBs, it is observed that of the 6,320 offices opened since 1996, 4,925, or more than three quarters, have been in the Southern, Northern and Western Region while the other three regions, North-Eastern, Central and Eastern Region taken together, have accounted for less than a quarter (Table 4). As a result, the latter regions, individually and collectively, now account for a lower share of SCB offices as compared with that a decade ago.
Table 3: Region-wise Banking Density |
Population per Office (‘000) |
Region |
1996 |
2006 |
Change |
1 |
2 |
3 |
4 |
Northern Region |
11.9 |
12.6 |
0.7 |
North-Eastern Region |
18.4 |
21.7 |
3.3 |
Eastern Region |
17.8 |
19.9 |
2.1 |
Central Region |
17.4 |
20.2 |
2.8 |
Western Region |
13.7 |
14.9 |
1.2 |
Southern Region |
12.2 |
12.2 |
0.0 |
All India |
14.7 |
15.9 |
1.2 |
Source: Own computations based on BSR, RBI and National Accounts Statistics, Government of India. (NAS) (Various Issues). |
It is believed in general that financial development is robustly and positively related to economic development. In India, various regions have shown diverse economic growth and are at different levels of socio-economic development. As a consequence, they may be expected to show different levels of banking penetration. In view of this, emphasising only on banking density (defined in terms of population per office) may not be adequate to highlight the extant disparity in banking spread across regions. Accordingly, Table 5 presents the data on region-wise credit from the SCBs as a ratio of regional GDP. The bank Credit-GDP ratio varied from 13.2 per cent in the North-Eastern Region to 76.6 per cent in the Western Region in 2006. There was considerable variation in the region-wise credit-deposit ratio also. The highest credit-deposit ratio was found in the Western Region (92 per cent) closely followed by the Southern Region (84.4 per cent). However, Southern Region was distinctly ahead in terms of the proportion of population having credit account as compared with other regions. Overall, it appears that the spread and depth of banking is much higher in the Southern, Western and Northern Regions as compared with their North-Eastern, Central and Eastern counterparts even after accounting for diverse economic growth and development across regions.
Table 4: Regional Spread of Banks |
(No. of Offices of SCBs) |
Region |
1996 |
2006 |
Change |
1 |
2 |
3 |
4 |
Northern Region |
10,021 |
11,821 |
1,800 |
| |
(15.5) |
(16.7) |
(28.5) |
North-Eastern Region |
1,936 |
1,949 |
13 |
| |
(3.0) |
(2.8) |
(0.2) |
Eastern Region |
11,686 |
12,308 |
622 |
| |
(18.1) |
(17.4) |
(9.8) |
Central Region |
13,344 |
14,104 |
760 |
| |
(20.7) |
(19.9) |
(12.0) |
Western Region |
9,938 |
10,996 |
1,058 |
| |
(15.4) |
(15.5) |
(16.7) |
Southern Region |
17,531 |
19,598 |
2,067 |
| |
(27.2) |
(27.7) |
(32.7) |
All India |
64,456 |
70,776 |
6,320 |
| |
(100.0) |
(100.0) |
(100.0) |
Note: Figures in bracket represent share in all-India.
Source: BSR (Various Issues). |
Chart 3 presents a scatter plot of States according to banking density and per capita income. It can be observed clearly that relatively poorer States have lower presence of SCBs. This is expected to constrain access and usage of banking services in the poorer states. If it is assumed that a plethora of economic opportunities exist in these states, which may be leveraged with access to basic financial services, then this pattern of banking penetration appears to be a formidable challenge in the way of faster and more inclusive growth.
Table 5: Region-wise Banking Indicators |
Regions |
2006 |
% Population having Credit Account |
Credit-Output Ratio |
Credit-Deposit Ratio |
1 |
2 |
3 |
4 |
Northern Region |
6.2 |
54.8 |
64.6 |
North-Eastern Region |
3.9 |
13.2 |
40.7 |
Eastern Region |
4.5 |
22.4 |
49.2 |
Central Region |
4.3 |
21.1 |
44.2 |
Western Region |
7.5 |
76.6 |
92.0 |
Southern Region |
16.4 |
46.7 |
84.4 |
All India |
7.6 |
45.8 |
72.4 |
Source: Computed based on data from BSR and NAS. |
Table 6 reinforces an earlier point that lower expansion of banking in the last decade in North-Eastern, Eastern and Central regions does not necessarily reflect relatively lower economic growth and, therefore, lower banking opportunity in these regions. Eastern and North-Eastern Region witnessed higher than average All-India growth in their per capita income during the decade 1996-2006 but recorded much lower growth in offices of SCBs than at All-India.
An outcome of the pattern of expansion of banking during the decade 1996-2006 in terms of banking and income disparity among states is presented in Table 7. While banking disparity remained lower than income disparity, the decade witnessed rising disparity among states both in terms of banking spread and per capita income. However, the fact that the magnitude of increase in banking disparity was higher than that in income disparity in the last decade is a matter of concern. Hence, there is a need to intensify efforts towards increasing the banking outreach in the poorer regions of the country, which are less served by the formal financial network. Traditionally, banks played an integral part in the poverty alleviation programmes of the Government and thereby performed a critical role in the efforts towards inclusive growth. Recently, the SHG-Bank Linkage Programme is a major plank of the strategy for delivering financial services to the poor in a sustainable manner. This is discussed in the next Section.
Table 6: Region-wise Progress of Banking |
Region |
Decadal (1996-2006) % Growth in |
Offices of SCBs |
Per Capita Income |
1 |
2 |
3 |
Northern Region |
18.0 |
127.9 |
North-Eastern Region |
0.7 |
130.4 |
Eastern Region |
5.3 |
145.7 |
Central Region |
5.7 |
93.3 |
Western Region |
10.6 |
123.1 |
Southern Region |
11.8 |
148.5 |
All India |
9.8 |
127.9 |
Source: Own computations based on BSR and NAS (Various Issues). |
Table 7: All India Disparity@ Measures |
Coefficient of Variation (in %) |
Disparity |
1996 |
2006 |
Banking |
34.3 |
45.4 |
Income |
43.7 |
53.5 |
@: Banking Disparity is calculated as coefficient of variation (cv) in population per office
of various States.
Income Disparity is calculated as cv in Per Capita Income of various States.
Source: Own computations based on BSR and NAS (Various Issues). |
Bank-SHG Linkage Programme
A sizeable share of population in India continues to remain outside the formal banking system despite considerable expansion in branch network. Alternative models are being experimented with to meet the objective of financial inclusion. The SHG-Bank linkage model is the indigenous model of micro-credit evolved in India and has been widely acclaimed as a successful model. SHG-Bank linkage programme is considered a promising approach to reach the poor and has since its inception made rapid strides exhibiting considerable democratic functioning and group dynamism. The SHG-Bank linkage model was introduced in 1991-92 with a pilot project of linking 500 SHGs with banks. This figure has gone up to more than 34 lakh by the end of March 2008. Cumulatively, these SHGs have accessed credit of Rs. 22,268 crore from banks during the period. About 4.1 crore poor households have gained access to the formal banking system through the programme. During the last nine years the number of SHGs linked to banks has gone up from 32,995 during 1998-99 to 34,77,965 during 2007-08. This shows an impressive 68 per cent compound annual growth rate. The compound annual growth rate for the cumulative bank loan to SHGs is even more impressive at 94 per cent, i.e., close to doubling each year. The faster growth in bank loans to SHGs has led to almost a four-fold increase in the average loans per SHG from Rs. 16,816 in 1999-2000 to Rs. 63,926 in 2007-08. These figures reflect the outstanding success of the programme (Chart 4).
Spatial Disparity in the SHG-Bank linkage Programme
Notwithstanding the remarkable progress, geographically there has been a skewed development of SHG-Bank linkage programme in India. There is wide regional disparity both in terms of the spread of SHGs linked to banks and cumulative bank loans disbursed under the programme. In March 2008, while the Southern Region accounted for 48.2 per cent of the total SHGs, the share of North- Eastern Region was just 3.4 per cent (Table 8). In terms of share in the total bank loans to SHGs, the region-wise differential gets further magnified.
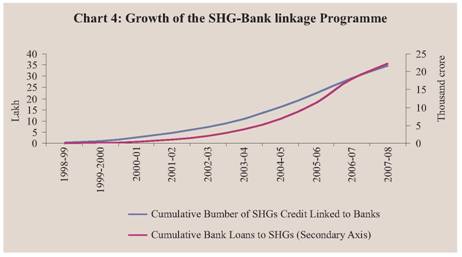
Table 8: Region-wise Progress of SHG-Bank Linkage Programme |
(As on March 31, 2008) |
Regions |
Share (%) in Total |
No. of SHGs |
Loans to SHGs (Rs. crore) |
Average Loans per SHG (Rs.) |
No. of SHGs |
Loans to SHGs |
SHGs per Lakh Population |
1 |
2 |
3 |
4 |
5 |
6 |
7 |
Northern |
2,30,740 |
851 |
36,899 |
6.6 |
3.8 |
156 |
North Eastern |
1,19,520 |
327 |
27,364 |
3.4 |
1.5 |
283 |
Eastern |
6,72,626 |
2,372 |
35,268 |
19.3 |
10.7 |
274 |
Central |
4,05,707 |
1,501 |
36,990 |
11.7 |
6.7 |
142 |
Western |
3,74,561 |
1,320 |
35,254 |
10.8 |
5.9 |
229 |
Southern |
16,74,811 |
15,896 |
94,915 |
48.2 |
71.4 |
703 |
All India |
34,77,965 |
22,268 |
64,027 |
100.0 |
100.0 |
310 |
Source: NABARD |
While the Southern Region accounted for 71.4 per cent of the total loans to SHGs, the share of North-Eastern Region was just about 1.5 per cent. For all regions excluding Southern Region, even though the share of total SHGs linked to banks was close to 51.8 per cent, their share in total loans to SHGs was only 28.6 per cent implying that adequate credit is not being routed through SHGs in these regions. As the regions vary in geographical area and population, the number of SHGs is normalised by the population of the region and SHG per lakh population has been taken as a better indicator of SHG spread in the respective regions. The number of SHGs per lakh population for the Southern Region is 703, which is more than double the average at all-India (310) and almost five times of the Central Region (142).
In addition to the inter-regional disparity, there is wider intra-regional disparity among the constituent States in SHG spread. The progress of SHG-Bank linkage programme has not been homogeneous in any region (Table 9). In the Southern Region, where the programme has been very successful, SHGs per lakh population varied between 891 in Andhra Pradesh and 435 in Kerala during March 2008. In the North-Eastern region, the major share was accounted for by Assam with 3.1 per cent of the total SHGs while the rest of the six States in the region had a negligible share in the total SHGs. Similarly, Rajasthan and Himachal Pradesh were distinctly ahead in the Northern Region in terms of spread of SHGs. In the Eastern Region, SHG spread in Orissa was comparable with the Southern States. There is clear evidence of the fact that the SHG movement in India has spread to other regions/States, though not to the same extent as in the Southern States. However, a major concern remains the scale of finance in the non-southern regions. The average loan per SHG in these regions continues to be much lower than that in the Southern Region. Further progress in the SHG-Bank linkage programme needs to reckon these regional variations in the spread of the programme.
Table 9: State-wise Variations in the SHG-Bank Linkage Programme |
NORTHERN REGION |
NORTH-EASTERN REGION |
State |
Share (%) in |
Indicator of SHG |
State |
Share (%) in |
Indicator of SHG |
Total SHGs |
Total Loans |
Spread |
Finance |
Total SHGs |
Total Loans |
Spread |
Finance |
1 |
2 |
3 |
4 |
5 |
1 |
2 |
3 |
4 |
5 |
Haryana |
0.4 |
0.5 |
54 |
86.6 |
ArP |
0.0 |
0.0 |
101 |
56.6 |
HP |
0.9 |
0.6 |
473 |
43.6 |
Assam |
3.1 |
1.3 |
371 |
26.1 |
J&K |
0.1 |
0.1 |
30 |
57.6 |
Manipur |
0.1 |
0.1 |
104 |
42.0 |
Punjab |
0.3 |
0.3 |
33 |
69.2 |
Megh |
0.0 |
0.0 |
49 |
27.7 |
Rajasthan |
5.0 |
2.3 |
275 |
29.7 |
Mizoram |
0.1 |
0.1 |
241 |
68.0 |
New Delhi |
0.0 |
0.0 |
3 |
110.1 |
Nagaland |
0.0 |
0.0 |
19 |
42.8 |
| |
|
|
|
|
Tripura |
0.1 |
0.0 |
127 |
17.0 |
| |
EASTERN REGION |
CENTRAL REGION |
State |
Share (%) in |
Indicator of SHG |
State |
Share (%) in |
Indicator of SHG |
Total SHGs |
Total Loans |
Spread |
Finance |
Total SHGs |
Total Loans |
Spread |
Finance |
1 |
2 |
3 |
4 |
5 |
1 |
2 |
3 |
4 |
5 |
Bihar |
2.7 |
1.4 |
102 |
32.7 |
Chh’garth |
1.7 |
0.6 |
263 |
23.3 |
Jharkhand |
1.2 |
0.9 |
144 |
45.3 |
MP |
2.4 |
1.4 |
124 |
36.5 |
Orissa |
8.8 |
5.4 |
784 |
38.8 |
UP |
6.8 |
4.0 |
128 |
37.6 |
Sikkim |
0.0 |
0.0 |
58 |
64.2 |
Utt’chal |
0.7 |
0.7 |
265 |
66.5 |
WB |
6.6 |
3.0 |
273 |
29.6 |
|
|
|
|
|
A&N Is |
0.0 |
0.0 |
68 |
66.3 |
|
|
|
|
|
| |
WESTERN REGION |
SOUTHERN REGION |
State |
Share (%) in |
Indicator of SHG |
State |
Share (%) in |
Indicator of SHG |
Total SHGs |
Total Loans |
Spread |
Finance |
Total SHGs |
Total Loans |
Spread |
Finance |
1 |
2 |
3 |
4 |
5 |
1 |
2 |
3 |
4 |
5 |
Goa |
0.0 |
0.1 |
101 |
110.4 |
AP |
20.8 |
37.5 |
891 |
115.5 |
Gujarat |
1.3 |
1.0 |
84 |
49.4 |
K’taka |
10.0 |
10.0 |
611 |
64.0 |
M’rashtra |
9.4 |
4.8 |
308 |
32.9 |
Kerala |
4.2 |
4.5 |
435 |
68.2 |
| |
|
|
|
|
T’nadu |
13.1 |
19.2 |
695 |
94.1 |
| |
|
|
|
|
P’cherry |
0.1 |
0.2 |
231 |
140.4 |
Note: 1. Indicator of SHG Spread is taken as number of SHGs per lakh population.
2. Indicator of SHG Finance is taken as average loan (in thousand Rs.) to SHGs.
Source: NABARD |
Banking Indicators and SHG Spread
Banks have been the major drivers of the SHG movement so far in the country. Though there does not appear to be a one-to-one correspondence between banking outreach and spread of SHG movement, this is captured by the positive correlation1 of 0.47 found between SHG spread (measured as number of SHGs per lakh population) and banking network (measured as number of branches of scheduled commercial banks per lakh population). A striking feature observed has been that even with similar banking network, SHG spread varies between Regions and States indicating that other local factors are equally important. For instance, at the regional level, similar banking network in the Northern and Southern Regions does not translate into comparable SHG spread (Table 10). Further, among the States where the SHG spread is better, there is a high variability in the banking network. Illustratively, Andhra Pradesh appears to have a less dense banking network as compared with Kerala when the banking network is seen against total population in the States. Yet, Andhra Pradesh has more than double SHG spread than that in Kerala.
It is found that a positive correlation (0.59) exists between SHG spread and credit-deposit ratio of Scheduled Commercial Banks. The credit-deposit ratio in the Southern Region was significantly higher at 84.4 per cent during March 2006, while the all-India average was 72.4 per cent. The higher credit-deposit ratio of the Southern Region could, inter alia be because of the better spread of SHGs in this region,which offers to banks an alternative channel of disbursing loans. SHGs appear to have played the role of conduits for credit disbursed by the banks. This underscores the importance of SHGs in purveying of credit, especially in the rural/semi-urban areas.
Table 10: Region-wise Banking Indicators and SHG Spread |
Region |
Per Capita Income (Rs.) |
SHG Spread# |
Banking Network@ |
C-D Ratio (%) |
1 |
2 |
3 |
4 |
5 |
Northern |
38,938 |
156 |
7.9 |
64.6 |
North Eastern |
24,104 |
283 |
4.6 |
40.7 |
Eastern |
21,302 |
274 |
5.0 |
49.2 |
Central |
18,548 |
142 |
5.0 |
44.2 |
Western |
44,699 |
229 |
6.7 |
92.0 |
Southern |
35,437 |
703 |
8.2 |
84.4 |
Total |
29,453 |
310 |
6.3 |
72.4 |
# : SHG spread is measured as number of SHGs per lakh population.
@ : Banking network is measured as number of branches of scheduled commercial banks
per lakh population.
Source: BSR, NABARD and CSO. |
Socio-Economic Indicators and SHG Spread
SHG-Bank linkage programme was started with the objective of extending the outreach of banking to the poor, who mainly comprise the marginal farmers, landless labourers, artisans and craftsmen and others engaged in small businesses such as hawking and vending. In this context, it would be pertinent to see whether the programme has adequately made inroads into the regions where concentration of poverty is higher. During 2004-05, the all-India poverty ratio stood at about 27.6 per cent. While the Northern (15.7 per cent), North- Eastern (19.2 per cent), Southern (19.8 per cent) and Western region (25.8 per cent) had lower than the all-India poverty ratio, Central (35 per cent), and Eastern Region (36.2 per cent) had higher poverty ratios than at the all-India level (Table 11).
The present distribution of the SHG–Bank linkage programme does not appear to have taken cognisance of the extent of poverty. In the Eastern and Central Region, the proportion of total poor in India is significantly higher than the proportion of SHGs linked to banks in these regions (Table 11 and Table 8). While both the regions taken together accounted for 61.1 per cent of the total poor in India, they accounted for only 31.0 per cent of all SHGs linked to banks in India. Further, their share in total loans to SHGs formed only 17.4 per cent.
Table 11: Distribution of Poverty during 2004-05 |
Region |
Poverty Ratio (%) |
Proportion of Total Poor |
Northern |
15.7 |
7.4 |
North Eastern |
19.2 |
2.6 |
Eastern |
36.2 |
29.0 |
Central |
35.0 |
32.1 |
Western |
25.8 |
13.6 |
Southern |
19.8 |
15.3 |
All India |
27.6 |
100.0 |
Source: Planning Commission |
On the other hand, Southern Region which accounted for 15.3 per cent of the total poor in India had about 48.2 per cent of all SHGs linked to banks and much higher 71.4 per cent of total loans to SHGs (Chart 5). There is, therefore, a need to intensify the spread of the programme in the States where the poverty is higher.
Loans to SHGs linked to banks in India account for only 1.5 per cent of the total credit outstanding of the scheduled commercial banks. However, there are regional variations. The size of the SHGs in terms of their share in the total bank credit is highest in the Southern Region (4 per cent), followed by North-Eastern (2.4 per cent), Eastern (2 per cent), Central (1.3 per cent), Northern (0.3 per cent) and Western regions (0.2 per cent). Given the relatively small size of the SHG-Bank linkage programme compared to the overall credit disbursed by banks, it cannot be expected to have had any significant impact on poverty reduction at a macro level. Nonetheless, a negative correlation of -0.25 between SHG spread (measured in terms of the number of SHGs per lakh population) and poverty ratio implies that the States where the SHG spread is better are also the States where the poverty ratio is lower. The SHG Bank Linkage has its impact on poverty alleviation through group effort, which emanates from their own savings and timely credit from various institutional agencies. According to a study2 conducted by NABARD, out of those below poverty line in the pre-SHG situation, 15 per cent moved above poverty line.
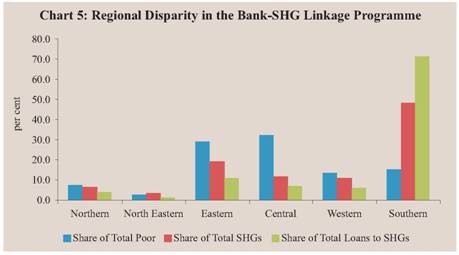
Table 12: Matrix Mapping States according to Poverty and SHG Spread |
| |
SHG per Lakh Population |
| |
<200 |
200-400 |
>400 |
Poverty (in Per cent) |
0-15 |
1. Haryana |
1. Mizoram |
1. Himachal Pradesh |
2. Jammu and Kashmir |
2. Kerala |
|
3. Punjab |
|
|
4. New Delhi |
|
|
5. Goa |
|
|
15-30 |
1. Arunachal Pradesh |
1. Rajasthan |
1. Andhra Pradesh |
2. Manipur |
2. Assam |
2. Karnataka |
3. Meghalaya |
3. West Bengal |
3. Tamilnadu |
4. Nagaland |
4. Pondicherry |
|
5. Tripura |
|
|
6. Sikkim |
|
|
7. A & N Islands |
|
|
8. Gujarat |
|
|
>30 |
1. Bihar |
1. Chhattisgarh |
1. Orissa |
2. Jharkhand |
2. Uttaranchal |
|
3. Madhya Pradesh |
3. Maharashtra |
|
4. Uttar Pradesh |
|
|
It is found that a positive correlation (0.31) exists between SHG spread (measured in terms of the number of SHGs per lakh population) and Per Capita Income of States emphasizing the result that SHG spread continues to be lower in the poorer regions of the country. One policy implication that may emerge from the above analysis is that the SHG spread needs to be intensified in the States where the poverty is higher, which is lacking at present. A mapping of SHG spread and poverty has been attempted in Table 12 precisely with an objective to select States, where further efforts are needed.
Conclusion and Policy Implications
Scheduled commercial banks in India have played a pivotal role in the development and transformation of the rural and agrarian economy. However, their diminishing presence in the rural areas, as reflected by the reduction in the number of rural branches of SCBs, in the last decade runs contrary to the objective of faster and more inclusive growth set out by the Government for the Eleventh Plan Period. In particular, the shrinking share of smaller credit in total credit disbursed by the SCBs may constrain the objective of financial inclusion, which is to provide financial services and timely and adequate credit needed by vulnerable groups such as weaker sections and low income groups at an affordable cost. These trends indicate that the banking system is still hesitant on various grounds to purvey credit to the poor and low income groups especially in the rural areas.
Spatially, the spread and depth of banking is much higher in the Southern, Western and Northern Regions as compared with their North-Eastern, Central and Eastern counterparts even after accounting for diverse economic growth and development across regions. On top of that, the banking density has deteriorated more in the North- Eastern, Central and Eastern Region, where it was already low, in the decade since 1996. This is expected to constrain access and usage of banking services in these regions. These are also the regions where the concentration of poverty is higher. If it is assumed that a plethora of economic opportunities exist in these states, which may be leveraged with access to basic financial services, then this pattern of banking penetration appears to be a formidable challenge in the way of faster and more inclusive growth.
SHG-Bank linkage programme was conceived to fill the gap existing in the formal financial network and extending the outreach of banking to the poor. The spread of the SHG-Bank Linkage Programme in different regions, however, has been uneven on account of various factors like pro-active role of State Governments, presence of well performing NGOs, socio-cultural factors, better performance of SHGs, etc. The spread of SHG movement has been skewed in favour of the Southern Region especially in terms of the region’s share in the total loans to SHGs linked to banks. There is clear evidence of the fact that the SHG movement in India has spread to other regions/States, though not to the same extent as in the Southern States. However, a major concern remains the scale of finance in the non-southern regions. The average bank loans to the SHGs in the Western, Eastern, Northern, Central and particularly in the North Eastern Region is much lower than their southern counterparts. Further progress in the SHG-Bank linkage programme needs to reckon these regional variations in the spread of the programme.
When SHG spread is analysed with reference to poverty the glaring differences between regions highlights the need for taking the SHG movement to the lagging regions. In order to reduce the regional imbalances in the spread of the SHG-Bank linkage programme, NABARD identified 13 States – Assam, Bihar, Chhattisgarh, Gujarat, Himachal Pradesh, Jharkhand, Maharashtra, Madhya Pradesh, Orissa, Rajasthan, Uttar Pradesh, Uttarakhand and West Bengal, which have a large population of the poor, for focused attention. Due to the intensified efforts in these states, their share in the total SHGs credit linked increased from 31 per cent in March 2002 to 47 per cent in March 2007. Based on a mapping of SHG spread and poverty ratio, it is suggested that Bihar, Jharkhand, Madhya Pradesh and Uttar Pradesh need priority attention.
Notwithstanding deficiencies, the SHG-Bank linkage programme augurs well for the tasks of financial inclusion, financial equity as well as efficiency. Some policy suggestions emerging from the above analysis are as follows:
• Banking network have a significant influence on the spread of SHG-Bank linkage programme in the States and regions. The number of branches of scheduled commercial banks is lower in the Central, Eastern and North-Eastern regions when seen against the size of their population. It is noticeable that these are also the regions where SHG-Bank linkage movement needs to be intensified, particularly in terms of the disbursement of loans to the SHGs linked to banks. In view of the above, policies should incentivise branch expansion in these regions.
• Banks may have to assume the lead role in taking the financial services to the vast sections of disadvantaged and low income groups through the mechanism of SHG-Bank linkage. Accordingly, banks need to play a more pro-active role in identification of income generating activities as well as in encouraging NGOs promoting SHGs in the Central, Eastern and North-Eastern regions which could give a fillip to the SHG-bank linkage programme.
• To encourage banks to take keen interest in furthering the SHG movement, perhaps a scheme of performance-linked incentive could be considered. The performance indicator for the banks may be with reference to the credit disbursed under the SHG-Bank linkage programme in the lagging regions. Further, specific funds may be created to address the regional imbalances in the programme.
• SHGs of water users need to be formed and encouraged to take up activities of rural infrastructure building such as construction and renovation of minor irrigation tanks, feeder channels, canals and distributaries. This will have salutary effect on agricultural yields in the rainfed areas. Further efforts should be made towards embedding livelihood activities, micro-insurance and grain banks in the SHG model.
• As on March 31, 2008, the average loan provided to SHGs was Rs. 64,027. On an average, per member loans work out to around Rs. 6,000. It is believed that such loan amounts are not adequate for pursuing any meaningful livelihood activity. The scale of finance needs to be stepped up especially in the non-southern regions, where it is almost half of that at the All-India level.
• As observed by the Committee on Financial Inclusion (Chairman: Dr. C. Rangarajan), in several cases, bankers show unenthusiastic attitude in promoting SHGs. Occasionally, they point out reasons like shortage of staff, time, etc. Special training and awareness programme about the model is needed for the branch officials.
• The Steering Committee on agriculture and allied sectors for formulation of the Eleventh Five Year Plan (2007-2012) has suggested that the share of direct accounts with a credit limit of Rs. 25,000 in total direct finance may be targeted at a substantially higher level to improve credit flow to the small and marginal farmers. Towards this, efforts may be intensified to form SHGs of small and marginal farmers and credit-linking them with banks, especially in the regions with high level of exclusion.
* Authors are working in the Department of Economic Analysis and Policy of the Bank. They are thankful to Shri K.U.B. Rao, Adviser for guidance and constant encouragement. Usual disclaimer applies.
Notes
1 Only those States accounting for at least 34,780 SHGs (or 1 per cent of total SHGs linked with banks in India) have been included in the correlation analysis.
2 SHG-Bank Linkage Programme for Rural Poor-An Impact Assessment (NABARD, 2002).
References
Government of India (2007), Steering Committee on Agriculture and Allied Sectors for Eleventh Five Year Plan (2007-08 to 2011-12).
Mohan, Rakesh (2004) “Agricultural Credit in India: Status, Issues and Future Agenda” RBI Bulletin, November.
————————————(2006) “Economic Growth, Financial Deepening and Financial Inclusion” Speech delivered at the Annual Bankers’ Conference 2006, at Hyderabad on November 3, 2006.
National Bank for Agriculture and Rural Development, Annual Report, Various Issues.
Reserve Bank of India, Basic Statistical Returns, Various Issues.
————————————-Annual Report, Various Issues.
—————————————-Handbook of Statistics on Indian Economy, 2007-08.
—————————————Report on Trend and Progress of Banking in India, 2007-08.
Thorat, Usha (2007) “Financial Inclusion - The Indian Experience” Speech delivered at the HMT-DFID Financial Inclusion Conference 2007, London, UK on June 19, 2007. |