Balbir Kaur and Atri Mukherjee*
The objective of the paper is twofold. The first objective is to assess the sustainability of
public debt in India. In addition, an attempt has also been made to examine the relationship
between public debt and growth in the Indian context. The sustainability analysis, based on
empirical assessment of inter-temporal budget constraint and fiscal policy response function
at the general government level for the period 1980-81 to 2012-13, indicates that the debt
position in India is sustainable in the long run. The empirical results also reveal that there
is a statistically significant non-linear relationship between public debt and growth in India,
implying a negative impact of public debt on economic growth at higher levels. The threshold
level of general government debt-GDP ratio for India works out to be 61 per cent, beyond
which an inverse relationship is observed between debt and growth. This threshold level is
lower than the actual level of debt at 66.0 per cent of GDP in end March 2013. This calls for
a greater focus on a credible fiscal consolidation to safeguard against adverse debt dynamics
should the interest rate-growth differential turn less favourable, keeping in view the recent
slowdown in growth.
JEL Classification : H63, E62, O40
Keywords : public debt, gross fiscal deficit, growth
Introduction
The non-linear relationship between growth and debt has been
a subject of wide interest and debate since the time of publication
of the paper by Reinhart and Rogoff on the subject. In their paper
“Growth in a time of Debt” (2010), Reinhart and Rogoff (R&R) argue
that growth slows down sharply when the government debt to gross
domestic product (GDP) ratio exceeds a threshold level of 90 per cent.
The median growth falls by one per cent and the average growth falls by considerably more for debt-GDP ratios above the threshold of 90
per cent. The non-linear effect of debt on growth is considered to be
reminiscent of “debt intolerance” resulting in non-linear response of
market interest rates when debt tolerance levels are reached. These
results have been supported by a number of other studies (Kumar
and Woo, 2012; Cecchetti et al., 2011; Checherita and Rother, 2010
and Baum et al., 2012), although they differ, though not markedly, in
terms of the threshold level of debt-GDP ratio. Herdon, Ash and Pollin
(2013), however, point out that the conclusions of R&R may not hold
because of coding errors, selective exclusion of available data and
unconventional weighting of summary statistics in the methodology
used by the authors. After correcting for these statistical drawbacks,
they come to the conclusion that there is no evidence of a negative
relationship between debt and growth beyond the threshold level of 90
per cent.
Based on the most up-to-date work that incorporates the corrections
and latest set of data, R&R continue to hold that growth slows down
(by about 1 percentage point) when debt hits 90 per cent of GDP. In
other words, slower growth is associated with higher debt. However,
critiques1 are of the view that an association is definitely not a cause.
The direction of causality could be from growth to debt with slower
growth causing high debt. While this debate is still unsettled, this paper
seeks to test its validity, and estimate the threshold level of public debt
in India. In addition, the paper also provides a comprehensive analysis
of the sustainability of public debt in India through the use of different
approaches including inter-temporal budget constraint and fiscal policy
response function.
The paper is organised as follows. Section II provides a brief
description of various channels through which high public debt levels
are said to impact growth, inflation and other macroeconomic variables.
Section III presents a review of literature relating to determination of
threshold level of debt based on both debt-growth relationship and fiscal/
debt sustainability aspects. Section IV covers evolution of combined debt position of central and state governments in India from 1980-81
to 2012-13. It also analyses the impact of developments in the primary
balances along with interest rate and growth dynamics on the evolution
of public debt in India. Section V examines debt sustainability in the
Indian context in terms of various indicators of public debt sustainability,
inter-temporal budget constraint and fiscal policy response function of
the government. Section VI analyses the debt-growth relationship in
India. Concluding observations are covered in Section VII.
Section II
Interplay of High Public Debt and Macro-Economic Variables
Fiscal expansion financed through debt issuances and the resultant
public debt accumulation have important influences over the economy
both in the short-run as well as the long run. Debt per se may not be
bad. It depends on the utilisation of funds raised through borrowings.
In case it is used for capital formation, it could contribute to the real
income of future generation and add to repayment capacity of the
government as well. On the contrary, the use of borrowings to finance
only current expenditure poses the risk of debt rising to unsustainable
levels.
There are different channels through which elevated and rising
levels of public debt could operate and impact growth, viz., reduced
investment/capital accumulation following the pressure on longterm
interest rates (Baum et al., 2012), reduced (perceived) returns
on investment due to uncertainty about future prospects and policies,
and risk of introduction of distortionary taxes. Besides these, there
are other risk factors, such as, volatility in interest rates, reduced
present and future productive government spending, reduced scope for
countercyclical policies and vulnerabilities associated with debt buildup
that tend to contribute to slowdown in economic activity and growth
at higher levels of debt.
High public debt levels, through higher issuances of government
debt, crowd out private investment, in the absence of debt neutrality or
Ricardian equivalence, particularly when the economy is operating at
or near full employment situation. Pattillo et al., (2002) indicate that
the effect of debt on growth works through reduction in total factor productivity growth and physical capital accumulation. Cournede (2010)
points out the impact of high debt levels on cost of capital and in turn
on the intensity of capital in production. The lower productivity level
affects potential output and growth and the effect could be substantial
in case investment in research and development reduces in response to
higher cost of capital. Kumar and Woo (2012) also point argue that debt
accumulation has a larger adverse impact on domestic investment of
emerging market economies vis-a-vis advanced economies.
The persistence of debt overhang raises the risk of sovereign
insolvency, particularly during economic downturns. Higher the debt,
higher is the risk of repayment ability or probability of default which, in
turn, leads to widening of sovereign spreads, thereby making attainment
of debt sustainability all the more difficult to achieve. Moreover, higher
sovereign spreads get transmitted to higher private lending spreads,
affecting both investment and consumption.
High and rising public debt arising from unsustainable fiscal policies
also increases the risk of an eventual monetisation of persistent deficits,
with consequent impact on inflation. If the long-run interest rate-growth
rate differential turns positive, a higher debt-GDP ratio, for a given
primary deficit-GDP ratio, could increase the anticipated inflation tax
in the form of higher seigniorage revenue through increased issuance of
base money. It could also tempt the government to erode the real value of
current and future debt service through unanticipated burst of inflation,
with inflation having the largest impact on long-term, fixed-rate, and
local-currency denominated debt. Fear of the government inflating
away a part or the whole of its domestic currency denominated debt
burden in future could lead to a rise in nominal interest rates associated
with higher inflationary expectations and higher inflation risk premium
(Buiter and Patel, 2010).
In emerging markets, high public debt levels tend to generate
significant inflationary pressures. R&R (2010) point out that median
inflation more than doubles (from less than seven per cent to 16 per
cent), as debt in emerging markets rises from the low range of 0-30 per
cent to above 90 per cent. The existence of a strong and stable impact of debt growth on inflation in developing and some advanced economies
establishes the indirect negative impact of debt on growth in these
countries.
Section III
Review of Literature
In the theoretical and empirical literature, the threshold level of
debt has been defined based on two strands of thought viz., debt-growth
dynamics and fiscal/debt sustainability perspective in different countries
over a period of time. In terms of debt-growth dynamics, increases in
debt-GDP ratio beyond the threshold level are associated with a negative
impact on growth, while they give rise to debt servicing, liquidity and
solvency concerns from the view point of debt sustainability.
The recent empirical studies have primarily focused on the debtgrowth
relationship and been motivated by the R&R’s (2010) work,
raising concerns regarding negative impact of debt on growth when
debt-GDP ratio exceeds the threshold level of 90 per cent. Baum
et al. (2012) and Chang and Chiang (2009) have looked at the impact
of debt on short-term growth, while the focus of other studies is on
medium-term/long-run economic growth. The short-term growth
effect is studied in terms of either direct impact of debt on growth or
indirect impact running through fiscal multipliers linked to shocks to
government expenditure or taxes while also being influenced by the
initial level of debt.
Reinhart and Rogoff (2010) show that growth rates in both
developed and developing countries with the public debt to GDP ratio
higher than 90 per cent are about 1 percentage point lower than in the
less indebted countries. Growth in emerging markets (EMs) slows down
by an annual two percentage points when their external debt reaches 60
per cent of GDP and the decline is even sharper for external debt levels
in excess of 90 per cent of GDP. Other empirical studies also establish
that public debt beyond a certain threshold is negatively correlated
with economic growth (Egert, 2012; Elmeskov & Sutherland, 2012;
Greenidge et al., 2012; Kumar & Woo, 2012; Cecchetti et al., 2011;
Checherita & Rother, 2010; Baum et al., 2012; Cordella et al., 2005).
The negative effect of debt on growth is attributed, among others, to both the crowding out effect and the debt overhang effect. However,
the direction of causality has not been unambiguously established.
Elmeskov and Sutherland (2012) admit that high debt levels have a
negative impact on growth but they argue that correlation is not the same
as causation. While high levels of public debt could be detrimental to
growth, low economic growth could itself lead to high levels of public
debt i.e., reverse causality. Easterly (2001) argues that the causality
runs from growth to debt. In the Indian context, while Singh (1999)
found that the domestic debt held by the public and economic growth
are not causally related, Rangarajan and Srivastava (2005) indicate
that growth may be adversely impacted on account of large structural
primary deficit and interest payments relative to GDP.
The non-linearity in the impact of debt on growth has been
examined in empirical studies based on various model specifications.
Reinhart and Rogoff (2010) use correlations between debt and growth
while Kumar and Woo (2012) and Egert (2012) study the impact of
public debt on growth along with other determinants of growth in a
general growth framework. The statistical techniques used in empirical
exercises include OLS, quadratic, spline and panel regressions, besides
using exogenously/endogenously determined threshold debt levels
and calculating debt thresholds based on credit ratings of major rating
agencies2. The threshold level of debt varies for different regions/
country groups as also across countries.
The determination of public debt thresholds, based on the
concept of sustainable public debt level, has primarily been guided by
necessary and sufficient conditions of debt sustainability as defined in
the theoretical literature. In the pioneering work on debt sustainability,
Domar (1944) said that GDP should grow faster than public debt for
debt to be sustainable. Subsequently, Buiter et al. (1985) suggested that
sustainable fiscal policy is the one that is capable of keeping the public
sector net worth to output ratio at its current level. Blanchard et al.
(1990) introdicate two conditions for a sustainable fiscal policy: (i) the
ratio of debt to GNP should converge in the long run to its initial level, and (ii) the present discounted value of the ratio of primary budget
deficit to GNP should be equal to the negative of the current level of
debt to GNP.
The debt sustainability conditions revolve around the government’s
inter-temporal or the present value budget constraint (PVBC). This
has been put differently in various empirical studies. In Lengrenzi and
Milas (2011) work, the PVBC requires that the present value of outlays
(current and future) equals the present value of revenues (current and
future). The transversality condition under the PVBC constrains the
debt to grow at a slower rate than the interest rate (Chalk and Hemming,
2000). Buiter and Patel (2010) refer to the standard solvency constraints
viz., (i) the present discounted value of the terminal government nonmonetary
debt be non-positive and (ii) the outstanding value of the
government’s non-monetary debt cannot exceed the present discounted
value of its future primary surpluses. In terms of the first constraint, the
growth rate of public debt cannot be greater than the effective interest rate
on the public debt. Gerson and Nellor (1997) define fiscal sustainability
as a situation of overall fiscal balance rather than a constant debt ratio.
In the Indian context, the sustainability of public debt has been
empirically examined based on various approaches including the Domar
stability condition and time series methods, such as, stationarity of debt
series, unit root and co-integration tests. While the earlier studies of the
1990s (Buiter and Patel, 1992, 1995; Jha, 1999 and Cashin and Olekalns,
2000) drew attention to non-stationarity of debt series and violation of
solvency conditions/inter-temporal budget constraint, the subsequent
studies based on the co-integration and other techniques have admitted
a weakly sustainable condition or sustainable public debt situation (Jha
and Sharma, 2004). After addressing the issue of regime shift, Goyal,
Khundrakpam and Ray (2004) find that while fiscal stance of the
central and state governments at the individual level is unsustainable,
it is weakly sustainable for the combined finances of centre and states.
Some of these studies indicate that the stationarity - based sustainability
tests are satisfied when structural or regime-based breaks in debt-GDP
series are accounted for. Tronzano (2012) finds the existence of firstorder
cointegration between revenue and expenditure flows but could not confirm the existence of a deeper long-run equilibrium between
stock and flow fiscal variables and cautioned that an adverse shock on
the real economy may destabilise the debt pattern in India.
Bohn (2008) argues that the failure of stationarity and co-integration
could not be interpreted as evidence of unsustainable fiscal policy.
The time series tests are backward looking and do not fully exploit
the implications of uncertainty in deriving appropriate tests of fiscal
sustainability. He suggests that the positive response of primary balance
relative to GDP to public debt relative to GDP of a country be considered
as an indicator of dynamic sustainability3. Using this framework and
Fincke and Greiner’s model of time-varying coefficients4 for testing
public debt sustainability, Tiwari (2012) did not find any clear-cut
evidence on the sustainability of public debt in India during the period
1970-2009.
Section IV
Debt Dynamics in India
IV.1: Evolution of India’s Public Debt5
The fiscal position of the central and state governments had
remained comfortable in the first three decades since Independence.
The revenue account of the central government turned into deficit in
the year 1979-80, while the state finances exhibited signs of fiscal
stress since the mid-1980s. Given this backdrop, both the centre and
states started with moderate debt levels, with the consolidated public
debt to GDP ratio at 47.9 per cent in end March 1981. However, the
debt position deteriorated steadily thereafter to reach a high of 72.9
per cent in end March 1992. This was also the period characterised by
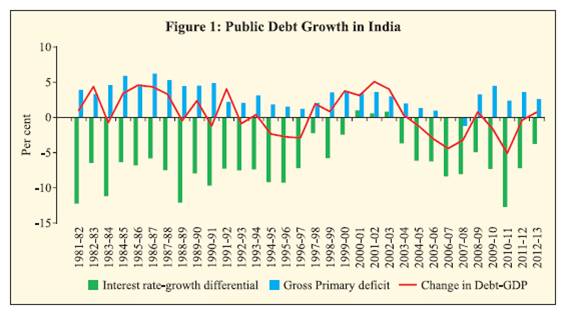
high primary deficits with the primary deficit-GDP ratio at 6.2 per cent in 1986-87 (Figure 1), giving rise to concerns regarding high growth
in public debt of India (Seshan, 1987; Report of the Comptroller and
Auditor General of India, 1988).
 There was some improvement in debt position during the period
1992-93 to 1997-98, which reflected the impact of macro-economic
and structural reforms undertaken in the aftermath of the balance of
payments crisis in the early 1990s. However, this improvement could
not be sustained, as all the key deficit indicators of the central and
state governments deteriorated sharply thereafter, due to additional
expenditure liabilities linked to the implementation of the Fifth Pay
Commission award as also sluggish revenue growth on account of
poor performance of public sector undertakings. Reflecting these
developments, the debt liabilities accumulated sharply and the public
debt-GDP ratio increased to 83.2 per cent in end March 2004.
IV.2: Fiscal Consolidation and Public Debt Growth
Fiscal reforms at the central government level were led by the
enactment of the Fiscal Responsibility and Budget Management (FRBM)
Act, 2003. Around the same time, most states also operationalised fiscal
rules with a focus on a phased improvement in their fiscal deficit and debtgross
state domestic product (debt-GSDP) ratios. The state government
initiatives were also supported by the implementation of Debt Swap Scheme (DSS) from 2002-03 to 2004-05 and Debt Consolidation and
Relief Facility (DCRF) from 2005-06 to 2009-10. While the DSS
allowed the state governments to pre-pay their high cost loans from
the central government, the DCRF provided for debt consolidation and
debt/interest relief on outstanding central government loans, subject to
the enactment of the FRBM Act and reduction in revenue deficit, as per
stipulated rules, during the award period. As a result of these measures,
the outstanding debt-GDP ratio of the states at the consolidated level
declined from 31.8 per cent in end March 2004 to 26.6 per cent in end
March 2008. A similar improvement was evident in debt position of
the central government. This trend has continued thereafter (barring
2008-09) with the public debt-GDP ratio of the general government
(central and state governments) declining to 66.0 per cent in end March
2013.
IV.3 Features of Public Debt in India
It is important to analyse the composition, ownership, and maturity
pattern of public debt that provide an idea about liquidity and pricing
risks associated with the level of debt and its profile. In the Indian
context, the central government debt accounts for around 70 per cent
of the total public debt of the general government. Within public debt,
domestic/internal liabilities remain the predominant component, with
external debt accounting for less than 3 per cent of the total public debt
(Annex Table A.1). Market loans of the central and state governments
account for over 50 per cent of the total public debt in India.
As regards ownership pattern of central and state government
securities, more than 50 per cent of these securities are held by the
scheduled commercial banks, reflective of the mandatory statutory
liquidity reserve requirements. Insurance companies hold about 20 per
cent of these securities (Annex Table A.2). Notwithstanding an increase
in the share of short-term debt in the recent period, it accounts for less
than 10 per cent of the total public debt in India (Annex Table A.3).
The long maturity profile of India’s public debt along with a small
share of floating rate debt (less than 5 per cent) tends to limit rollover
risks, and insulate the debt portfolio from interest rate volatility (Annex
Table A.4).
IV.4: Inflation and Interest Rates: Impact on Public Debt
The declining debt levels across countries during the 1970s were
attributed to the negative real interest rates following high inflation
rates in these countries (Hall and Sargent 2011). In the context of EMs,
empirical studies refer to the phenomenon of the government inflating
away a part or the whole of its domestic currency denominated debt
burden in future, in case financial markets are characterised by financial
repression. Financial repression refers to a set of government policies
that keep the real interest rates low or negative than would otherwise
prevail, for the purpose of reducing the interest burden on government
debt. An environment of low or negative real interest rates, characterised
as financial repression, can be achieved either through lower nominal
interest rates or through higher inflation rate or through a combination
of the two (Reinhart and Sbrancia, 2011). The negative real interest
rates help to liquidate or erode the real value of government debt. The
year, in which the real interest rate turns negative, is considered as a
liquidation year. During the liquidation years, the negative real interest
rate on government debt generates savings to the government, which is
also known as financial repression revenue.
In this section, following the methodology of Reinhart and
Sbrancia (2011), an attempt has been made to examine the presence
of financial repression in the Indian context and if so, its benefit to the
government in terms of lower interest burden. The time period covered
for the analysis is 1982-83 to 2012-13. For this purpose, the real interest
rate in India has been worked out using the Fisher equation such that:
r t = (1+i t-1) / (1+π t) -1
Where i = nominal interest rate; r = real interest rate; and
π = inflation rate. Effective interest rate on general government debt
has been used as a proxy for nominal interest rate. Inflation rates have
been measured in terms of GDP deflator. The calculations reveal that
real interest rates in India were negative during the period 1982-83 to
1995-96 but turned positive thereafter. The real interest rate has again
turned negative in the recent period (Figure 2). The years marked by
negative real interest rates are considered as liquidation years.
The savings/revenues to the government during these years through
liquidation effect are measured in terms of real interest rate times the
stock of outstanding debt of the government. The financial repression
revenues, thus calculated, are expressed as a share of GDP as well as a
share of tax revenues (Table 1).
It may be observed from Table 1 that in India, during the period
1982-83 to 1995-96, the annual liquidation of debt via negative real
interest rates amounted to 1.5 per cent of GDP and 10.3 per cent of the
tax revenues of the government6. Annual debt reduction of 1.5 per cent
of GDP accumulates to around 21.2 per cent reduction in the debt to
GDP ratio during this period7.
Table 1: Government Revenue from Liquidation Effect |
(per year) |
Period |
Financial Repression
Revenues/GDP (%) |
Financial Repression
Revenues/Tax Revenues (%) |
1982-83 to 1995-96 |
1.5 |
10.3 |
1996-97 to 2007-08 |
-2.5 |
-17.0 |
2008-09 to 2012-13 |
0.1 |
0.3 |
Following a gradual development of market-based instruments
to finance government deficits, move towards a market-determined
interest rate system through auction of government securities, phasing
out of the automatic monetisation of fiscal deficit through the two
Supplemental Agreements between the Government and the Reserve
Bank and discontinuation of the Reserve Bank’s subscription to primary
issuances of government securities from April 1, 2006, the liquidation
effect ceased to exist during the period 1996-97 to 2007-08, when
the real interest rates turned positive. During the last 5 years (except
2009-10), the real interest rate has again turned negative, despite sharp
increases in market borrowings of the central government. The annual
financial repression revenue accruing to the government was, however,
of much smaller magnitude at 0.1 per cent of GDP and 0.3 per cent of
tax revenues during this period.
IV.5: Growth and Interest Differentials: Impact on Public Debt
The growth of public debt in nominal terms depends on two
parameters, viz., interest rate on public debt and the size of the primary
surplus/deficit. In case the primary balance is in deficit, both interest
liabilities and primary deficits contribute to accumulation of additional
debt liabilities in any economy. However, when public debt relative to
GDP is considered, its evolution also depends on an additional variable
i.e., the growth-interest rate differential. This implies that in case the
interest rate is lower than the growth rate of the economy, it helps
to offset the impact of primary deficit on debt growth and it may be
possible to keep debt to GDP ratio stable even in a situation of primary
deficits.
Theoretically, in case the real (nominal) rate of interest is lower than
the rate of growth of real (nominal) GDP, the debt stabilising primary
balance can be negative8. However, it is desirable that government
primary expenditure minus government revenue as a proportion to GDP
is less than or equal to zero, on an average, so that the debt burden is
ultimately liquidated.
In the Indian context, it has been observed that the favourable
growth-interest rate differential has muted the impact of persistence
of primary deficits on public debt-GDP ratio (Table 2). Rangarajan
and Srivastava (2003, 2005) in their study covering the period
1955-2000 find that even with persistence of primary deficits for a long
period of time, the debt to GDP ratio could be contained in India as the
GDP growth exceeded the interest rates. Available data shows that the
primary surplus was recorded only in two years: 2006-07 and 2007-
08. Considering the fact that the interest rate - growth rate differential
has gradually narrowed down with a progressive move towards market
determination of yields on government debt issuances and given the
difficulties in sustaining high rates of growth, it would be challenging to
maintain fiscal/debt sustainability in absence of a turnaround in primary
balance position in the medium to long run.
IV.6: Public Debt in India vis-a-vis Other Country Groups
Public Debt in India (as a per cent to GDP) has witnessed a steady
decline since 2004, aided, in large part, by the FRBM Act 2003 of
the central government and similar fiscal responsibility legislations
at the state level and high nominal GDP growth vis-à-vis incremental
debt. Although fiscal deficit to GDP ratio increased in 2008-09 and 2009-10 due to counter-cyclical measures taken by the government to
insulate Indian economy from the adverse impact of global economic
crisis, the declining trend in debt-GDP ratio was maintained, which
was largely supported by higher nominal GDP growth up to 2011-12.
In 2012-13, with the nominal GDP growth in India falling below the
growth in public debt, the debt-GDP ratio increased again. India’s
public debt - GDP ratio has, in general, been significantly higher than
the average for emerging markets, developing Asia and advanced
economies (Figure 3a).
Table 2: Decomposition of Debt Accumulation Relative to GDP |
(per cent) |
|
Changes in
Debt-GDP ratio |
Cumulative
Primary
deficit-
GDP ratio |
Cumulative
Interest rate
and Growth
differential |
1980-81 to 1989-90 |
22.13 |
48.01 |
-38.34 |
1990-91 to1999-00 |
2.00 |
26.15 |
-41.03 |
2000-01 to 2009-10 |
-3.36 |
20.87 |
-28.66 |
2010-11 to 2012-13 |
0.46 |
8.58 |
-13.70 |
Memo: |
|
|
|
Debt-GDP Ratio at the end of |
|
|
|
1980-81 |
47.94 |
|
|
2012-13 |
66.00 |
|
|
Source: Handbook of Statistics on the Indian Economy, RBI, and National Accounts Statistics,
CSO. |
Public debt to government revenue ratio, which is a useful indicator
of the vulnerability of a country’s public finances and the solvency of
the government, shows that India’s public debt as a ratio to revenue
is very high, although it has declined during the recent period (Figure
3b). So, the country’s capacity to support high levels of public debt is
constrained by its ability to raise revenues.
A comparison of debt and other fiscal indicators across major
emerging market and developing economies (EMDEs) suggests that
India is an outlier in almost all parameters. Countries which have high
debt-GDP ratio, such as, Brazil and Hungary have a lower debt-revenue
ratio than India (Table 3).
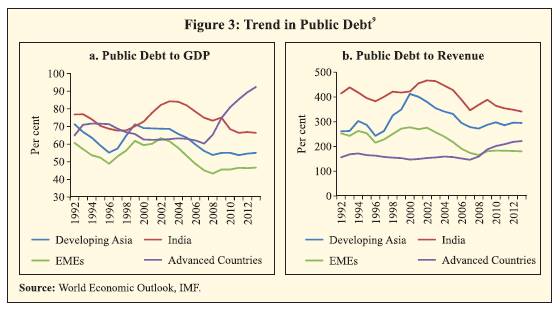
Table 3: Fiscal Indicators for Select Emerging Market Economies |
(Per cent) |
Countries |
2006 |
2012 |
2013 |
Debt-
GDP |
Debt-
Revenue |
Overall
Balance-
GDP |
Primary
Balance-
GDP |
Debt-
GDP |
Debt-
Revenue |
Overall
Balance-
GDP |
Primary
Balance-
GDP |
Debt-
GDP |
Debt-
Revenue |
Overall
Balance-
GDP |
Primary
Balance-
GDP |
Argentina |
76.4 |
256.4 |
-1.1 |
4.0 |
47.7 |
118.7 |
-4.3 |
-0.9 |
47.8 |
114.6 |
-3.6 |
-1.3 |
Brazil |
67.0 |
193.6 |
-3.5 |
3.3 |
68.0 |
180.4 |
-2.7 |
2.2 |
68.2 |
183.8 |
-3.0 |
1.9 |
China |
16.2 |
89.0 |
-0.7 |
-0.2 |
26.1 |
115.0 |
-2.2 |
-1.4 |
22.9 |
103.2 |
-2.5 |
-1.8 |
Colombia |
36.8 |
134.8 |
|
1.7 |
32.8 |
115.9 |
0.2 |
1.8 |
32.5 |
115.7 |
-1.0 |
0.7 |
Egypt |
90.3 |
315.7 |
-9.2 |
-4.2 |
80.6 |
356.6 |
-10.7 |
-5.2 |
88.7 |
371.1 |
-14.7 |
-7.3 |
Hungary |
65.9 |
154.0 |
-9.4 |
-5.7 |
79.2 |
170.3 |
-2.0 |
2.0 |
79.8 |
167.6 |
-2.7 |
1.2 |
India |
77.1 |
379.8 |
-6.2 |
-1.3 |
66.7 |
343.8 |
-8.0 |
-3.6 |
67.2 |
342.9 |
-8.5 |
-3.8 |
Indonesia |
39.0 |
192.1 |
0.2 |
2.6 |
24.0 |
134.8 |
-1.7 |
-0.4 |
25.8 |
142.5 |
-2.2 |
-0.8 |
Malaysia |
41.5 |
172.2 |
-2.7 |
-1.7 |
55.5 |
219.4 |
-4.5 |
-3.1 |
57.1 |
229.3 |
-4.3 |
-3.0 |
Mexico |
37.8 |
175.0 |
-1.0 |
1.8 |
43.5 |
184.3 |
-3.7 |
-1.2 |
43.6 |
193.8 |
-3.8 |
-1.2 |
Pakistan |
54.4 |
400.0 |
-3.4 |
-0.5 |
63.8 |
487.0 |
-8.4 |
-4.0 |
66.5 |
503.8 |
-8.5 |
-3.9 |
Peru |
33.1 |
164.7 |
1.9 |
3.7 |
20.5 |
94.5 |
2.1 |
3.0 |
18.3 |
88.4 |
0.3 |
1.1 |
Philippines |
51.6 |
271.6 |
0.0 |
4.8 |
41.9 |
234.1 |
-0.9 |
1.7 |
41.0 |
226.5 |
-0.8 |
1.8 |
Poland |
47.7 |
118.7 |
-3.6 |
-1.0 |
55.6 |
144.8 |
-3.9 |
-1.1 |
57.8 |
157.1 |
-4.6 |
-1.9 |
Russia |
9.0 |
22.8 |
8.3 |
8.9 |
12.5 |
33.9 |
0.4 |
0.8 |
13.8 |
37.5 |
-0.7 |
-0.2 |
South Africa |
32.6 |
111.6 |
1.2 |
4.1 |
42.3 |
151.6 |
-4.8 |
-2.1 |
43.0 |
154.7 |
-4.9 |
-2.1 |
Thailand |
42.0 |
188.3 |
2.2 |
3.5 |
45.4 |
197.4 |
-1.7 |
-0.8 |
47.2 |
219.5 |
-2.7 |
-2.2 |
Turkey |
46.5 |
141.8 |
-0.7 |
4.4 |
36.1 |
103.7 |
-1.6 |
1.2 |
36.1 |
99.7 |
-2.3 |
0.7 |
Source: World Economic Outlook Database and Fiscal Monitor, 2013, International Monetary Fund. |
Section V
Public Debt Sustainability
Sustainable level of public debt varies across different countries
depending on the country-specific circumstances. Besides the magnitude
of debt, the characteristics of public debt – currency composition,
maturity pattern and debt servicing at fixed or floating rates – also
contribute significantly to determining the sustainable level of debt.
This section looks at public debt sustainability in the Indian context,
based on different approaches to assessment of sustainability of public
debt.
V.1: Indicator Analysis
Following the conventional debt sustainability analysis, the
sustainability of public debt in India has been examined using indicator
analysis, taking period averages of various indicators during four
different phases (Table 4). These phases have been identified on the
basis of the inflexion points in the general government debt. Phases I and
III witnessed distinct pressure on debt sustainability, with the average
nominal public debt growth exceeding the average nominal GDP
growth during these periods. The stability condition which requires the real interest rate to remain below the real output growth, was, however,
satisfied in all the four phases.
Table 4: Fiscal Sustainability of General Government :
Indicator-based Analysis |
Sl.
No. |
Indicators |
Symbolic
Represe ntation |
Phase-I
(1981-82
to
1991-92) |
Phase II
(1992-93
to
1996-97) |
Phase III
(1997-98
to
2003-04) |
Phase IV
(2004-05
to
2012-13) |
1 |
Rate of growth of public debt (D) should be lower than rate of growth of nominal GDP (G) |
D - G < 0 |
4.45 |
- 2.84 |
4.14 |
- 2.98 |
2 |
Rate of growth of public debt (D) should be lower than effective interest rate (i) |
D - i < 0 |
12.94 |
5.26 |
5.82 |
4.21 |
3 |
Real rate of interest (r) should be lower than real output growth (g) |
r - g < 0 |
-7.67 |
-7.58 |
-1.57 |
-6.67 |
4(a) |
Primary balance (PB) should be in surplus |
PB / G > 0 |
-0.05 |
-0.02 |
-0.03 |
-0.02 |
4(b) |
Primary revenue balance (PRB) |
PRB / G > 0 |
-0.01 |
-0.01 |
0.00 |
-0.02 |
|
should be in surplus and should be adequate enough to cover interest payments (IP) |
PRB/IP>100 |
-42.93 |
-29.05 |
3.47 |
-36.42 |
5(a) |
Revenue Receipts (RR) as a per cent to GDP should increase over time |
RR/ G ↑↑ |
18.41 |
17.76 |
17.22 |
19.86 |
5(b) |
Revenue variability should decline over time |
CV (RR/G) ↓↓ |
4.86 |
2.54 |
4.40 |
4.31 |
5(c) |
Public debt to revenue receipts ratio should decline over time |
D / RR ↓↓ |
3.37 |
3.90 |
4.34 |
3.63 |
5(d) |
Public debt to tax revenue ratio should decline over time |
D / TR ↓↓ |
4.22 |
4.88 |
5.41 |
4.45 |
6(a) |
Interest burden defined by interest payments (IP) as a per cent to GDP should decline over time |
IP / G ↓↓ |
3.28 |
4.86 |
5.71 |
5.06 |
6(b) |
Interest payments (IP) as a per cent of revenue expenditure (RE) should decline over time |
IP / RE ↓↓ |
15.84 |
22.92 |
24.66 |
22.10 |
6(c) |
Interest payments (IP) as a per cent of revenue receipts (RR) should decline over time |
IP / RR ↓↓ |
17.72 |
27.38 |
33.13 |
25.54 |
The necessary conditions for sustainability as given in indicators 1
and 3 of Table 4 were fulfilled during the periods of fiscal consolidation,
viz., phases II and IV, but the sufficient condition of generating
primary surpluses was not met during any of the four phases. In fact,
with the exception of 2006-07 and 2007-08, primary balances of the
general government remained in deficit during the last three decades
(Figure 4). Favourable interest rate-growth differential has, however,
more than compensated for the absence of primary surpluses, resulting
in a sharp decline in debt-GDP ratio between 2004-05 and 2010-11,
barring a brief increase in the immediate aftermath of the global financial
crisis. With a decline in the interest rate-growth differential and an
increase in primary deficits, the growth in public debt has increased in
2012-13.
Although the debt-GDP ratio declined in phase II reflecting the
impact of reforms, debt sustainability indicators in terms of debt service
burden (as expressed by indicators 5 and 6 in Table 4) deteriorated.
There was a regime shift from large dependence on monetised
financing (through the issuance of 91-day Treasury bills (T-bills)) to bond financing, resulting in a rise in the average effective cost of
debt during this phase. This was also evident from the decline in the
share of T-bills (91-day and 182/364-day T-bills) in outstanding debt
of central government to 6.6 per cent in phase II (from 10.5 per cent in
phase 1). The debt service burden deteriorated further in phase III as it
was characterised by an up-trend in interest rates. However, this trend
reversed in phase IV due to the combined impact of improvement in
revenue buoyancy and reduction in interest rates from the highs seen
in the 1990s and early 2000s. The average interest payments have,
however, continued to pre-empt around one-fourth of revenue receipts
during phase IV, which is higher than the tolerable ratio of interest
burden10. The high level of incremental debt which was acquired during
2008-09 and 2009-10 has contributed significantly to the rising interest
burden in recent years.
Post-crisis fiscal correction in India had been slow and the observed
improvement in 2010-11 was primarily due to large one-off receipts
from spectrum auctions. The central government has, however, reverted
to a revised path of medium-term fiscal consolidation in line with the
Kelkar Committee recommendations in 2012-13. A progressive move
towards fiscal sustainability, if maintained, would facilitate further improvement in the public debt-GDP ratio. This would be more credible
and sustainable from the viewpoint of debt sustainability in case it is
driven by the objective of achievement of primary surpluses.
V.2: Inter-temporal Budget Constraint
Going beyond the indicator - based analysis, the fiscal/debt
sustainability issue has been examined empirically through the
assessment of inter-temporal government budget constraint. In the
empirical work, this is analysed through test of stationarity properties
of the government debt stock (in level and first difference), examination
of the long-term relationship between government revenues and
expenditures and that between primary balances and debt.
In this Section, we have made an attempt to test empirically,
whether India’s fiscal policy stance is sustainable, i.e., whether it
satisfies the inter-temporal budget constraint. This test of fiscal policy
sustainability examines whether the past behaviour of government
revenue, expenditure and the fiscal deficit could be continued indefinitely
without prompting an adverse response from the investors who finance
government borrowings. The inter-temporal budget constraint as
derived by Cashin and Olekalns (2000) is as follows:
Where G is government expenditure including interest payments,
R is government revenue, B is the stock of debt, and r is the real rate
of interest. The inter-temporal budget constraint, under the assumption
that the funding of interest payments are not made from the new debt
issuances (i.e., no-ponzi scheme), imposes restrictions on the time
series properties of government expenditures and revenues. This
requires that government expenditure, revenue and stock of debt are all
stationary in the first differences. The stationarity property also restricts
the extent of deviation of Gt from Rt over time. In case Gt and Rt are
I (1) and cointegrated, then the error correction mechanism would push
government finances towards the level required by the inter-temporal
budget constraint and ensure fiscal and debt sustainability in the long
term.
The stationarity properties of the stock of government debt,
government expenditure and revenues in the Indian context have been tested using annual data for the period 1980-81 to 2012-13. The variables
have been converted into real terms with logarithmic transformation.
The results of the Augmented Dickey Fuller (ADF) unit root test
indicate that the null hypothesis of unit root cannot be rejected for all
the three variables. It was also found that all the series are integrated of
order 1, i.e., stationary in the first difference (Table 5).
Since log Rt and log Gt were found to be I (1), the cointegration
between the two series has been tested through the standard Engle
and Granger’s (1987) procedure. Following Hakkio and Rush (1991),
cointegration between log Rt and log Gt is tested by estimating the
regression:
Log (Rt) = α + β log (Gt) + ε t, where 0 < β ≤ 1
Cointegration requires that residuals from the above equation are
stationary. The equation is estimated using simple OLS. The residuals
series obtained from the estimated equation was found to be stationary
I(0)11. Thus, the two series, viz., log Rt and log Gt were found to be
cointegrated indicating a long-term co-movement between the two series
and suggesting that the current fiscal policies in India are sustainable
in the long run. This result is also supported by the study of Jha and
Sharma (2004)12.
Table 5: Unit Root Test |
Variable (X) |
ADF |
Log X |
D log (X) |
Stock of Government Debt (B) |
-0.90 |
-3.71* |
Government Expenditure (G) |
0.65 |
-5.20* |
Government Revenue (R) |
0.86 |
-5.52* |
Note: * denotes significant at 1% level. |
V.3: Fiscal Policy Response Function
The time series tests of fiscal sustainability have been criticised in
the empirical literature for not explicitly identifying the fiscal policy
reaction functions that underlie the data. Bohn (1995, 1998), therefore,
suggested an alternative model-based approach to fiscal sustainability.
This approach looks at the inter-temporal budget constraint in terms of a
feedback relationship from the stock of initial debt to the primary surplus
in an economy characterised by risk-averse lenders and uncertainty. In
this fiscal reaction function approach, it is analysed whether primary
surplus relative to GDP is a positive function of public debt (relative to
GDP). In case fiscal authorities take corrective measures in response to
deterioration in debt position, rising debt ratios lead to higher primary
surpluses relative to GDP that indicates a tendency towards mean
reversion. According to Bohn, a stable and strictly positive feedback
from debt stock to primary surplus is a sufficient condition for fiscal
(debt) sustainability. We have also used this approach in the following
analysis.
Model Specification: The following equation is estimated:
St = α 0 + β D t-1 + α1 GDPGAP t + α2 EXPGAP t + ε
Here S is the primary surplus to GDP ratio; D is the public debt to
GDP ratio; GDPGAP is the deviation of actual output from the trend;
EXPGAP is the deviation of actual primary expenditure from the trend;
and ε is the error term. The business cycle variable GDPGAP has
been included to account for the fluctuations in revenues. The variable
EXPGAP captures the impact of deviations of real primary expenditure
from its long-term trend on the primary surplus ratio. Here ‘β’ is the key
coefficient, which measures the response of primary surplus to debt.
A value of this coefficient between zero and unity is consistent with a
sustainable fiscal policy response to debt. A negative coefficient implies
potentially destabilising response.
Data: Annual data for the period 1981-82 to 2012-13 has been used
for the analysis. All the data pertain to the general government (centre
and states combined). Primary balance of the general government has
been considered as the dependent variable. Combined liabilities of the
central and state governments have been used to represent public debt
of India. GDP at market prices has been used for the analysis. GDPGAP
has been worked out by extracting the deviation in real GDP from its trend through HP-filter. The deviation is expressed as a per cent of
real GDP. EXPGAP has been calculated in a similar manner using real
primary expenditure of the general government. The movements in the
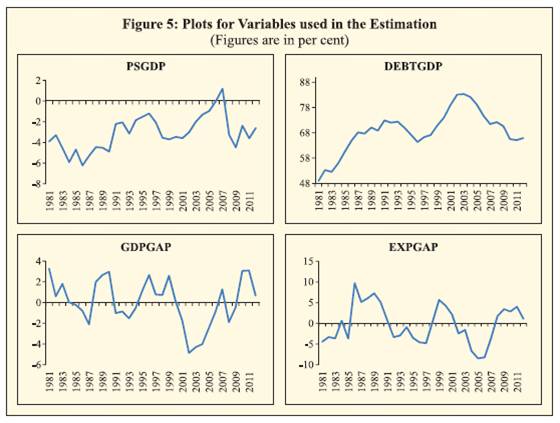
dependent and the explanatory variables are plotted in Figure 5.
 Results: Before proceeding with the estimation, all the series
were tested for stationarity. While all the explanatory variable series
were found to be stationary, i.e., I (0), the dependent variable series,
i.e., primary surplus to GDP ratio was found to be non-stationary.
However, after controlling for the years 2006-07 and 2007-08 (which
were the years when the general government in India recorded primary
surpluses), the series became stationary. In view of this, a dummy
variable (d surplus) has been introduced in the model to control for
the impact of these years. In addition, allowance has been made in the
estimations for the response of primary balance to GDP ratio to be nonlinear
and vary with debt levels by introducing a square term of the debt
to GDP ratio as an additional explanatory variable.
The OLS estimation results of the fiscal policy response function
are presented in Table 6. The coefficients of all the explanatory variables were found to be significant at one per cent level. Positive coefficient
of D indicates that primary surplus increases (or primary deficit falls)
in India in response to rising debt ratios. This implies that the primary
balance in India responds in a stabilising manner to increases in debt.
Positive coefficient of GDPGAP implies that primary balance improves
when GDP is above the trend. The negative coefficient of EXPGAP,
on the other hand, indicates that primary balance deteriorates when
primary expenditure is above the trend. These findings are in line with
the a priori expectations.
Table 6: Estimation Results |
Explanatory Variables |
Estimated Coefficients |
Model 1 (Linear) |
Model 2 (Non-linear) |
Constant |
-10.59* |
-30.83* |
|
(0.00) |
(0.00) |
Dt-1 |
0.11* |
0.71* |
|
(0.00) |
(0.00) |
Dt-1 2 |
|
-0.004* |
|
|
(0.01) |
GDPGAP |
0.25* |
0.19* |
|
(0.00) |
(0.01) |
EXPGAP |
-0.22* |
-0.25* |
|
(0.00) |
(0.00) |
d surplus |
1.69* |
1.62* |
|
(0.01) |
(0.00) |
AR(1) |
|
-0.25 |
|
|
(0.18) |
Adjusted R2 |
0.81 |
0.88 |
DW |
2.05 |
2.24 |
p-value of LM statistics (1st lag) |
0.49 |
0.10 |
Note: 1) Figures in the parentheses represent respective P values.
2) * denotes significant at 1% level. |
In the non-linear equation approach (Model 2), the response of the
primary balance to debt is better represented in terms of a quadratic
function rather than a linear response function. The results suggest that
the primary balance function has an inverted ‘u’ shape, implying that
the adjustment parameter first rises and then falls.
Both the models exhibited no residual serial correlation at the first
lag included. The p-values of the Breusch-Godfrey LM-statistics (as
presented in Table 6) are insufficient to reject the null hypothesis of no
autocorrelation.
Section VI
Impact of Public Debt on Growth: Threshold Level of Debt
There is a general belief among the economists that slower growth
is associated with higher level of debt. Several economists argue that
growth slows down sharply when the government debt to GDP ratio
exceeds a certain threshold level. There is, however, no consensus
regarding the threshold level of debt, beyond which the growth suffers.
In addition, the threshold level may vary widely across advanced and
emerging market economies. In this section, an attempt has been made
to examine the link between government debt real economic growth
in India during the period 1981-82 to 2012-13. In India, the level of
government debt seems to have an inverse relation with the growth in
GDP at market prices (Figure 6).
Model Specification: Empirical studies have considered different
set of control variables to analyse the impact of public debt on economic
growth. Some of these control variables include: population, investment,
export, openness, fiscal balance and years of schooling. In this paper, the impact of public debt on growth has been assessed by estimating the
following equation:
yt - yt-1 = α Dt + β1 Dt2 + β2 (it - it-1) + β3 πt + β4 (Tt –Tt-1) + β5 GFDt +εt
where y is the real GDP; D is public debt to GDP ratio; D2 is the
square of public debt to GDP ratio13; i is real investment; π is inflation
rate; T is international trade in real terms; GFD is the ratio of gross
fiscal deficit to GDP.
Data: The dependent variable real GDP is measured by GDP at
constant market prices. Combined outstanding liabilities of the central
and state governments of India have been used as a measure of the level
of public debt. Gross domestic capital formation at constant prices has
been used as a proxy for real investment. Inflation rate is measured by
growth in WPI. International trade is measured as the sum of non-oil
exports and imports in rupee terms at constant prices. Gross fiscal deficit
pertains to the general government. All the data are obtained from the
Handbook of Statistics on the Indian Economy. Summary statistics of
the relevant variables are furnished in Table 7. The correlation matrix
given in Annex 2 indicates absence of any serious multicollinearity
problem in the selected set of explanatory variables. It has been observed
that there is no statistically significant contemporaneous correlation
between debt-GDP ratio and GFD-GDP ratio.
Results: Before estimation, all the variables have been tested for
their stationarity properties. Augmented Dickey Fuller (ADF) unit analysis are stationary or not. The results of the ADF test indicate that
the null hypothesis of unit root can be rejected for all the variables.
After ensuring that all the series are I (0), the equation is estimated by
OLS and the results are presented in Table 8.
Table 7: Summary Statistics |
Variable |
High |
Low |
Mean |
Standard
Deviation |
Real GDP Growth |
10.5 |
1.1 |
6.2 |
2.3 |
Public Debt to GDP |
83.3 |
48.9 |
68.8 |
8.3 |
Growth in Real Investment |
29.8 |
-16.5 |
8.4 |
9.3 |
Inflation rate |
13.7 |
3.3 |
6.8 |
2.6 |
Growth in international trade |
35.6 |
-0.4 |
18.7 |
9.1 |
Gross fiscal Deficit to GDP |
9.6 |
4.0 |
7.6 |
1.4 |
The coefficients of all the explanatory variables are significant and
on the expected lines. The positive sign of Dt indicates that accumulation
of public debt leads to higher growth in real GDP up to a certain level.
The negative sign of Dt2 shows that the association of public debt and
real GDP turns negative beyond a certain threshold. The growth in real
investment has the expected positive sign which is significant at 1 per
cent level. Trade openness, as expressed in terms of growth in non-oil
exports and imports, also has a significant positive impact on growth.
High inflation and high fiscal deficit, on the other hand, have adverse
impact on growth. The dummy variable (d97) which has been used to
control the impact of growth slowdown in 1997-98 was found to be
significant.
Based on the coefficients of Dt and Dt2, the threshold level of public
debt for India works out to be around 61 per cent of GDP.
Table 8: Estimation Results |
Explanatory Variables |
Estimated Coefficients |
P-Value |
Public Debt to GDP Ratio (Dt) |
0.32* |
0.00 |
Square of Public Debt to GDP ratio (Dt2) |
-0.003* |
0.00 |
Growth in Real Investment (it – it-1) |
0.14* |
0.00 |
Inflation rate (πt) |
-0.36* |
0.01 |
Growth in international trade (Tt –Tt-1) |
0.08** |
0.03 |
Gross fiscal Deficit to GDP (GFDt) |
-0.46** |
0.04 |
Dummy Variable (d97) |
-4.24* |
0.01 |
Adjusted R2 |
0.57 |
|
DW Statistics |
2.13 |
|
LM statistics (1st lag) |
|
0.53 |
Note: * and ** denote significant at 1% and 5% level, respectively. |
These econometric findings are broadly in line with the results
on threshold level of debt of Mohanty (2013) and debt simulation
forecasts of Topalova and Nyberg (2010). While Mohanty has placed the threshold level of debt for India at 60 per cent of GDP, Topalova and
Nyberg have estimated the general government debt target/ceiling of at
most 60-65 per cent of GDP to signal commitment to fiscal discipline.
The debt simulation exercises undertaken by this IMF study are based
on the premise that the interest rate-growth differential would remain
favourable and contribute, on average, about 3 percentage points
reduction in the debt to GDP ratio per annum. It may be pertinent to
note that the Thirteenth Finance Commission (FC-XIII) had set a target
of 68 per cent of GDP for the combined debt of centre and states to be
attained by 2014-15.
Section VII
Conclusion
In this study, the sustainability of public debt in India at the general
government level was assessed through indicator-based analysis as well
as empirical exercises.
The empirical analysis carried out in this paper focused on
estimation of inter-temporal budget constraint and fiscal policy
response function to assess the sustainability of the present fiscal policy
in India. The estimation results reveal that there is a co-integrating
relationship between general government expenditure and revenue in
India, which satisfies the inter-temporal budget constraint. Moreover,
the estimated fiscal policy response function reveals that the primary
fiscal balance in India responds in a stabilising manner to the increase
in debt. Thus, both the results indicate that the current fiscal policies in
India are sustainable in the long run. However, it would be interesting
to take up a more comprehensive sustainability analysis covering
broader aspects, viz., costs of high public debt levels with respect to,
inter alia, crowding out of private investment, distortions on account of
large sectoral interventions like National Food Security Act, Mahatma
Gandhi National Rural Employment Guarantee Act, etc, as areas of
further research.
The paper has also examined empirically the impact of public debt
on growth in the Indian context. The results of the empirical exercise
revealed that there is a statistically significant non-linear relationship
between public debt and growth, implying a negative impact of public debt on economic growth at higher levels. The threshold level of
general government debt-GDP ratio for India has turned out to be 61
per cent, i.e., the level beyond which an inverse relationship is observed
between debt and growth. This threshold level is lower than the actual
level of debt at 66.0 per cent in end March 2013. There are other risks
linked to volatility in international financial markets, and the narrowing
down of the interest rate-growth differential domestically. In these
circumstances, it would be desirable to strengthen the process of fiscal
consolidation both at the level of centre and states in the medium-term
so that borrowing is used only to meet capital expenditure which would
aid future growth. In addition, a turnaround in primary balance position
from deficit to surplus in the medium-term would be critical. It would
be important in the context of inter-temporal budget constraint faced
by the government and the need to provide for fiscal space to meet
challenges in an uncertain domestic and global environment.
References
Adams, Charles, Benno Ferrarini, and Donghyun Park. 2010. “Fiscal
Sustainability in Developing Asia”. ADB Economics Working Paper
Series No. 205, June 2010.
Aschauer, David Alan. 1988. “Is Public Expenditure Productive?”.
Journal of Monetary Economics, Vol. 23 (1989).
Aschauer, David Alan. 1989. “Does Public Capital Crowd Out Private
Capital?”. Journal of Monetray Economics, Vol. 24 (1989).
Baum, Anja Westphal, Cristina Checherita and Rother, Philipp. 2012.
“Debt and Growth: New Evidence for the Euro Area”. 14th Public
Finance Workshop, Banca DÍtalia, 29-31 March 2012.
Blanchard, Olivier J., Jean-Claude Chouraqui, Robert P. Hagemann and
Nicola Sartor. 1990. “The Sustainability of Fiscal Policy: New Answers
to an Old Question”. OECD Economic Studies, No. 15 (Autumn).
Boamah, D., and W. Moore. 2009. “External Debt and Growth in the
Caribbean”. Money Affairs, Jul–Dec.
Bohn, Henning. 1995. “The Sustainability of Budget Deficits in
a Stochastic Economy”. Journal of Money, Credit, and Banking,
Vol. 27, No.1.
Bohn, Henning. 1998. “The Behavior of U.S. Public Debt and Deficits”.
Quarterly Journal of Economics, Vol. 113 (August).
Bohn, Henning. 2008, “The Sustainability of Fiscal Policy in the United
States”. In: R. Neck and J. Sturm, “Sustainability of Public Debt”, MIT
Press.
Buiter, W. H. and U. Patel. 1992. “Debt, Deficits and Inflation: An
Application to Public Finances in India”. Journal of Public Economics,
Vol. 47, No.2.
Buiter, W. H. and U. Patel. 1995. Public Economics in India. Oxford
University Press, chapter Solvency and Fiscal Correction in India: An
Analytical Discussion.
Buiter, W. H. and U. Patel. 2010. “Fiscal Rules In India: Are They
Effective?”. National Bureau of Economic Research Working Paper
No. 15934, April 2010.
Cashin, Paul and Nilss Olekalns. 2000. “An Examination of the
Sustainability of Indian Fiscal Policy”. University of Melbourne
Department of Economics Working Papers No. 748.
Cecchetti, Stephen G., M. S. Mohanty and Fabrizio Zampolli. 2011.
“The Real Effects of Debt”. Monetary and Economic Department, BIS
Working Papers No 352, September 2011.
Chalk, Nigel and Richard Hemming. 2000. “Assessing Fiscal
Sustainability in Theory and Practice”. IMF Working Paper No.
WP/00/81.
Chang, T. and G. Chiang. 2009. “The Behavior of OECD Public Debt:
A Panel Smooth Transition Regression Approach”. The Empirical
Economics Letters 8 (1).
Checherita, C. and P. Rother. 2010. “The Impact of High and Growing
Government Debt on Economic Growth - An Empirical Investigation
for the Euro Area”. ECB Working Paper No. 1237.
Cordella, Tito, Antonio Ricci Luca and Marta Ruiz-Arranz. 2005. “Debt
Overhang or Debt Irrelevance? Revisiting the Debt-Growth Link”. IMF
Working Paper, WP/05/223, December 2005.
Cournède, Boris. 2010. “Gauging The Impact of Higher Capital and
Oil Costs on Potential Output”. Economics Department Working
Papers Eco/Wkp(2010)45, Organisation for Economic Co-operation
and Development.
Dholakia, R. H., T. T. Ram Mohan and Navendu Karan. 2004. “Fiscal
Sustainability of Debt of States”. Report submitted to the Twelfth
Finance Commission, New Delhi.
Domar, Evsey D. 1944. “The Burden of the Debt and the National
Income”. American Economic Review, Vol. 34, No.4.
Easterly, William R. 2001. “Growth Implosions and Debt Explosions:
Do Growth Slowdowns Cause Public Debt Crises?”. Contributions to
Macroeconomics, Vol. 1, No.1.
Égert, Balázs. 2012. “Public Debt, Economic Growth and Nonlinear
Effects: Myth or Reality?”. 14th Public Finance Workshop, Banca
DÍtalia, 29-31 March 2012.
Elmeskov, Jørgen and Douglas Sutherland. 2012. “Post-Crisis
Debt Overhang: Growth Implications Across Countries”. Second
International Research Conference on “Monetary Policy, Sovereign
Debt and Financial Stability: The New Trilemma”, 1-2 February, 2012,
Reserve Bank of India, Mumbai, India.
Engle, Robert F. and C. W. J. Granger. 1987. “Co-Integration and Error
Correction: Representation, Estimation, and Testing”. Econometrica,
Vol. 55, No.2.
Gerson, Philip and David Nellor. 1997. “Philippine Fiscal Policy:
Sustainability, Growth, and Savings” in Macroeconomic Issues Facing
ASEAN Countries, edited by John Hicklin, David Robinson and Anoop
Singh (Washington: International Monetary Fund).
Giovannini, Alberto and Martha de Melo. 1993. “Government Revenue
from Financial Repression.” American Economic Review, Vol. 83, No.4.
Goyal, R., J.K. Khundrakpam and Partha Ray. 2004. “Is India’s Public
Finance Unsustainable? Or, are the Claims Exaggerated?” Journal of
Policy Modeling, Vol. 26 (2004).
Greenidge, Kevin, Roland Craigwell, Chrystol Thomas and Lisa
Drakes. 2012. “Threshold Effects of Sovereign Debt: Evidence from
the Caribbean”. IMF Working Paper No. WP/12/157.
Hakkio, Craig S. and Mark Rush. 1991. “Cointegration: How short
is the long-run?”. Journal of International Money and Finance,
Vol. 10, No.4.
Hall, G. J. and T. J. Sargent. 2011. “Interest Rate Risk and Other
Determinants of Post-WW II U.S. Government Debt/GDP Dynamics”.
American Economic Journal: Macroeconomics, Vol. 3, No.3.
Herndon, Thomas, Michael Ash and Robert Pollin. 2013. “Does High
Public Debt Consistently Stifle Economic Growth? A Critique of
Reinhart and Rogoff”. Political Economy Research Institute, Working
Paper Series, Number 322.
Jha, R. 1999. Fifty Years of Development Economics. Himalaya
Publishing Company, chapter Some Rudimentary Macroeconomics of
the Budgetary Deficit and Debt.
Jha, R. and A. Sharma. 2004. “Structural Breaks, Unit Roots and
Cointegration: A Further Test of the Sustainability of the Indian Fiscal
Deficit”. Public Finance Review, Vol. 32, No.2.
Kumar, Manmohan S. and Jaejoon Woo. 2012. “Public Debt and
Growth”. 14th Public Finance Workshop, Banca DÍtalia, 29-31 March,
2012.
Legrenzi, G. and C. Milas. 2011. “Debt Sustainability and Financial
Crises: Evidence from the GIIPS”. The Rimini Centre for Economic
Analysis, WP 11-42.
Mohanty, M. 2013. “Public Debt Management and Macroeconomic
Stability”. Paper presented at the 2nd meeting of SAARC Public Debt
Managers’ Forum at Jaipur, India, during December 6-7, 2013.
Pattillo, C., H. Poirson and L. Ricci. 2002. “External Debt and Growth”,
IMF Working Paper 02/69.
Rangarajan, C and D. K. Srivastava. 2003. “Dynamics of Debt
Accumulation in India: Impact of Primary Deficit, Growth and Interest
Rate” . Economic and Political Weekly, Vol 38, No.46, November.
Rangarajan, C. and D. K. Srivastava. 2005, “Fiscal Deficits and
Government Debt in India: Implications for Growth and Stabilisation”,
NIPFP, Working Paper No. 35.
Reinhart, C. and K. Rogoff. 2010. “Growth in a Time of Debt”. American
Economic Review: Papers & Proceedings, Vol. 100, No.2.
Reinhart Carmen M. and M. Belen Sbrancia. 2011. “The Liquidation of
Government Debt”. NBER Working Paper No. 16893.
Seshan, A. 1987. “The Burden of Domestic Public Debt in India”.
Reserve Bank of India, Occasional Papers, Vol. 8, No.1.
Singh, Charan. 1999. “Domestic Debt and Economic Growth in India”.
Economic and Political Weekly, No. 23, June 5, 1999.
Tiwari, Aviral Kumar. 2012. “Debt Sustainability in India: Empirical
Evidence from Estimating Time Varying Parameters”. Economics
Bulletin, 2012, Vol. 32, No.2.
Topalova, Petia and Dan Nyberg. 2010. “What level of Public Debt
Could India Target?”. IMF Working Paper, WP/10/7, January.
Tronzano, Marco. 2012. “Multicointegration and Fiscal Sustainability
in India: Evidence from Standard and Regime Shifts Models”.
https://editorialexpress.com/cgi-bin/conference/download.cgi?db_
name=ICEEE5&paper_id=27.
Annex 1
Table A.1: Liabilities Position of the Centre and States
(Amount outstanding at the end of March) |
(Per cent of GDP) |
|
Components |
1990-91 |
2000-01 |
2004-05 |
2010-11 |
2011-12
RE |
2012-13
BE |
1 |
2 |
3 |
4 |
5 |
6 |
7 |
I. |
Centre (1+2) |
62.7 |
53.9 |
61.5 |
50.5 |
49.8 |
49.5 |
|
1 Internal liabilities (A+B) |
56.4 |
50.8 |
59.6 |
48.5 |
47.9 |
47.7 |
|
A) Internal debt (i+ii) |
30.7 |
37.1 |
39.4 |
34.2 |
35.7 |
36.8 |
|
i) Market loans & bonds |
27.8 |
35.0 |
37.2 |
30.8 |
31.4 |
32.6 |
|
ii) Ways & means from the RBI |
2.9 |
2.1 |
2.2 |
3.4 |
4.3 |
4.3 |
|
a. Treasury bills |
1.6 |
1.0 |
1.5 |
3.1 |
3.9 |
3.6 |
|
b. Securities issued to International Financial Institutions |
1.3 |
1.0 |
0.7 |
0.4 |
0.3 |
0.7 |
|
B) Other liabilities of which |
25.7 |
13.8 |
20.3 |
14.3 |
12.2 |
10.9 |
|
i) Small savings |
10.0 |
0.3 |
10.2 |
7.3 |
6.3 |
5.5 |
|
ii) Provident funds |
2.3 |
1.9 |
1.9 |
1.4 |
1.4 |
1.3 |
|
2 External debt |
6.3 |
3.0 |
1.9 |
2.0 |
1.9 |
1.8 |
II. |
States |
10.9 |
16.4 |
26.3 |
21.6 |
20.6 |
20.3 |
|
1. Market loans & bonds |
3.1 |
4.0 |
7.5 |
7.9 |
8.4 |
9.1 |
|
2. Ways & means from the RBI |
0.2 |
0.3 |
0.0 |
0.0 |
0.0 |
0.0 |
|
3. Provident funds etc. |
3.4 |
4.3 |
4.0 |
2.9 |
2.8 |
2.7 |
|
4. Loans from banks & other institutions |
0.5 |
1.3 |
2.1 |
1.0 |
0.9 |
0.8 |
|
5. Special securities issued to NSSF |
0.0 |
2.6 |
8.7 |
6.3 |
5.4 |
4.8 |
|
6. Reserve funds and deposits & advances |
3.7 |
3.8 |
4.0 |
3.3 |
3.1 |
2.8 |
III. |
Total |
68.9 |
73.7 |
82.1 |
65.5 |
65.5 |
66.0 |
Notes: Total debt of centre and states may not add up due to adjustments on account of intergovernmental
transactions.
Source: Indian Public Finance Statistics, Government of India and Handbook of Statistics on
the Indian economy, RBI. |
Table A.2: Ownership Pattern of Central and State Government Securities |
(Per cent of Total Securities) |
Category of Holders |
2008 |
2009 |
2010 |
2011 |
2012 |
1 |
2 |
3 |
4 |
5 |
6 |
1. Reserve Bank of India (own account) |
6.6 |
7.1 |
8.9 |
8.6 |
10.4 |
2. Scheduled commercial banks |
51.0 |
50.4 |
52.0 |
51.4 |
53.8 |
3. Primary Dealers |
0.3 |
0.1 |
0.1 |
0.1 |
2.8 |
4. Insurance Companies |
19.7 |
17.6 |
18.3 |
20.6 |
20.3 |
5. Financial Institutions |
1.0 |
1.3 |
2.1 |
2.0 |
0.2 |
6. Mutual Funds |
0.3 |
0.5 |
0.2 |
0.4 |
0.5 |
7. Provident Funds |
4.0 |
4.0 |
4.3 |
4.6 |
4.8 |
8.Others |
17.1 |
18.9 |
14.2 |
12.4 |
7.3 |
Total |
100.0 |
100.0 |
100.0 |
100.0 |
100.0 |
Source: Handbook of Statistics on the Indian Economy, RBI |
Table A.3: Short Term Debt of the General Government |
Year |
Amount (` billion) |
Per cent of Public Debt |
Per cent of GDP |
1 |
2 |
3 |
4 |
2007-08 |
1345 |
5.2 |
2.7 |
2008-09 |
2604 |
8.6 |
4.6 |
2009-10 |
3178 |
8.9 |
4.9 |
2010-11 |
2796 |
6.9 |
3.6 |
2011-12 |
4330 |
9.1 |
4.8 |
Source: Status Paper on Government Debt, GoI |
Table A.4: Floating Rate Debt of the Central Government |
Year |
Internal Floating Debt |
External Floating Debt |
Total Floating Debt |
Per cent
of Public
Debt |
Per cent
of GDP |
Per cent
of Public
Debt |
Per cent
of GDP |
Per cent
of Public
Debt |
Per cent
of GDP |
1 |
2 |
3 |
4 |
5 |
6 |
7 |
2001-02 |
0.3 |
0.1 |
3.7 |
1.7 |
3.9 |
1.9 |
2005-06 |
2.3 |
1.0 |
1.8 |
0.8 |
4.1 |
1.7 |
2009-10 |
1.6 |
0.6 |
2.1 |
0.8 |
3.7 |
1.5 |
2011-12 |
1.6 |
0.6 |
2.4 |
0.9 |
3.9 |
1.6 |
2012-13 RE |
1.2 |
0.5 |
2.3 |
0.9 |
3.5 |
1.4 |
Source: Status Paper on Government Debt, GoI |
Annex 2
Correlation Matrix for Debt Threshold Equation |
Variables |
Public
Debt to
GDP |
Growth
in Real
Investment |
Inflation
Rate |
Growth in
International
Trade |
Gross
Fiscal
Deficit to
GDP |
1 |
2 |
3 |
4 |
5 |
6 |
Public Debt to GDP |
1.00 |
|
|
|
|
Growth in Real Investment |
0.33 |
1.00 |
|
|
|
|
(0.07) |
|
|
|
|
Inflation Rate |
-0.02 |
-0.18 |
1.00 |
|
|
|
(0.92) |
(0.31) |
|
|
|
Growth in International Trade |
0.26 |
0.06 |
0.49* |
1.00 |
|
|
(0.15) |
(0.73) |
(0.00) |
|
|
Gross Fiscal Deficit to GDP |
0.24 |
-0.06 |
-0.10 |
-0.14 |
1.00 |
|
(0.18) |
(0.75) |
(0.59) |
(0.46) |
|
Note: 1. Figures in the parentheses indicate respective p values.
2. * indicates significant at 1 per cent level. |
|