Rajeev Jain and J. B. Singh*
Focusing on the analysis of South Asia Association for Regional Co-operation
(SAARC) trade, the paper attempts to analyse the merchandise trade performance of SAARC
region and also the trend in intra-SAARC trade. A brief analysis of trade baskets of SAARC
countries shows that export baskets of major SAARC countries are significantly similar
Reflecting that they may be competing with one another in same industries in the international
market. However, export baskets are relatively more diversified for India and Pakistan.
Grubel-Lloyd index provides an empirical evidence of growing intra-industry trade in
SAARC countries which perhaps is an off-shoot of trade and industry reforms that have taken
place in recent years. An attempt is also made to examine SAARC region’s relative
competitiveness by calculating revealed comparative advantage index [as suggested by
Balassa (1965)] and compare the structure of specialisation using relative trade comparative
advantage (RTA) index [as suggested by Scott and Vollrath (1992)]. It is found that India has
relative trade comparative advantage in a larger number of industry groups than other SAARC
countries and all major SAARC countries have RTA in textile sector. Certain issues pertaining
to SAARC trade are also briefly discussed. The study concludes that despite significant
business cycle convergence in major SAARC countries (India, Pakistan, Bangladesh and Sri
Lanka), trade integration is growing only at a slow pace.
JEL Classification : F1, O24
Keywords : Trade, Trade Policy
Introduction
One of the major objectives of formation of SAARC forum
was to accelerate the process of economic and social development
in member States. Subsequently, trade promotion was also actively pursued as an area of economic co-operation. The possibility of Intra-
SAARC trade expansion has been investigated using macroeconomic
and regional trade link models. It is generally found that inter-country
differences in production and consumption patterns, investment
behaviour, tax and non-tax structures leave considerable scope for
further regional trade expansion. At present, intra-SAARC trade is
quite low as compared with that of regional forums such as European
Union (EU) and Association of South East Asian Nations (ASEAN).
In order to examine what has happened to the overall SAARC trade,
intra-SAARC trade and product group wise comparative advantage
in trade of individual member countries, this paper attempts an intertemporal
analysis particularly for the post-SAARC formation period.
Before discussing these aspects, a brief account of macroeconomic
performance of all SAARC countries is given in Section I. In Section
II, an inter-temporal analysis is made in terms of trade openness,
overall trade performance, direction of SAARC trade, intra-SAARC
trade and its comparison with other regional forums. Trade policy of
SAARC countries is discussed briefly in Section III. Section IV touches
upon the issues of diversification, similarity of trade basket and trend
in intra-industry trade in SAARC countries. Section V analyses the
aspect of product group-wise relative comparative trade advantage of
SAARC countries. Section VI discusses certain trade related issues
and concluding observations are made in Section VII.
Section I
Macroeconomic Overview of SAARC Economies
The South Asian region (as defined by SAARC)1 constitutes
about 23 per cent of the world’s population and has 15 per cent of
the world’s arable land, but only 6.0 per cent of Purchasing Power
Parity (PPP) based global gross domestic product (GDP) and account
for around 2.0 per cent of world goods trade, and around 3.0 per
cent of world foreign direct investment. The South Asian region
is extraordinarily diverse in terms of country size, economic and
social development, geography, political systems, languages, and
cultures. Three of the eight countries under South Asian region, viz.,
Afghanistan, Nepal, and Bhutan, are landlocked and mountainous;
while Sri Lanka is an island and the Maldives is an archipelago of
low-lying coral islands in the central Indian Ocean.
The region translated itself from a position of slowest growing
region during the 1960s and the 1970s to one of the fastest growing
regions in the world since the 1980s. In terms of GDP growth, the
South Asia has performed robust growth over the years among the low
income countries. As per the World Bank database, during the 1960s,
GDP growth in the region was placed at 4.2 per cent as compared to
5.4 per cent at the global level. Except during the 1960s and 1970s,
the GDP growth in South Asia was higher than those of the world
output growth till 2008. The growth in South Asia had been sustained
at an average of 5.4 per cent during 1980-1999 followed by higher
average growth of 6.8 per cent during 2000-08.
Reflecting growing savings, the gross capital formation of South
Asian economies almost doubled from 15.1 per cent during the 1960s
to 29.1 per cent during 2008 as against a decline from 23.1 per cent
to 21.5 per cent during the same period at the world level. However,
some economies of the region, viz., Afghanistan, Nepal, Bhutan and
Bangladesh still depend on foreign savings/aid for financing their
resource gaps.
As regards fiscal position of the South Asian region, at present,
all countries have fiscal deficit. Some of the economies of the region
are highly sensitive to external and natural shocks. For instance, the
deteriorating fiscal balance on account of reconstruction projects
undertaken in the aftermath of tsunami in recent years was a major
concern in Maldives. The fiscal deficit for Maldives was at 15.7 per
cent of GDP in 2008. Similarly, it has been noted that fiscal position of
Bhutan is quite sensitive to project-specific revenues and expenditure
of the government. The budget deficit was at 3.2 per cent of GDP
in 2008. In Pakistan, despite overall improved revenue position, a
sharp increase in current expenditures led by interest payments and
continued expansion in development spending kept the fiscal deficit
at 7.4 per cent of GDP in 2008. Continued modernisation of revenue
administration broadened the tax base in Sri Lanka, which along with
lower than expected expenditure, contributed to some reduction of
the fiscal deficit to 6.8 per cent of GDP in 2008 as compared with
the previous year. In Bangladesh, revenue collection slipped and total spending was contained by a reduction in outlays for the annual
development program, which kept the fiscal deficit at 4.7 per cent of
GDP in 2008. The budget deficit remained steady at 2.0 per cent of
GDP in Nepal during 2008 despite increase in expenditures during
the year. The fiscal position in India, both at Centre and States, was
undergoing consolidation (till the outbreak of the recent financial
crisis) in terms of targeted reduction in fiscal deficit indicators under
the Fiscal Responsibility and Budget Management (FRBM) Act. As
per the revised estimates, the gross fiscal deficit (GFD) and revenue
deficit (RD) of Central Government for 2008-09 were placed higher at
6.0 per cent and 4.5 per cent of GDP, respectively, mainly on account
of the recent fiscal stimulus and the 6th Central Pay Commission
awards.
All South Asian countries, except Nepal, Bangladesh have largely
incurred current account deficit (CAD). CAD as a ratio to GDP is
highest in Maldives despite a net surplus in services trade, most of
which comes from tourism that had financed the trade deficit until
2004. Even though tourism earnings recovered to exceed the pretsunami
level in 2007, larger services payments and the expansion in
imports meant that net services covered only about 40 per cent of the
trade deficit. The CAD in Maldives, therefore, widened further to 51.4
per cent of GDP in 2008. In Afghanistan, the current account deficit
was at 1.6 per cent of GDP in 2008. The current account surplus in
Bangladesh increased to 1.9 per cent of GDP in 2008 resulting from
narrowing trade deficit and higher remittance inflows. In Nepal, the
current account turned into surplus at 2.7 per cent of GDP in 2008
on account of narrowing trade deficit and higher remittance inflows.
In Pakistan, the current account deficit is under pressure because of
higher oil import bill and deteriorating income and services accounts,
despite moderate growth in exports and continued strong receipts of
workers’ remittances. During 2008, CAD as a rates to GDP stood at
8.4 per cent in Pakistan. The trend of strong remittance growth in
Sri Lanka since 2004 reversed in 2008 on account of global financial
crisis. In 2008, the CAD as a ratio to GDP widened to 9.4 per cent
of GDP in Sri Lanka. In India, although the trade deficit widened
during 2008-09, it was offset by a steady inflow of remittances and a higher surplus from exports of services such as software and business
services, though their expansion in earnings was reduced from the
rapid rates seen in previous years. During 2008-09, the widening of
the trade deficit mainly led by imports resulted in a higher level of
CAD which stood at US$ 28.7 billion or 2.4 per cent of GDP (US$
17.0 billion or 1.5 per cent of GDP in 2007-08) (Table 1).
Despite a number of substantial reforms undertaken in South
Asian economies in recent period, the region remained one of the
poorest in terms of per capita income. Furthermore, the region has
significantly lagged behind in the field of infrastructure, social
provisions and working of the institutional set-up. Only the Sri
Lankan economy is exceptional. Sri Lanka is exceptional not only in
South Asia, but in the developing world. It has achieved high literacy
and low infant and adult mortality rates and continues to provide
universal health and education coverage and in its commitment to
gender equality and social development. Its current levels of human
development indicators are comparable to those of high-income
countries (Srinivasan, 2004).
Table 1: Macroeconomic Indicators of SAARC Economies: 2008 |
Items |
AFG |
BD |
BT |
IND# |
MALD |
NEP |
PAK |
SRL |
1 |
2 |
3 |
4 |
5 |
6 |
7 |
8 |
9 |
Real GDP Growth, % |
3.4 |
6.0 |
5.0 |
6.7 |
6.3 |
5.3 |
2.0 |
6.0 |
GDP Per Capita (Current Prices US$) |
419 |
522 |
1789 |
1020 |
3653 |
455 |
1022 |
1972 |
GDP (PPP) % of World Total |
0.03 |
0.3 |
0.005 |
4.7 |
0.002 |
0.05 |
0.6 |
0.1 |
CPI Inflation, Average, % |
26.7 |
7.7 |
8.3 |
8.4$ |
12.3 |
7.7 |
12.0 |
22.6 |
Fiscal Balance, % of GDP, FY Basis |
-4.1 |
-4.7 |
-3.2 |
-6.0 |
-15.7 |
-2.0 |
-7.4 |
-6.8 |
Merchandise Export, % Growth |
18.9 |
17.4 |
4.4 |
13.7 |
45.2 |
9.3 |
18.2 |
6.5 |
Merchandise Import, % Growth |
12.1 |
25.6 |
27.4 |
19.4 |
26.6 |
24.1 |
31.2 |
24.0 |
Current Account Balance (US$ Billion) |
-0.2 |
1.9 |
-0.03 |
-28.7 |
-0.6 |
0.3 |
-13.9 |
-3.7 |
Current Account Balance, % of GDP |
-1.6 |
1.9 |
-2.2 |
-2.4 |
-51.4 |
2.7 |
-8.4 |
-9.4 |
Debt Service Ratio, % of Exports |
1.2 |
3.2 |
18.5 |
4.4 |
5.1 |
10.1 |
12.2 |
14.3 |
Reserves (Excluding Gold), US$ Billion, End-Period |
3.5 |
6.1 |
0.6 |
242 |
0.2 |
2.5 |
8.6 |
1.8 |
#: For 2008-09. $: WPI (Average).
AFG: Afghanistan. BD: Bangladesh. BT: Bhutan. IND: India. MALD: Maldives.
NEP: Nepal. PAK: Pakistan. SRL: Sri Lanka.
Source: World Economic Outlook, International Financial Statistics, IMF and Asian Development Outlook, ADB. |
Section II
Recent Trade Performance of SAARC Region
The importance of trade as growth facilitator has been recognised
in SAARC countries as well. It is evident from the growing trade
openness of SAARC economies over the years. However, there are
wide disparities within the SAARC region. For instance, Maldives is
highly dependent on external sector with 161 per cent trade openness
ratio (Trade-GDP ratio) while Pakistan is least open country in the
SAARC region (Table 2). Saxena (2005) elaborates that India has
a huge domestic market, hence trade forms a substantially smaller
percentage of GDP, especially when compared with East Asian
economies, that are small and essentially require trade for growth.
The rest of the countries are fairly open to trade.
Despite growing trade-GDP ratio, the South Asian economies
continued to remain least open relative to other groups of emerging
and developing economies. The proportion of trade in GDP of SAARC
region increased markedly from 15.1 per cent during the 1970s to 51.8
per cent in 2008. For East Asia and Pacific, however, it soared from
20.9 per cent during the 1970s to as much as 88.6 per cent in 2007
but declined to 64 per cent in 2008 on account of the recent global
financial crisis leading to deceleration in trade.
Table 2 : Trade Openness (Export and Import as per cent of GDP) in SAARC Countries |
(Per cent) |
Country |
1960 |
1970 |
1980 |
1990 |
2000 |
2008 |
1 |
2 |
3 |
4 |
5 |
6 |
7 |
Afghanistan |
11.2 |
21.7 |
… |
… |
… |
87.0# |
Bangladesh |
19.3 |
20.8 |
23.4 |
19.7 |
33.2 |
47.0 |
Bhutan |
… |
… |
50.4 |
56.7 |
76.2 |
146.0 |
India |
11.8 |
7.8 |
15.6 |
15.7 |
27.4 |
54.0 |
Maldives |
… |
… |
… |
… |
161.1 |
… |
Nepal |
… |
13.2 |
30.3 |
32.2 |
55.7 |
45.0 |
Pakistan |
… |
22.4 |
36.6 |
38.9 |
28.1 |
34.0 |
Sri Lanka |
62.4 |
54.1 |
87.0 |
68.2 |
88.6 |
63.0 |
#: For 2006. …: Not available.
Source: World Development Indicators, World Bank. |
Table 3: Share of SAARC Region in World Exports |
(Per cent) |
Country |
1950 |
1960 |
1970 |
1980 |
1990 |
2000 |
2008 |
1 |
2 |
3 |
4 |
5 |
6 |
7 |
8 |
Afghanistan |
0.09 |
0.04 |
0.03 |
0.03 |
0.01 |
0.002 |
0.004 |
Bangladesh |
… |
… |
… |
0.04 |
0.05 |
0.10 |
0.10 |
Bhutan |
… |
… |
… |
0.001 |
0.002 |
0.002 |
0.003 |
India |
1.85 |
1.02 |
0.64 |
0.42 |
0.52 |
0.66 |
1.10 |
Maldives |
0.003 |
0.002 |
0.001 |
0.000 |
0.002 |
0.002 |
0.002 |
Nepal |
0.002 |
0.01 |
0.01 |
0.004 |
0.01 |
0.01 |
0.01 |
Pakistan |
1.23 |
0.55 |
0.29 |
0.13 |
0.16 |
0.14 |
0.13 |
Sri Lanka |
0.53 |
0.30 |
0.11 |
0.05 |
0.05 |
0.08 |
0.05 |
SAARC |
3.71 |
1.92 |
1.08 |
0.68 |
0.80 |
1.00 |
1.39 |
… : Not available.
Note: Data for Pakistan during 1950, 1960 and 1970 includes erstwhile East Pakistan.
Source: UNCTAD. |
As regards the trend in the share of SAARC region in total world
trade, it witnessed a persistent decline during the 1960s, 1970s and
1980s. However, there has been a gradual pickup in share in total
world exports since 1990s but still lower than the level of share in
1950. During 2008, share of SAARC region in total world exports
stood at 1.4 per cent (3.7 per cent in 1950) (Table 3 and Chart 1).
Similarly, the share of SAARC region in total world imports declined
but picked up in recent years (Table 4 and Chart 1).
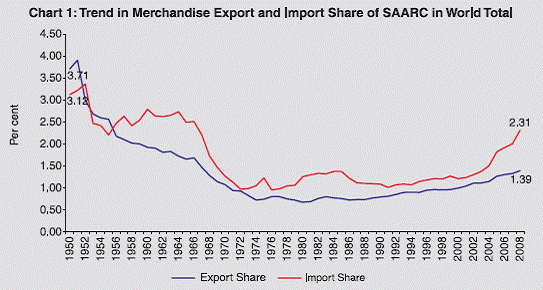 |
Table 4: Share of SAARC Region in World Imports |
(Per cent) |
Country |
1950 |
1960 |
1970 |
1980 |
1990 |
2000 |
2008 |
1 |
2 |
3 |
4 |
5 |
6 |
7 |
8 |
Afghanistan |
0.09 |
0.06 |
0.03 |
0.04 |
0.03 |
0.02 |
0.02 |
Bangladesh |
… |
… |
… |
0.13 |
0.10 |
0.13 |
0.15 |
Bhutan |
… |
… |
… |
0.002 |
0.002 |
0.003 |
0.003 |
India |
1.70 |
1.68 |
0.64 |
0.72 |
0.66 |
0.77 |
1.79 |
Maldives |
0.01 |
0.003 |
0.001 |
0.001 |
0.004 |
0.01 |
0.01 |
Nepal |
0.03 |
0.03 |
0.02 |
0.02 |
0.02 |
0.02 |
0.01 |
Pakistan |
0.91 |
0.72 |
0.45 |
0.26 |
0.21 |
0.16 |
0.26 |
Sri Lanka |
0.38 |
0.30 |
0.12 |
0.10 |
0.07 |
0.09 |
0.08 |
SAARC |
3.12 |
2.79 |
1.27 |
1.26 |
1.09 |
1.21 |
2.31 |
… : Not available.
Note: Data for Pakistan during 1950, 1960 and 1970 includes erstwhile East Pakistan.
Source: UNCTAD. |
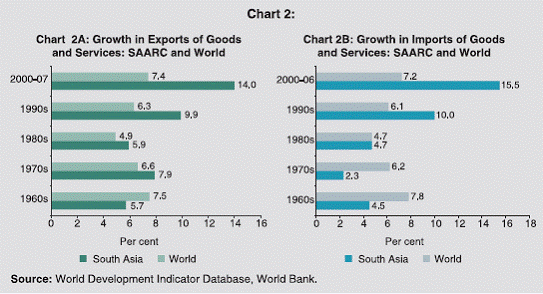
The trade analysis of the countries in South Asian region shows
that they witnessed a wide fluctuation in terms of export and import
growth over time (Chart 2A and 2B). During the 1960s, the average
annual growth of exports of goods and services for Pakistan was at 8.3
per cent followed by India at 5.4 per cent, Bangladesh at 2.6 per cent and
Sri Lanka at 1.3 per cent. During the same period, import growth was
maximum in Bangladesh among the South Asian countries followed by
Pakistan. The export growth was further accelerated to 10.5 per cent for
India in the 1970s followed by Bangladesh at 7.9 per cent. There was also maximum import growth for India in the South Asian region in
the 1970s followed by Pakistan. In the 1980s, Pakistan recorded export
growth as high as 10.7 per cent followed by Sri Lanka at 6.3 per cent,
Bangladesh at 6.1 per cent and India at 4.8 per cent. India witnessed
maximum import growth at 7.6 per cent during the 1980s within South
Asian economies followed by Bangladesh at 7.0 per cent. India and
Bangladesh recorded a robust export growth, respectively, at 12.0 per
cent and 12.6 per cent in the 1990s. In terms of import growth, India
and Maldives had maximum import growth in the 1990s among the
South Asian countries. During 2000-06, the average export growth was
as high as 17.1 per cent for Bhutan followed by India at 13.5 per cent.
Similar trend was followed in import growth during 2000-06.
 |
As far as direction of trade is concerned, share of exports from
South Asia increased significantly to developing Asia (particularly
China), Africa, Western Hemisphere and Middle-East while that to
EU and UK declined over the years. In 2007, exports from South
Asia have been to the extent of 27.4 per cent to developing Asia (7.2
per cent to China), followed by EU (23.9 per cent), USA (16.3 per
cent), middle-east (14.7 per cent) (Chart 3A). The direction of import
in the region is mainly from developing Asia to the extent of 32.3
per cent (including China with 11.6 per cent), EU (16.6 per cent) and
Middle East (9.8 per cent). However, import dependence on US, UK
and EU seems to have declined over the recent years (Chart 3B).
Intra-regional Trade in South Asia
Intra-regional trade in South Asia is relatively low compared with other regions, such as ASEAN in Asia. The South Asian
countries exchange goods principally with countries outside the
region. SAARC had a slow start, but gained momentum with the
launch of (SAPTA) SAARC Preferential Trading Agreement in the
mid-1990s. Since the implementation of South Asian Free Trade
Area (SAFTA) at the beginning of the new millennium, it has begun
to perform robustly (Mohanty and Chaturvedi, 2006). Intra-regional
trade as a ratio of South Asia’s total foreign trade was only 4.8 per
cent in 2008, compared with 25.8 per cent for ASEAN member
countries (Table 5). For individual countries, the intra-regional trade
ratio varies from a low of 2.7 per cent for India and 6.6 per cent
for Pakistan to a high of 60.5 per cent for Nepal and 43.1 per cent
for Afghanistan (Table 6). India’s trade with SAARC region has
expanded significantly in recent years. During 2000-01 and 2006-07,
the overall exports from India to other SAARC countries increased
by an annual average of 25 per cent underpinned by an average of
53 per cent with Pakistan followed by Nepal with an average of 34
per cent. During this period, export expansion with Bangladesh was
lowest. Similarly, imports from SAARC countries to India increased
by an annual average of 22 per cent. A significant increase was
observed in imports from Pakistan and Sri Lanka during this period.
Table 5 : Trend in Intra - Regional Group Trade |
(Per cent) |
Regional Group |
1950 |
1960 |
1970 |
1980 |
1990 |
1995 |
2000 |
2008 |
1 |
2 |
3 |
4 |
5 |
6 |
7 |
8 |
9 |
MERCOSUR |
6.1 |
7.6 |
9.4 |
9.7 |
11.0 |
19.2 |
19.9 |
15.5 |
NAFTA |
35.5 |
30.4 |
36.0 |
33.2 |
37.2 |
42.0 |
46.8 |
40.0 |
ASEAN |
2.8 |
12.7 |
22.4 |
15.9 |
17.0 |
21.0 |
22.7 |
25.8 |
ASEAN +3 |
16.1 |
21.9 |
25.8 |
29.0 |
26.8 |
34.9 |
33.7 |
34.0# |
GCC |
… |
… |
4.6 |
3.9 |
8.1 |
7.5 |
6.2 |
5.5 |
SAARC |
11.6 |
5.0 |
3.2 |
3.5 |
2.7 |
4.3 |
4.5 |
4.8 |
EU 25 |
47.9 |
51.8 |
61.0 |
61.8 |
67.4 |
66.4 |
67.2 |
66.7# |
Euro Zone |
36.1 |
41.2 |
53.7 |
48.1 |
54.5 |
53.2 |
50.3 |
49.3 |
APEC |
44.2 |
47.0 |
57.9 |
57.5 |
67.7 |
71.7 |
72.5 |
65.5 |
CIS |
… |
… |
… |
… |
… |
33.4 |
28.4 |
22.7 |
# : For 2006. ... : Not available.
Source: UNCTAD . |
Table 6 : Intra-regional Trade Share of South Asia’s Total Trade |
(Per cent) |
Country |
1985 |
1990 |
1995 |
2000 |
2004 |
2007 |
1 |
2 |
3 |
4 |
5 |
6 |
7 |
Afghanistan |
11.4 |
14.5 |
11.1 |
29.7 |
35.3 |
43.1 |
Bangladesh |
4.7 |
6.0 |
12.8 |
7.9 |
10.5 |
9.4 |
Bhutan |
… |
… |
… |
… |
… |
… |
India |
1.7 |
1.6 |
2.7 |
2.5 |
3.0 |
2.7 |
Maldives |
12.5 |
12.7 |
14.3 |
22.2 |
19.8 |
12.2 |
Nepal |
34.3 |
11.9 |
14.8 |
22.3 |
47.2 |
60.5 |
Pakistan |
3.1 |
2.7 |
2.3 |
3.6 |
5.0 |
6.6 |
Sri Lanka |
5.5 |
5.6 |
7.8 |
7.4 |
15.1 |
18.9 |
... : Not available.
Source: Regional Co-operation Strategy and Programme, South Asia (2006-2008), ADB. |
Despite growing trade with SAARC region, the intra-SAARC
trade continues to remain lowest among all the major regional groups
(except Gulf Co-operation Council) formed so far. In 2008, intra-
SAARC trade was merely 4.8 per cent while APEC countries had
65.5 per cent of total trade within the region (Table 5). Despite the
formation of regional grouping, trade flows within the SAARC region
are not much significant. This is perhaps on account of the disparities
in the market size of SAARC economies unlike other regional
groupings. For instance, Bhutan or Nepal cannot be the major export
destinations for India and Pakistan. Thus, one cannot expect beyond
a modest potential in the intra-SAARC trade, particularly of big
SAARC countries with small SAARC economies. In stark contrast,
the small economies of Bhutan and Nepal have maintained strong
trade links with India. For instance, Nepal and Sri Lanka import
around 46 and 16 per cent of their imports from India but these cover
a negligible portion of Indian exports.
Section III
Trade Policy in SAARC Countries
The importance of international trade as an important engine for
growth has been widely debated among the economists. However,
the trade as one of the essential ingredients in economic growth is
overwhelmingly supported in the literature. Even the multilateral institutions such as the World Bank, International Monetary Fund (IMF),
and the Organisation of Economic Co-operation and Development
(OECD) propagate policy advice based on the presumption that
openness generates predictable and positive consequences for growth.
It has been found that more open and outward-oriented economies
consistently outperform countries with restrictive trade and foreign
investment policies. Thus, policies toward foreign trade are among the
more important factors promoting economic growth and convergence
in developing countries.
As far as the trade policy of SAARC countries is concerned,
there is a lot of change in the approach. South Asia has made good
progress in liberalising trade regimes and slashing tariffs since the
early 1990s when most of the countries started with reforms. The
countries have also undertaken considerable industrial deregulation
and other structural reforms. The governments and the private
sector recognise that strong exports are critical for overall economic
growth and poverty reduction, and export-led growth has become
a key thrust in each country. Each country has been integrating
with the global economy, as evidenced by the significant increases
in the merchandise trade [(exports plus imports)/GDP] ratios. The
following discussion in this section provides an overview of trade
policy measures initiated in SAARC countries.
Trade is considered as a component of overall development policy
of Bangladesh. Bangladesh has pursued prudent structural reforms in
priority areas and trade liberalisation with positive results on growth
and foreign direct investment inflows. In recent years, Bangladesh
has adopted an outward-oriented growth strategy which aims at
reducing the anti-export bias prevalent in the economy and improving
competitiveness while keeping in view medium-term imperatives and
long-term development agenda. Bangladesh’s trade policy objectives
as per Import Policy Order 2003-2006 have been to keep pace with
globalisation and the gradual development of a free market economy
under the World Trade Organisation (WTO) rules; facilitate imports
of technology to expand use of modern technology; ease imports for
export industries, in order to place them on a sound basis and, to this end, co-ordinate the import policy with the industrial policy, export
policy and other development programmes; and make industrial raw
materials more easily available to increase competition and efficiency.
Calibrating trade policy reform to support small and mediumsized
enterprises development is another priority (WTO, 2006). The
objectives stated in the Export Policy 2003-2006, which stresses
the need for product-based and sector-based development, include
product diversification/expansion, capacity building of export-related
institutions, and identification and appraisal of advantages for Least
Developed Countries (LDCs) provided under WTO rules. Measures
taken to promote exports in Bangladesh include income tax rebates,
project loans at concessional interest, cash support, export credit on
easy terms, and reduced interest rates, reduced costs for air cargo, and
duty drawbacks. Annual sector-specific export targets (envisaging more
than 10 per cent annual increase) are set for, inter alia, highest priority
and special development sectors which include ready made garments
(RMGs), knitwear, frozen food, leather, jute products, raw jute,
chemicals, tea, agri-products, handicrafts, electronic goods, engineering
products, petroleum products, computer software, specialised fabrics,
textile fabrics, ceramic tableware, bicycles, and shoes.
Sri Lanka began economic liberalisation in 1997 with a move
away from socialism. Sri Lanka’s export-oriented policies have
seen a shift from a reliance on agricultural exports to an increasing
emphasis on the services and manufacturing sectors. The service
sector accounts for over 55 per cent of GDP. Manufacturing, the
fastest growing sector, is dominated by the garment industry. The
agriculture sector, though decreasing in importance to the economy,
nevertheless accounts for around 18 per cent of national output and
employs more than one third of the workforce. The public sector
remains large, with the state continuing to dominate in the financial,
utilities, health and education sectors.
In Pakistan, during the past four years, various initiatives have
been announced as a part of the Trade Policy. These measures aimed
at reducing cost of doing business and included long-term financing
of export oriented projects, relocation of industries, freight subsidy, sales tax facilitation for export sectors, incentives for priority export
sectors, research and development (R&D), marketing and business
facilitation, special export zones, garment skill development
board, creation of Trade Development Authority of Pakistan
(TDAP), revamping of the trade bodies law and framing of rules,
tariff rationalisation initiative, Trade Competitiveness Institute
of Pakistan, etc. A Rapid Export Growth Strategy (REGS) was
also announced in 2005. The strategy aimed at (i) trade diplomacy
to increase market access; (ii) diversification of export markets;
(iii) strengthening of trade promotion infrastructure; (iv) skill
development; and (v) early provision of modern infrastructure.
In India, the external sector has exhibited a marked transformation
since the balance of payments crisis in 1991. The crisis was overcome
by a series of stringent measures with an overriding objective to
honour all external obligations without resorting to rescheduling of
any external payment obligation. While successfully dealing with the
crisis through an adjustment programme, it was decided to launch
simultaneously a comprehensive programme of structural reforms
in which the external sector was accorded a special emphasis. The
policy measures undertaken aimed at making domestic industry costeffi
cient by enhancing efficiency in resource use under international
competition, which was expected to derive a better export
performance in the long-run. The major trade policy changes in the
post-1991 period included simplification of procedures, removal of
quantitative restrictions, and substantial reduction in the tariff rates.
Furthermore, the reach of the export incentives was broadened,
extending the benefits of various export-promotion schemes to a
large number of non-traditional and non-manufactured exports.
Following the announcements in the Export-Import (EXIM) policies,
various changes were effected such as the removal of quantitative
restrictions, strengthening the export production base, removal of
procedural bottlenecks, technological upgradation and improvement
of product quality. Various steps were also taken to promote exports
through multilateral and bilateral initiatives, including identification
of thrust areas and focus regions. The policy stance also marked a move away from the provision of direct export subsidy to indirect
promotional measures. India also took several policy initiatives at the
multilateral levels for tariffication of the non-tariff barriers.
As per India’s commitment to the WTO, India agreed to the
phased removal of all balance-of-payments (BoP) related quantitative
restrictions by end-March 2001 (RBI, 2002). The tariff rates have
undergone considerable rationalisation during the 1990s. Prior to the
1990s, the maximum import duty rates on certain items were over 300
per cent. The peak rate of import duty on non-agricultural imports
was gradually reduced from as high as 150 per cent in 1991-92 to
the present level of 10 per cent (subject to certain exceptions). In
2004, India’s first ever integrated Foreign Trade Policy for 2004-09
was announced by the Ministry of Commerce and Industry. The policy
aimed at double the India’s percentage share in global merchandise trade
within 5 years and to use trade expansion as an effective instrument
of economic growth and employment generation. The present trade
policy of India envisages achieving a share of 5 per cent in world
trade in both goods and services by the year 2020. Policy announced
in April 2008 provides that with a view to achieve the desired share in
global trade and expanding employment opportunities, especially in
semi-urban and rural areas, certain special focus initiatives have been
identified for agriculture, handlooms, handicraft, gems & jewellery,
leather, marine, electronics and information technology (IT) hardware
manufacturing industries and sports goods and toys sectors. As per
the policy, the Government of India shall make concerted efforts to
promote exports in these sectors by specific sectoral strategies that
shall be notified from time to time (Government of India, 2008).
In Maldives, the export and import law of 1979 was changed
in 2000. It formally adopted the Harmonised System (HS). At the
same time, tariff rates were changed up or down. Trade and economic
liberalisation is considered to be means of promoting privatesector
investment and development in Maldives. However, trade
liberalisation, such as tariff reductions, is not specifically included in
the current development plan. Relatively high tariffs are maintained,
mainly for revenue reasons. These account for about two-thirds of tax receipts in Maldives. Nevertheless, the Government is committed
to further outward orientation of the economy to improve trade and
economic performance, and to diversify the economy away from
fishing and tourism. The Maldives provides at least Most Favoured
Nation (MFN) treatment to all WTO Members and is eligible for
“special and differential treatment” under WTO Agreements. The
export regime in Maldives is relatively open; export controls (on
timber), taxes (on ambergris), and regulations are minimal, although
some foreign investment royalties apply only to exports.
The basic objective of Nepalese trade policy 1992 was (i)
to enhance the contributions of trade sector to national economy
by promoting internal and international trade with the increased
participation of private sector through the creation of an open and
liberal atmosphere, (ii) to diversify trade by identifying, developing
and producing new exportable products through the promotion
of backward linkages for making export trade competitive and
sustainable, (iii) to expand trade on a sustained basis through gradual
reduction in trade imbalances and (iv) to co-ordinate trade with other
sectors by expanding employment-oriented trade. Compared to other
SAARC countries, Nepal was relatively late to join the WTO in April
2004. The most notable ingredients of Nepal’s accession package
are: (i) agreement to bind other duties and charges at zero and phase
them out within 10 years; (ii) agreement to bind average tariff at 42
per cent for the agricultural products and 24 per cent for all other
products, and; (iii) agreement to allow up to 80 per cent foreign equity
participation in 70 services sub-sectors spanning distribution, retail
and wholesale services and audio-visual. Second, the rescinding of
Multi-Fiber Agreement quotas at the end of 2004 has dramatically
changed prospects for Nepal’s garment industry that accounted for a
significant portion of total exports.
In Afghanistan, improving trade policy and customs
administration has consistently been a high priority for policy agenda.
In late 2001, Afghanistan inherited a highly differentiated import
tariff regime (including 25 tariff bands with a maximum rate of 150
per cent and a simple average rate of 43 per cent. However, there has
been a major rationalisation of the tariff structure, introducing use of the market exchange rate in calculating import duties and reducing
the number of different tariff rates to six (Maximum 16 per cent) with
a relatively low level of dispersion. The simple average tariff rate
correspondingly declined to 5.3 per cent, making for one of the lowest
and least differentiated tariff structures in the region. Afghanistan has
embarked on a major program to strengthen and reform the customs
administration, with support from the World Bank and other external
partners. The country has been pursuing trade and transit agreements
at bilateral level with regional countries, and at the multi-lateral level
it has recently initiated the WTO accession process (World Bank,
2004). Afghanistan maintains import bans on only a few products
(largely for religious reasons) and imposes no seasonal restrictions,
quotas, or other non-tariff barriers. Das (2008) views that trade
reforms have helped to erode the most egregious forms of anti-export
bias from which these economies suffered in the past.
Overall, import barriers have shrunk dramatically throughout
the region. Although tariffs are now the principal means by which
the South Asian countries protect their domestic industries. Sri Lanka
embarked on trade liberalisation and reduced tariffs substantially in
the late 1970s, and presently has the lowest average tariffs in the
region. During the 1990s, the other four major South Asian countries
have also steadily reduced their tariffs levels. Apart from reducing the
tariff levels, reforms in South Asia have also reduced the complexity
of customs duties by reducing the number of “tariff slabs” i.e., the
number of generally applied customs duties rates. Overall, the South
Asian countries have made considerable progress in simplifying their
trade regimes and making them more transparent, especially through
the elimination of most quantitative restrictions and the reduction
and simplification of customs schedules. The average tariff profile of
SAARC countries as per the WTO’s Report on Tariff Profile 2008 is
shown in Table 7. Available data show that Sri Lanka and Afghanistan
has the lowest average MFN tariff rates in the region. MFN tariff rates
are normal non-discriminatory tariff charged on imports (excludes
preferential tariffs under free trade agreements and other schemes or
tariffs charged inside quotas).
Table 7 : Tariffs Rates: Non-Agriculture Products |
Country |
Av. MFN Applied |
Av. Final Bound |
Trade Weighted Av. |
No. of MFN Applied Tariff Lines |
1 |
2 |
3 |
4 |
5 |
Afghanistan |
5.7 |
… |
… |
5376 |
Bangladesh |
14.6 |
169.2 |
… |
6652 |
Bhutan |
19.2 |
… |
… |
5238 |
India |
14.5 |
50.2 |
8.0 |
11689 |
Maldives |
20.2 |
36.9 |
21.5 |
8995 |
Nepal |
12.6 |
26.0 |
… |
5162 |
Pakistan |
14.1 |
59.9 |
12.8 |
6803 |
Sri Lanka |
11.0 |
30.3 |
8.0 |
6400 |
… : Not available.
Note : Applied duties that are actually charged on imports. These can be below the bound
rates. Bound rates are commitment not to increase a rate of duty beyond an agreed
level without compensating affected party. Tariff Line is a product, as defined by a
system of code numbers for tariffs.
Source : Compiled from WTO 2006 Tariff Profiles, 2008. |
A World Bank study (2004) highlighted that one broad area that
has facilitated trade policy reforms in the SAARC region is the move
towards more market-based exchange-rate regimes. India, Pakistan,
and Sri Lanka now maintain floating exchange rates; Bangladesh,
which had a moderately flexible exchange rate system after 1991,
floated its currency as of May 2003. However, Maldives’s currency
is pegged to the US dollar, and periodically devalued while Nepal’s
and Bhutan’s currencies are pegged to the Indian rupee. The study
further revealed that flexibly managed exchange rates have been
important supports for the trade liberalisation in the South Asian
region, by offsetting or partially off-setting the effects of removal of
quantitative restrictions and tariff reductions on import competition
for domestic industries. Because of their fixed exchange rates with
the Indian Rupee, for Nepal and Bhutan, these effects have been
partial and indirect and have not affected their trade with India. More
generally, unlike the other South Asian countries, they are not able to
use the exchange rate as a means of adjusting to terms-of-trade and
more general macro-economic changes.
Section IV
Trade Basket of SAARC Countries
In comparison to other regions, South Asia’s exports include an
unusually large share of labor-intensive manufactures. India enjoys the
best position in the region in terms of a relatively diversified export
structure with its top 20 commodity groups accounting for only 43
per cent of exports. However, the composition of exports in different
SAARC member countries has undergone significant changes in the
recent past. An encouraging feature is that their manufacturing output
has been steadily increasing. Using United Nation’s COMTRADE
(Commodity Trade) data2 for the year 2004 for Bangladesh, India,
Maldives, Pakistan and Sri Lanka, the calculated Hirschman-Herfindahl
Index (HHI)3 shows that among the SAARC countries, export basket
is highly diversified for India followed by Pakistan (Table 8). This also
reflects their relatively more diversified industrial structure. Looking
at the top 20 export items (6 digit level) of each country, it can be
observed that top 20 commodities (from 16 different 2-digit industry
groups) account for 43.1 per cent of total value of export from India,
while concentration is highest in Bangladesh where top 20 items (from
5 different 2-digit industry groups) account for about 67 per cent of
total exports. Likewise, top 20 items (from 11 different 2-digit industry
groups) in the import basket of India account for 58 per cent of total
value of Indian imports followed by Pakistan (Table 9).
An analysis of exports based on six digit commodity data
aggregated to 99 broad industry groups shows that all SAARC countries have quite a similar export basket. This perhaps also partly
explains the low intra-SAARC trade as the member countries tend to
specialise in broadly similar items for exports. For instance, the rank
correlation between India and Pakistan is highest at 0.60. Correlation
matrix shows that all the correlation coefficients are statistically
significant at 5 per cent (Table 10). Export and import composition
of SAARC countries also shows that India and Pakistan’s exports are notably complementary to the imports of some South Asian
economies, particularly those of Bangladesh and Sri Lanka. Other
economies, however, demonstrate efficiency in only a small number
of export areas, most of which are not complementary to India’s
imports (or those of any other country).
Table 8 : HHI of Exports of Major SAARC Countries |
Country |
2-Digit Commodity Group* |
6-Digit level Commodity |
1995 |
2004 |
1 |
2 |
3 |
4 |
5 |
Bangladesh |
0.25 |
0.29 |
0.04 |
0.05 |
| India |
0.05 |
0.06 |
0.03 |
0.03 |
Maldives |
0.30 |
0.25 |
0.17 |
0.24 |
Pakistan |
… |
0.12 |
… |
0.02 |
Sri Lanka |
… |
0.16 |
… |
0.02 |
… : Not available.
*: HHI index has been calculated for HS 1992 COMTRADE Data for 99 commodity groups.
Note: HHI varies between 0 and 1. A value closer to one indicates least diversification. |
Table 9 : Share of top 20 Export Items (6 digit level) in Major SAARC Countries |
Country |
Export (%) |
No. of 2 digit groups* |
Import (%) |
No. of 2 digit groups* |
1 |
2 |
3 |
4 |
5 |
Bangladesh |
66.6 |
5 |
28.2 |
12 |
India |
43.1 |
16 |
58.3 |
11 |
Maldives |
97.6 |
15 |
32.4 |
14 |
Pakistan |
50.4 |
14 |
46.3 |
16 |
Sri Lanka |
45.0 |
7 |
35.7 |
12 |
* : No. of 2 digit Industry groups that top 20 export/import items belong to. |
Table 10 : Rank Correlation Matrix of Export Baskets of Major SAARC Countries |
Country |
(99 Commodity HS 1992 Groups) |
BD |
IND |
MALD |
PAK |
SRL |
1 |
2 |
3 |
4 |
5 |
6 |
BD |
1 |
0.49 |
0.32 |
0.53 |
0.55 |
IND |
|
1 |
0.36 |
0.60 |
0.57 |
MALD |
|
|
1 |
0.34 |
0.45 |
PAK |
|
|
|
1 |
0.49 |
SRL |
|
|
|
|
1 |
t-Statistics of Correlation |
Country |
BD |
IND |
MALD |
PAK |
SRL |
1 |
2 |
3 |
4 |
5 |
6 |
BD |
|
5.58 |
3.83 |
6.17 |
6.44 |
IND |
|
|
3.84 |
7.44 |
6.92 |
MALD |
|
|
|
3.6 |
5.02 |
PAK |
|
|
|
|
5.57 |
SRL |
|
|
|
|
|
Note: Critical t value at 5% level of significance is 1.67 (N=99, d.f. = 97). |
The similarity in the export pattern can also be gauged from the
‘Export Similarity Index’ (EXS) which provides useful information
on distinctive export patterns from country to country (Finger and
Kreinin, 1979). Unlike the Rank correlation method which is based
on the relative position of a particular commodity/commodity group
in the overall export basket of countries, EXS is defined as the sum
of smaller values of the two countries’ shares of all products in their
total exports to the third market.4 To compute this index, an export
share of each product to total exports of each country is required.
This was an intention to remove the scale effect when measuring the
similarity index between a large country and a small country. It is
defined as :
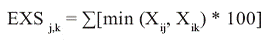 |
Where Xij and Xik are industry i’s export shares in country j’s
and country k’s exports, which usually include a group of countries
or competitors. The index varies between zero and 100, with zero
indicating complete dissimilarity and 100 representing identical
export composition. The EXS could be used as a basis for forming
a common stance by the countries during trade talks and the public
can be informed to prepare for the opportunities and threats. It also
implies that if two countries produce and export similar products,
then the level of competition will be intensified by opening up
trade between the two. In short, it can reflect the degree of potential
trade diversion in case the trade liberalisation is further allowed in
particular country.
The results based on data available for five SAARC countries
show EXS of Bangladesh and Sri Lanka is highest while that between
India and Maldives is lowest in the SAARC countries (Table 11).
Table 11 : Export Similarity Index (EXS) for SAARC Countries |
Country |
Finger and Kreinin's EXS Index |
BD |
IND |
MALD |
PAK |
SRL |
1 |
2 |
3 |
4 |
5 |
6 |
BD |
100.0 |
20.4 |
35.8 |
32.7 |
57.8 |
IND |
|
100.0 |
19.9 |
33.9 |
31.5 |
MALD |
|
|
100.0 |
22.3 |
26.5 |
PAK |
|
|
|
100.0 |
32.7 |
SRL |
|
|
|
|
100.0 |
South Asian export markets compete in a narrow range of products,
particularly in textiles, apparel, and other light manufactured goods.
While in the case of Bangladesh, 18 out of the top 20 export items
(6 digit level commodities) belong to textile/jute textile sector, in the
case of India, all the top 20 export items belong to different sectors.
As per the COMTRADE data (2004), the top five exported items
from India were ‘diamonds’, ‘Oils petroleum, bituminous, distillates,
except crude’, ‘jewellery’, ‘iron ore’, ‘rice’. Like Bangladesh, most
of the top 20 exporting items from Pakistan were from the textile
sector. Table 11 shows that major SAARC countries are competing
with each other in 15 out of top 20 export items. It can be observed
that India, Bangladesh, Pakistan and Sri Lanka compete in almost
all textile items with other SAARC countries, the sector in which
they have strong comparative advantage (discussed in the section
V). Similarly, India competes with Pakistan, Bangladesh and Sri
Lanka in rice in semi-wholly-milled form. Similarly, in the category
of diamonds, India and Sri Lanka compete with each other. These
facts confirm the high rank correlation found for the export baskets
of SAARC countries (Table 12 and Annex I).
Analysis based on 6-digit commodity level import data
aggregated to 2-digit industry group shows that import basket of
SAARC countries are also quite similar in terms of composition as
bilateral rank correlations are positive and statistically significant
(Table 13). However, India’s import basket is comparatively less
diversified than other SAARC countries (Table 14).
Table 12 : Common Exporting Items of SAARC Countries |
S. No. |
6 digit |
Items |
Top 20 |
Other than Top 20 |
1 |
2 |
3 |
4 |
1 |
030613 |
Shrimps and prawns, frozen |
BD, IND |
PAK, SL |
2 |
100630 |
Rice, semi-milled or wholly milled |
IND, PAK |
BD, SL |
3 |
271000 |
Oils petroleum, bituminous, distillates, except crude |
IND, MD, PAK |
BD, SL |
4 |
610510 |
Men’s, boys shirts, of cotton, knit |
BD, PAK, SL |
IND |
5 |
610910 |
T-shirts, singlets and other vests, of cotton, knit |
BD, IND, SL |
IND, PAK |
6 |
610990 |
T-shirts, singlets etc, of material nes, knit |
BD, SL |
IND, PAK |
7 |
611020 |
Pullovers, cardigans etc of cotton, knit |
BD, SL |
IND, PAK |
8 |
620342 |
Men’s, boys trousers & shorts, of cotton, not knit |
BD, MD, PAK, SL |
IND |
9 |
620343 |
Men’s, boys trousers shorts, synthetic fibre, not knit |
BD, SL |
IND, PAK |
10 |
620462 |
Women’s, girls trousers & shorts, of cotton, not knit |
BD, MD, SL |
IND, PAK |
11 |
620520 |
Men’s, boys shirts, of cotton, not knit |
BD, IND, SL |
PAK |
12 |
620630 |
Women’s, girls blouses & shirts, of cotton, not knit |
BD, IND, SL |
PAK |
13 |
620690 |
Women’s, girls blouses & shirts, material nes, not knit |
BD, SRL |
IND, PAK |
14 |
710239 |
Diamonds (jewellery) worked but not mounted or set |
IND, SR |
… |
15 |
880330 |
Aircraft parts nes. |
MD, SR |
IND, PAK, BD |
Note : Col. 4 shows that these country export these items but do not figure among their
respective top 20 commodity items.
Source : Compiled from UN Database. |
Intra-Industry Trade in SAARC countries
Another notable aspect that one expects after a substantial
industrial and trade liberalisation is the increase in intra-industry
trade (IIT). For instance, the potential for the occurrence of IIT
was limited under the import substitution policy regime in India.
Given the size limits for companies imposed by the Monopolies
and Restrictive Trade Practices (MRTP) Act 1969, firms tended to
diversify rather than specialise in a particular business. There was no compulsion for firms to rationalise their product lines. According to
Veeramani (2003), greater liberalisation brings about rationalisation
in the choice of product lines by individual plants. Rationalisation
of product lines and efficient allocation of resources can take place
through inter-industry shifting, inter-firm shifting within an industry
and intra-firm resource shift. In order to examine the intensity of IIT, Grubel and Lloyd (1975) provided an Index known as G-L Index,
which is calculated as:
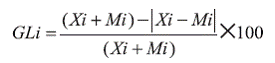 |
where GLi is the index of IIT in industry i, and Xi and Mi are
respectively the values of exports and imports in industry i. The value
of GLi ranges from 0 to 100. If there is no IIT (i.e., one of Xi or Mi
is zero) GLi takes the value 0. If all trade is IIT (i.e., Xi = Mi), GLi
takes the value of 100. Grubel and Lloyd (1975) also suggested the
following formula, which is a weighted average.
Table 13 : Rank Correlation Matrix of Import Baskets of
Major SAARC Countries |
Country |
(99 Commodity HS 1992 Groups) |
BD |
IND |
MALD |
PAK |
SRL |
1 |
2 |
3 |
4 |
5 |
6 |
BD |
1 |
0.63 |
0.59 |
0.67 |
0.76 |
IND |
|
1 |
0.41 |
0.78 |
0.56 |
| MALD |
|
|
1 |
0.49 |
0.66 |
| PAK |
|
|
|
1 |
0.60 |
SRL |
|
|
|
|
1 |
t-Statistics of Correlation |
Country |
BD |
IND |
MALD |
PAK |
SRL |
1 |
2 |
3 |
4 |
5 |
6 |
BD |
|
8.03 |
7.13 |
8.98 |
12.9 |
IND |
|
|
4.46 |
11.42 |
6.70 |
MALD |
|
|
|
5.59 |
8.60 |
PAK |
|
|
|
|
7.39 |
SRL |
|
|
|
|
|
Note : Critical t value at 5% level of significance is 1.67 (N=99, d.f. = 97). |
Table 14 : Herfindhal Index of Imports of Major SAARC Countries |
Country |
2-Digit Commodity Group* |
6-digit level Commodity |
1 |
2 |
3 |
Bangladesh |
0.06 |
0.02 |
India |
0.13 |
0.07 |
Maldives |
0.06 |
0.02 |
Pakistan |
0.09 |
0.06 |
Sri Lanka |
0.05 |
0.01 |
*: HHI index has been calculated for 99 HS 1992 COMTRADE Data.
Note: HHI varies between 0 and 1. |
Table 15 shows that weighted IIT is highest for India, followed by
Pakistan and Sri Lanka. IIT index for Maldives is lowest. This reflects
that trade liberalisation biases trade expansion towards IIT in India.
There are simultaneous expansion of exports and imports from the
majority of industry groups. Industry-wise G-L index shows that out of
99 (2-digit) industry groups, IIT index for the year 2004 was more than
50 in 40 industry groups in India, 30 in Sri Lanka and 22 in Pakistan.
Greater IIT Index also perhaps reflects industrial restructuring efforts
made in recent years by SAARC countries which enabled firms to focus
on their core competence rather than unnecessarily diversifying their
business into non-core areas. This made it possible that in a particular
industry group, domestic firm tend to specialise and in other segments
of the same industry with no core competence, final and intermediate
demand is met through imports. This phenomenon seems to have led to
greater IIT in SAARC countries over the years (Table 15).
Table 15 : Intra-Industry Trade in SAARC Countries |
Year |
Items |
BD |
IND |
MALD |
PAK |
SRL |
1 |
2 |
3 |
4 |
5 |
6 |
7 |
1995 |
No. of Industry Groups > G-L Index 50 |
8 |
35 |
1 |
… |
… |
|
Weighted G-L IIT |
11.0 |
38.2 |
3.9 |
… |
… |
2004 |
No. of Industry Groups > G-L Index 50 |
17 |
40 |
4 |
22 |
30 |
|
Weighted G-L IIT |
47.6 |
62.7 |
20.5 |
52.5 |
52.0 |
...: Not available. |
Section V
Trade Comparative Advantage of SAARC Countries
The large scale trade liberalisation and domestic reform in most
of the SAARC countries in recent years have led to an increasingly
competitive international environment. Thus, it is timely to examine
the extent to which SAARC countries have become more specialised
in various sectors. specifically, through analysing trade data for
six SAARC countries, viz., Bangladesh, India, Maldives, Pakistan,
Nepal and Sri Lanka and the rest of the world by commodity type, it
is possible to reveal in which sectors and products their comparative
advantage lies. Several indicators can be used to analyse competitive
and comparative advantage.
In the present paper, Revealed Comparative Advantage (RCA)
index and the Relative Trade Advantage (RTA) Index have been
used to describe the tendency for countries to specialise and export
those goods and services that they produce at a lower relative cost
compared with other countries. However, before analysing the
results, it is pertinent to briefly discuss the methodology to calculate
these indices.
(a) Revealed Comparative Advantage (RCA)
The Revealed Comparative Advantage Index (RCA) is the most
frequently employed measurement of trade specialisation. This index
was first proposed by Balassa (1965) and defined as:
If RCAi > 1, then country j has a comparative advantage in
good i. If RCAi < 1, then country j has a comparative disadvantage
in good i.
RCA is based on observed trade patterns. The RCA measures
a country’s exports of a commodity relative to its total exports and
to the corresponding export performance of a set of countries. This
index takes values between 0 and +1. A value of index greater than
1 denotes product in which country is relatively more specialised.
On the contrary, a value less than 1 characterises that country j is
accepted not specialised in product i.
(b) The Relative Trade Advantage Index (RTA)
The Relative Trade Advantage Index (RTA), which was first
used by Scott and Vollrath (1992), shows the net trade advantage/
disadvantage. This index is computed as the difference between
the Relative Export Advantage (RXA) and the Relative Import
Penetration Index (RMP). Considering both exports and imports,
the RTA is a more comprehensive measure of competitiveness, and
expressed as:
RTAij = RXAij – RMPij
The competitive advantage revealed by this indicator is implicitly
weighted by the importance of the relative export and the relative
import advantages. It can be greater or less than zero. A positive value
expresses a situation of net competitive advantage, and a negative
one shows a competitive disadvantage.
An inter-temporal analysis of Standard International Trade
Classification (SITC) data for 1995 and 2006 based on the Balassa
index of RCA shows that in 1995, SAARC countries, as a whole,
had comparative advantage only in a few SITC broad industry
groups. In 1995, India had comparative advantage in five trade
sectors. However, India has developed comparative advantage in 10
sectors over the years. In contrast, Pakistan and Bangladesh have lost
their comparative advantage in some sectors over the same period.
Pakistan had RCA index of more than one in agricultural raw material
in 1995 but it witnessed a decline in RCA to 0.8 in 2006. Similarly,
Bangladesh has lost its comparative advantage in food items and
agricultural raw material as respective RCA indices turned from
above one to below one. Nepal has developed comparative advantage
in a number of sectors such as food items, ores and metals, nonferrous
metals, chemical products and iron and steel as the respective
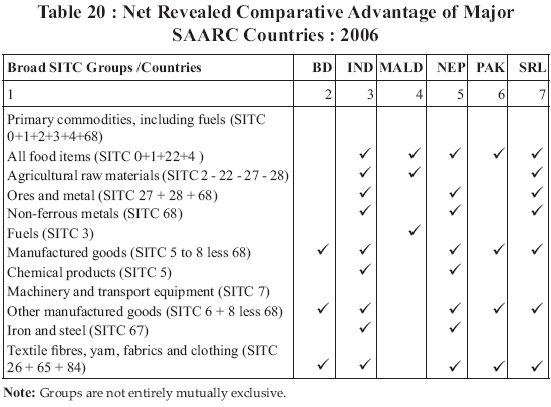
RCA indices turned more than one in 2006 (Tables 16 and 17) .
None of the countries has comparative advantage in capital
intensive and high value added products. For instance, no SAARC
country has RCA greater than one in machinery and transport
equipment. In contrast, all SAARC countries, except Maldives,
have strong comparative advantage in the industry group of textile
fibres, yarn, fabrics and clothing. In the overall manufactured goods
sector, Bangladesh and Pakistan have comparative advantage with
RCA index of 1.29 and 1.14, respectively, followed by Nepal and Sri
Lanka with RCA index of 1.01 each. Out of 12 broad SITC Groups
as classified by UNCTAD (though not mutually exclusive), India has comparative advantage in highest number of sectors while Pakistan,
Sri Lanka and Bangladesh have only 4, 3 and 7 sectors, respectively.
However, India does not seem to have comparative advantage in
manufacturing goods sector. India has improved its comparative
advantage substantially in ‘iron and steel’, ‘chemical products’,
‘non-ferrous metals’, ‘ores and metal’ and ‘agriculture raw material’.
Table 16 : Revealed Comparative Advantage of Major
SAARC Countries : 1995 |
Broad SITC Groups /Countries |
BD |
IND |
MALD |
NEP |
PAK |
SRL |
1 |
2 |
3 |
4 |
5 |
6 |
7 |
Primary commodities, including fuels (SITC 0+1+2+3+4+68) |
0.63 |
1.16 |
3.45 |
0.42 |
0.77 |
1.11 |
All food items (SITC 0+1+22+4 ) |
1.16 |
2.08 |
8.22 |
0.87 |
1.31 |
2.08 |
Agricultural raw materials (SITC 2 - 22 - 27 - 28) |
1.00 |
0.49 |
0.28 |
0.42 |
1.46 |
1.62 |
Ores and metal (SITC 27 + 28 + 68) |
0.00 |
1.10 |
0.06 |
0.04 |
0.05 |
0.22 |
Non-ferrous metals (SITC 68) |
0.00 |
0.25 |
0.00 |
0.00 |
0.00 |
0.01 |
Fuels (SITC 3) |
0.06 |
0.24 |
… |
0.00 |
0.14 |
0.06 |
Manufactured goods (SITC 5 to 8 less 68) |
1.13 |
0.97 |
0.34 |
1.11 |
1.10 |
1.00 |
Chemical products (SITC 5) |
0.32 |
0.86 |
0.00 |
0.13 |
0.07 |
0.10 |
Machinery and transport equipment (SITC 7) |
0.04 |
0.19 |
0.00 |
0.00 |
0.01 |
0.09 |
Other manufactured goods (SITC 6 + 8 less 68) |
3.00 |
2.14 |
0.94 |
3.06 |
3.04 |
2.63 |
Iron and steel (SITC 67) |
0.00 |
0.96 |
0.00 |
0.96 |
0.00 |
0.03 |
Textile fibres, yarn, fabrics and clothing (SITC 26 + 65 + 84) |
10.39 |
3.85 |
3.61 |
11.08 |
10.69 |
7.61 |
Table 17 : Revealed Comparative Advantage of Major
SAARC Countries : 2006 |
Broad SITC Groups /Countries |
BD |
IND |
MALD |
NEP |
PAK |
SRL |
1 |
2 |
3 |
4 |
5 |
6 |
7 |
Primary commodities, including fuels (SITC 0+1+2+3+4+68) |
0.29 |
1.34 |
3.94 |
1.09 |
0.74 |
1.07 |
All food items (SITC 0+1+22+4 ) |
0.84 |
1.36 |
15.69 |
3.20 |
1.88 |
3.42 |
Agricultural raw materials (SITC 2 - 22 - 27 - 28) |
0.86 |
1.30 |
0.00 |
0.76 |
0.80 |
1.38 |
Ores and metal (SITC 27 + 28 + 68) |
0.06 |
1.97 |
0.23 |
1.46 |
0.13 |
0.80 |
Non-ferrous metals (SITC 68) |
0.02 |
1.31 |
0.00 |
1.07 |
0.03 |
1.08 |
Fuels (SITC 3) |
0.03 |
1.13 |
2.08 |
0.00 |
0.38 |
0.01 |
Manufactured goods (SITC 5 to 8 less 68) |
1.29 |
0.91 |
0.01 |
1.01 |
1.14 |
1.01 |
Chemical products (SITC 5) |
0.12 |
1.09 |
0.00 |
1.44 |
0.24 |
0.12 |
Machinery and transport equipment (SITC 7) |
0.03 |
0.29 |
0.01 |
0.05 |
0.05 |
0.14 |
Other manufactured goods (SITC 6 + 8 less 68) |
4.20 |
1.98 |
0.00 |
2.57 |
3.58 |
3.05 |
Iron and steel (SITC 67) |
0.08 |
1.78 |
0.00 |
2.10 |
0.09 |
0.02 |
Textile fibres, yarn, fabrics and clothing (SITC 26 + 65 + 84) |
17.84 |
3.25 |
0.00 |
7.52 |
13.96 |
10.60 |
The analysis of competitiveness indicators, based on the index
of relative trade advantages (RTA) which represents the difference
between the index of relative export advantages (RXA) and the index
of relative import advantages (RMP) shows that out of 12 broad
industry groups, India enjoys relative trade advantage in 9 industry
groups while Bangladesh enjoys only in textile items and manufactured
goods (which are not entirely mutually exclusive). Pakistan has
relative trade advantage in textile, food items, manufactured goods
and other manufactured goods (Tables 18, 19 and 20). One thing
comes out clearly that SAARC countries seem to compete with each
other in textile sector as most of them have relative trade advantage
in this sector.
Table18 : Relative Trade Advantage Index of Major SAARC Countries : 1995 |
Broad SITC Groups /Countries |
BD |
IND |
MALD |
NEP |
PAK |
SRL |
1 |
2 |
3 |
4 |
5 |
6 |
7 |
Primary commodities, including fuels (SITC 0+1+2+3+4+68) |
-0.70 |
-0.52 |
1.75 |
-0.63 |
-1.03 |
0.24 |
All food items (SITC 0+1+22+4 ) |
-0.75 |
1.62 |
5.56 |
-0.22 |
-0.64 |
0.44 |
Agricultural raw materials (SITC 2 - 22 - 27 - 28) |
-0.14 |
-0.86 |
-0.43 |
-0.37 |
-0.39 |
1.06 |
Ores and metal (SITC 27 + 28 + 68) |
-0.62 |
-0.76 |
-0.44 |
-0.68 |
-0.66 |
-0.18 |
Non-ferrous metals (SITC 68) |
-0.67 |
-1.30 |
-0.13 |
-1.00 |
-0.63 |
-0.38 |
Fuels (SITC 3) |
-0.96 |
-2.96 |
… |
-1.27 |
-2.02 |
-0.24 |
Manufactured goods (SITC 5 to 8 less 68) |
0.19 |
0.26 |
-0.48 |
0.61 |
0.33 |
-0.04 |
Chemical products (SITC 5) |
-0.71 |
-0.69 |
-0.59 |
-0.74 |
-1.64 |
-0.83 |
Machinery and transport equipment (SITC 7) |
-0.35 |
-0.35 |
-0.71 |
-0.40 |
-0.77 |
-0.58 |
Other manufactured goods (SITC 6 + 8 less 68) |
1.33 |
1.51 |
-0.13 |
2.56 |
2.63 |
1.02 |
Iron and steel (SITC 67) |
-1.34 |
-0.27 |
-1.04 |
0.58 |
-1.19 |
-0.82 |
Textile fibres, yarn, fabrics and clothing (SITC 26 + 65 + 84) |
5.79 |
3.54 |
2.57 |
9.86 |
9.96 |
4.23 |
Note : Industry groups are not entirely mutually exclusive. |
As far as the global competitiveness index compiled by the
World Economic Forum is concerned, all SAARC countries, except
India and Sri Lanka, are placed among the bottom 50 countries.
Table 19 : Relative Trade Advantage Index of Major SAARC
Countries : 2006 |
Broad SITC Groups /Countries |
BD |
IND |
MALD |
NEP |
PAK |
SRL |
1 |
2 |
3 |
4 |
5 |
6 |
7 |
Primary commodities, including fuels (SITC 0+1+2+3+4+68) |
-0.99 |
-0.32 |
2.41 |
-0.69 |
-0.85 |
-0.07 |
All food items (SITC 0+1+22+4 ) |
-1.53 |
0.86 |
13.13 |
0.77 |
0.24 |
1.45 |
Agricultural raw materials (SITC 2 - 22 - 27 - 28) |
-1.74 |
0.24 |
-2.13 |
-0.45 |
-1.47 |
0.65 |
Ores and metal (SITC 27 + 28 + 68) |
-0.57 |
0.53 |
-0.28 |
1.05 |
-0.56 |
0.06 |
Non-ferrous metals (SITC 68) |
-0.57 |
0.69 |
-0.13 |
0.77 |
-0.52 |
0.42 |
Fuels (SITC 3) |
-0.84 |
-1.17 |
0.74 |
-1.99 |
-1.38 |
-0.94 |
Manufactured goods (SITC 5 to 8 less 68) |
0.37 |
0.25 |
-0.84 |
0.29 |
0.34 |
0.03 |
Chemical products (SITC 5) |
-0.83 |
0.25 |
-0.51 |
0.33 |
-1.02 |
-0.78 |
Machinery and transport equipment (SITC 7) |
-0.6 |
-0.32 |
-0.75 |
-0.42 |
-0.76 |
-0.42 |
Other manufactured goods (SITC 6 + 8 less 68) |
2.82 |
1.37 |
-1.15 |
1.61 |
3.01 |
1.33 |
Iron and steel (SITC 67) |
-0.93 |
0.69 |
-1.02 |
1.24 |
-1.29 |
-1.07 |
Textile fibres, yarn, fabrics and clothing (SITC 26 + 65 + 84) |
13.11 |
3.03 |
-0.56 |
6.05 |
13.24 |
6.01 |
Note : Groups are not entirely mutually exclusive. RTA gretaer than zero indicates net competitive
advantage (i.e., after taking into account import intensity of country in the group). |
 |
As the indicators show that main reasons seem to be lack of
quality infrastructure, technological readiness, strong institutional
mechanism, etc. While India is relatively better than other SAARC
countries in respect of all competitiveness indicators, but a lot needs
to be done in respect of labour market efficiency and technological
advancements. However, the SAARC region is placed better in
terms of potential market size. India is placed third, followed by Sri
Lanka with 28th place and Pakistan with 36th place (Table 21).
Interestingly, the World Bank Report on Doing Business 2008
highlights that South Asia picked up the pace of regulatory reform
over the past year to become the second-fastest reforming region
in the world, on par with the speed of reform in the countries of
the OECD. The pickup in reform was led by India, which rose 12
places on the ease of doing business and made the reform of business
regulation as a policy objective. India was the top reformer worldwide
in trading across borders. Bhutan and Sri Lanka were the other
top reformers in South Asia. Bhutan introduced the country’s first
fundamental labour protections. Sri Lanka made it easier to start a business and to trade across borders. Notwithstanding the ongoing
positive developments on reform fronts as highlighted in the Doing
Business Report, SAARC economies including India are still far
below the advanced and emerging economies in terms of ranking in
ease of doing business (Chart 4).
Table 21 : Rank of SAARC Countries based on Indicators of Competitiveness (2007-08) |
Country/Competiveness Indicators |
IND |
SRL |
PAK |
BD |
NEP |
Total No. of Countries |
1 |
2 |
3 |
4 |
5 |
6 |
7 |
Global Competitiveness Index |
48 |
70 |
92 |
107 |
114 |
131 |
Institutions |
48 |
70 |
92 |
107 |
114 |
131 |
Infrastructure |
67 |
72 |
73 |
120 |
128 |
131 |
Macrostability |
85 |
87 |
101 |
108 |
125 |
131 |
Goods Market Efficiency |
36 |
53 |
82 |
93 |
102 |
131 |
Labour Market Efficiency |
96 |
113 |
118 |
76 |
122 |
131 |
Financial Market Sophistication |
37 |
63 |
65 |
75 |
107 |
131 |
Market Size |
3 |
28 |
36 |
58 |
85 |
131 |
Technological Readiness |
62 |
88 |
89 |
125 |
115 |
131 |
Business Competitiveness Index |
31 |
52 |
79 |
118 |
120 |
131 |
Sophist. of comp. opera. and strat. |
27 |
44 |
88 |
117 |
118 |
131 |
Quality of the business environment |
33 |
54 |
76 |
118 |
119 |
131 |
Source: World Economic Forum. |
Section VI
Some Trade Related Issues
It is generally perceived that trade integration plays an important
role in transmitting disturbances and influencing business cycle comovements.
However, in the case of SAARC region, it is found that
despite a negligible share of intra-SAARC trade in total SAARC trade,
the major economies of the region are significantly synchronised with
each other. Using real GDP data of SAARC countries for the period
1960-2006, it is found that cyclical real GDP behavior in India,
Pakistan, Bangladesh and Sri Lanka exhibits significant convergence.
Since the bilateral trade intensity between these countries is still
low, the real GDP cyclical convergence could be perhaps on account
of common external shocks and largely similar output structure.
Furthermore, amplitude of cyclical behavior of India, Pakistan and
Sri Lanka is also found to be largely the same (Table 22).
The key criteria in the optimal currency area literature are that
countries should join a currency union if they have closer international
trade links and more symmetric business cycles. As found above,
the SAARC region meets the second criteria but not the first one.
Therefore, in order to envisage the introduction of a common currency
in South Asia which at best is likely only in the long run, it is necessary
that trade links in the SAARC area are strengthened. Providing an optimistic view, Rahman, Shadat and Das (2006) argue that potential
high economic growth of south Asian counties (particularly for India,
Bangladesh and Sri Lanka) may boost their trade flows.
Table 22: Bilateral Correlations of Cyclical Behaviour of Real GDP in SAARC Countries (1960-2006) |
Country |
Bangladesh |
Bhutan |
India |
Maldives |
Nepal |
Pakistan |
Sri Lanka |
1 |
2 |
3 |
4 |
5 |
6 |
7 |
8 |
Bangladesh |
1.00 |
0.09 |
0.57* |
0.29 |
-0.01 |
0.57* |
0.47* |
Bhutan |
|
1.00 |
-0.25 |
-0.15 |
-0.62 |
0.02 |
-0.46 |
India |
|
|
1.00 |
0.26 |
-0.17 |
0.87* |
0.74 |
Maldives |
|
|
|
1.00 |
-0.10 |
0.00 |
0.45* |
Nepal |
|
|
|
|
1.00 |
-0.27 |
-0.07 |
Pakistan |
|
|
|
|
|
1.00 |
0.58* |
Sri Lanka |
|
|
|
|
|
|
1.00 |
Amplitude of Cycles |
0.01 |
0.02 |
0.02 |
0.04 |
0.01 |
0.02 |
0.02 |
* : Indicates statistical significant of positive bilateral correlations at 1 per cent.
Note: Calculations for Bhutan and Maldives were based on data available from 1980 and 1995
respectively. |
The best way to co-operate and collectively benefit is to establish
tradability of some key resources that our region is richly endowed
with, and to complement each other in economic development. Only
then would South Asian economic co-operation lead to significant
trade creating and growth generating impact. For instance, Bhutan has
huge hydro power potential, which could find optimum utilisation by
facilitating technological assistance by big neighbouring economies.
Major SAARC economies such as India, Pakistan, Bangladesh and
Sri Lanka can provide a large and virtually inexhaustible market for
many of these resources. There are other tradable items which can
be traded between SAARC countries with least transport costs, etc.
Moreover, two major SAARC countries, viz., India and Pakistan have
been co-operating each other over the last few years to overcoming
their shortages of agricultural products. For instance, Pakistan
supplied chickpeas, pulses, grains and sugar when these were short
in supply in India. India supplied onions, potatoes, pulses and other
food items to Pakistan. Now Pakistan has started to export cement to
India taking advantage of the duty reduction announced by the Indian
Government. Despite all these developments, extra-ordinary issues
still cloud over the potential of economic co-operation in the SAARC
region. In the absence of redressal of trade issues, informal trade is
also reportedly taking place in region, particularly between India and
Pakistan, which is estimated to the extent of US$ 2 billion. Much of
this informal trade takes place via third countries such as Dubai, CIS
countries and Afghanistan (Taneja, 2006). Pohit and Taneja (2000)
and Taneja, et al. (2002) argue that informal trading is taking place
due to policy distortions. As and when such distortions are corrected
informal trade would shift to the formal channel.
As seen above, share of SAARC trade in world trade is abysmally
low in comparison to other regional groups. Even Intra-SAARC is
growing at very modest pace and remains substantially lower than
that of other regional groups. The main reason for this could be the vast disparity of size of economies. World Bank highlights that the
reasons for this low level of trade include protectionist trade regimes,
which discriminated against trade among larger neighbours; continued
conflict between India and Pakistan; and transport and trade facilitation
constraints. Chaturvedi (2007) also argues that the intra-regional
trade has remained far below potential as not enough trade facilitation
measures are being taken. Baysan, Panagariya and Pitigala (2006)
argue that despite some bilateral Free Trade Agreement (FTAs)
existing even before SAFTA outright excluded many of major sectors
in which countries have comparative advantage and imposed tariff
quotas on many other sectors. Apart from these, strict ‘rules of origin’
further handicapped the potential expansion of intra-regional trade
on preferential basis in products that had large potential of trade. It
is important to note that the follow-up agreements on concessions,
dispute settlement, negotiation of a Rules of Origin Agreement would
be important factors in determining the SAFTA being either a trade
creating or a trade diverting RTA. Secretary General SAARC puts
the cost of opportunity lost due to non-cooperation among the South
Asian nations at US$ 8 billion a year.
Economic co-operation was always high on the SAARC agenda
and formal attempt has been through SAFTA becoming effective in
2004. SAFTA came into effect with aim of reducing tariffs for intraregional
trade among seven SAARC members. Pakistan and India
have to complete implementation by 2012, followed by Sri Lanka
in 2013 and Bhutan, Bangladesh, Maldives and Nepal by 2015. The
SAFTA agreements suggest provisions regarding paperless trading,
electronic means of reporting and identification of low risk, high risk
goods, harmonisation in standards, technical assistance and customs
co-operation at the SAARC level. However, there are certain issues
that still remain to be addressed by the country authorities. For
instance, Chaturvedi (2007) argues that although SAFTA has some
provisions for ensuring trade facilitation in the region but at the same
time misses out on several important provisions. He highlights the
additional measures other than in SAFTA which need to be initiated.
These issues relate to containerisation of regional trade and movement of transit goods, security related concerns, infrastructure at the land
customs stations and border agency co-ordination. In addition to
these problems, the issue that Baysan et al (2006) emphasise is that
prima facie the economic case for SAFTA becomes weak because of
high level of protection among the SAARC countries. If the country
participating in a regional arrangement were itself open, it would not
suffer from trade diversion even if it were tiny as its union partners
have to compete with outside trade partners on equal footing.
It is important to note that India has recently become more
proactive in updating arrangements with five least developed
countries (LDCs) of SAARC (Bangladesh, Bhutan, Nepal, Maldives
and Afghanistan). There is a form of non-reciprocity for LDCs.
India has accorded special and favourable treatment for LDCs.
These preferences are non-reciprocal and unconditional to make the
tariff concessions deeper and wider in coverage. As Table 23 shows,
effective preferential agreement coverage rate on products for all
SAARC economies has increased from 0.89 per cent in 1992 to 15.29
per cent, which is even higher for LDCs.
Analysing the empirical literature on the possible gains from
SAFTA and given the present circumstances, Das (2008) reveals that
South Asia, on the whole, stands to gain more from unilateral nondiscriminatory
liberalisation and multilateral liberalisation than from the formation of SAFTA. None of the empirical studies predicted
robust welfare gains from the formation of a free trade agreement in
South Asia. Such apprehensions point towards the economic as well
as political issues that need to be persuasively addressed to make
SAFTA more fruitful to the region. It is quite possible that as SAARC
economies grow and economic complementarities begin to develop,
the countries of South Asia, particularly the larger ones, may find that
SAFTA can offer a potentially significant contribution to their progress.
Table 23 : India's Preferential Tariff to SAARC/SAFTA Countries and LDCs |
Items |
Year |
No. of Duty Free Lines |
Effective Preferential Agreement Coverage Rate % |
1 |
2 |
3 |
4 |
SAARC Preferential Tariff |
1992 |
0 |
0.89 |
SAARC Preferential Tariff (LDC) |
|
12 |
1.35 |
SAARC Preferential Tariff |
1997 |
0 |
0.87 |
SAARC Preferential Tariff (LDC) |
|
13 |
1.37 |
SAARC Preferential Tariff |
1999 |
12 |
2.17 |
SAARC Preferential Tariff (LDC) |
|
13 |
1.34 |
SAARC Preferential Tariff |
2005 |
0 |
15.29 |
SAARC Preferential Tariff (LDC) |
|
291 |
39.63 |
Source : UNCTAD-JETRO Report, 2008. |
A recent World Bank Study by Wilson and Otsuki (2006) finds
that if the countries of South Asia raise their capacity halfway to East
Asia’s average, the intra-SAARC trade would rise by an estimated
US$ 2.6 billion. This is approximately 60 per cent of the total intraregional
trade in South Asia. The category of trade facilitation that will
produce the greatest gains is service-sector infrastructure, followed
by efficiency in air and maritime ports. South Asia also has a stake in
the success of efforts to promote capacity building outside its borders.
If South Asia and the rest of the world raised their levels of trade
facilitation halfway to the East Asian average, the gains to the region
would be an estimated US$ 36 billion. Out of these gains, about 87
per cent of the total gains to South Asia would be generated from
South Asia’s own efforts (leaving the rest of the world unchanged).
In addition to implement capacity building in trade facilitation, the
successful economic co-operation requires reducing barriers to foreign
direct investment (FDI), further lowering tariff rates of protection,
and eliminating other non-tariff barriers that slow productivity and
hamper private sector growth. Macroeconomic policy stability of
the region is also important factor for region’s trade with the rest of
world. In fact, the SAARC countries should strengthen co-ordinated
mechanism under SAFTA so that it could be used as stepping stone
towards greater integration into the world economy and the WTO as
well as a laboratory for understanding the WTOs complexities. At
present, certain disputes concerning SAARC countries are pending at
the WTO (Table 24). SAFTA could be used as an appropriate forum
not only to address intra-regional trade disputes but also for taking
collective stand on WTO related issues.
Table 24 : Disputes Pending at the WTO |
Country |
As Complainant |
As Respondent |
As Third Party |
1 |
2 |
3 |
4 |
Bangladesh |
1 (1) |
0 (0) |
1 (1) |
India |
18 (0) |
19 (1) |
51 (1) |
Maldives |
… |
… |
… |
Nepal |
… |
… |
… |
Pakistan |
3 (0) |
2 (0) |
9 (4) |
Sri Lanka |
1 (0) |
0(0) |
3 (2) |
... : Not available.
Note : Figures in brackets indicate the number of disputes in which other SAARC Country
is involved.
Source : WTO.
|
At present, the cost of trading across borders in South Asia is
one of the highest in the world as the economies of the region have
maintained a higher level of protection within the region than with the
rest of the world. In fact, a study by Baysan, Panagariya and Pitigala
(2006) warned that the region should avoid substituting intra-regional
trade liberalisation for extra-regional liberalisation. They suggested
that if countries in the region bring down the customs duties to 5
per cent, the impact of trade diversion will be considerably reduced.
Procedural formalities in the region are still relatively cumbersome.
It takes on average more than 33 days to export from South Asia
compared to 12 days from OECD countries and more than 46 days
to import into South Asia compared to 14 days for OECD. However,
there are vast opportunities in the region to grow intra-SAARC trade
if appropriate regional agreements on roads, rail, air, and shipping
are put in place enabling seamless movement. Furthermore, since the
countries of South Asian region are net energy importers, to meet the
growing energy requirements, energy trade between these countries
is essential. However, South Asia’s current cross-border energy trade
is limited to Bhutan, India and Nepal. Dhungel (2008) suggests that
more energy trade projects between India, Pakistan and Bangladesh
can help in contributing to integrate regional economies. There should
be an effective mechanism that allows exporters in one country to
obtain unique, less costly, or better quality inputs from suppliers in
neighbouring countries and enhance global competitiveness.
Section VII :
Summing Up
To sum up, the growth of intra-regional trade has remained
subdued due to considerations other than economic issues. In ensuring
stability and growth in intra-regional trade, the Indo-Pak bilateral
relationship plays a very crucial role. Apart from this, SAARC
countries need to put in place adequate physical infrastructure in
place which hampers their global competitiveness even in those
sectors where they have revealed comparative advantages. Although
major SAARC countries are better synchronised in terms of their
GDP cycles, trade integration continues to be low due to high level
of protectionism existing among the SAARC countries than the rest
of world. In this context, successful outcome of SAFTA could play
an important role in strengthening trade ties within the region. It
is, however, to be expected that with further dismantling of tariff
barriers under the SAFTA, a large part of the informal trade may
come under purview of formal trade. This along with favorable Rules
of Origin could raise intra-regional trade in the SARRC region.
SAARC countries will need to take concrete steps for harmonisation
of customs and other procedures, mutual recognition of certificates
and standards and trade facilitation measures. Trade policy of
SAARC countries, therefore, needs to ensure that SAFTA ensures
trade creation rather than trade diversion from the region as many
researchers apprehend .
Notes :
* Rajeev Jain and J.B. Singh are Assistant Advisers in the Department of
Economic Analysis and Policy of the Reserve Bank of India. The authors are
grateful to Dr. R.K. Pattnaik and Shri Amitava Sardar for their encouragement
and support. Thanks are also due to Smt. Ambika Padmanabhan and Smt. Shobha
Kambli for their assistance. Views expressed in the paper are entirely personal and
not of the Reserve Bank of India. An earlier version of the paper was presented
at the SAARCFINANCE Governors’ Symposium held at the Central Bank of Sri
Lanka, Colombo on August 21, 2008.
1 SAARC includes Afghanistan, Bangladesh, Bhutan, India, Maldives,
Nepal, Pakistan and Sri Lanka.
2 Commodity-wise 6-digit comparable data were available for majority
of the SAARC countries only till 2004. It is quite possible that commodity
ranking may have undergone some change in post 2004 period for SAARC
countries.
3 The Herfindahl index equals the sum of squared share of each commodity
in total export of respective country and hence, has a maximum of 1 when
the country is completely focused on one sector, and lower values of the
index indicate more diversification.
4 For the present exercise, instead of item-wise export to third market,
we have used item-wise total exports due to paucity of country-wise and
item-wise export data for SAARC. Furthermore, since the trade between
SAARC countries is significantly low, this may not have affected the results
significantly.
References :
Asian Development Bank (2008), Asian Development Outlook 2008.
Asian Development Bank (2005), Regional Cooperation Strategy and
Programme, South Asia (2006-08), ADB.
Balassa, B. (1965), “Trade Liberalisation and ‘Revealed’ Comparative
Advantage”, The Manchester School, Vol.33, 99-123.
Baysan, T. ; Panagariya, A. and Pitigala, N. (2006), “ Preferential Trading in
South Asia”, World Bank Policy Research Working Paper, No.3813, World
Bank.
Chaturvedi, Sachin (2007), “Trade Facilitation Measures in South Asian
FTAs: An Overview of Initiatives and Policy Approaches”, RIS Discussion
Paper, No.118.
Das, Dilip K. (2008), “The South Asian Free Trade Agreement: Evolution
and Challenges”, MIT International Review, Spring 2008.
Dhungel, Kamal Raj, (2008) “Regional Energy Trade in South Asia”, South
Asia Economic Journal, Vol. 9, No. 1.
Export Promotion Bureau (undated) and Planning Commission (2004),
Bangladesh.
Final Report of Diagnostic Trade Integration Study: Maldives, November
2006.
Finger, J.M. and Kreinin, M.E. (1979), “A Measure of ‘Export Similarity’
and its possible use”, Economic Journal, Vol. 89.
Government of India (2008), Foreign Trade Policy, Ministry of Commerce
and Industry, Department of Commerce, April.
Grubel, H. G. and Lloyd, P. J. (1975), “Intra-Industry Trade”, London:
Macmillan.
International Monetary Fund (2008), World Economic Outlook Database
April 2008.
International Monetary Fund (2008), International Financial Statistics,
May 2008.
International Monetary Fund (2008), Direction of Trade Statistics, June
2008.
Mohanty, S.K and Chaturvedi, Sachin (2006), “Impact of SAFTA on Trade
in Environmentally Sensitive Goods in South Asia: Emerging Challenges
and Policy Options”, Asia-Pacific Trade and Investment Review, Vol. 2, No.
2, December.
Pohit, Sanjib and Taneja, Nisha (2000), “India’s Informal Trade with
Bangladesh and Nepal: A Qualitative Assessment,” ICRIER Working Paper,
No. 58, Indian Council for Research on International Economic Relations
(ICRIER), New Delhi.
Rahman, Mustafizur; Shadat, Wasel Bin and Das, Narayan Chandra (2006),
“Trade Potential in SAFTA: An Application of Augmented Gravity Model”,
Centre for Policy Dialogue Paper, No.61.
Remarks by Secretary General SAARC at the Conference on “SAARC:
Short Window of Opportunity” organised by the Bangladesh Enterprise
Institute on July 2, 2008.
Reserve Bank of India (2002), Report on Currency and Finance, 2001-02.
Saxena, Sweta C. (2005), “Can South Asia adopt a common currency”,
Journal of Asian Economics, Vol. 16.
Scott, L. and Vollrath, T.L. (1992),” Global Competitive Advantage and
Overall Bilateral Complementarity in Agriculture: A Statistical Review”,
United States Department of Agriculture, Economic Research Service,
Statistical Bulletin, No. 850. Washington D.C.
Srinivasan, T. N. (2004), “Economic Reforms in South Asia: An Update”, available at http://www.saneinetwork.net/pdf/grp/T_N_Paper1.pdf.
Taneja, Nisha; Sarvananthan, M; Karmacharya, Binod K. and Pohit, S.
(2002), “Informal Trade in the SAARC Region: A Case Study of India, Sri
Lanka and Nepal”, Report Prepared for the South Asia Network of Economic
Research Institutes, August.
Taneja, Nisha (2006), “India- Pakistan Trade”, ICRIER Working Paper, No.
182, June.
United Nations, UN COMTRADE database.
UNCTAD, Online database.
UNCTAD (2008), Joint Report by UNCTAD-JETRO on South-South Trade
in Asia: the Role of Regional Trade Agreements, UNCTAD/DITC/TAB/
MISC/2008/2, United Nations Publications.
Veeramani, C. (2003), “Liberalisation, Industry-specific Factors and Intra-
Industry Trade In India”, ICRIER Working Paper, No. 97, March.
Wilson, John S. and Otsuki, Tsunehiro (2007), “Regional Integration in
South Asia: What Role for Trade Facilitation?” Policy Research Working
Paper, No. 4423, Development Research Group, the World Bank, December.
World Bank (2004), Trade Policies in South Asia: An overview, Report No.
29949, Volume I: Operational Summary.
World Bank, World Development Indicators Online Database.
World Bank (2008), Doing Business 2008: South Asia.
World Economic Forum (2008), Global Competitiveness Report 2007-08.
World Trade Organisation (2006), Trade Policy Review, September 2006.
World Trade Organisation (2007), Tariff Profile 2006.
Annex I : Top 20 Export Items of SAARC Countries (6-digit HS 1992 Classification) |
Sr No. |
6 Digit Code |
Country |
Bangladesh |
1 |
610910 |
T-shirts, singlets and other vests, of cotton, knit |
2 |
620342 |
Men’s, boys trousers & shorts, of cotton, not knit |
3 |
611090 |
Pullovers, cardigans etc of material nes knit |
4 |
620520 |
Men’s, boys shirts, of cotton, not knit |
5 |
30613 |
Shrimps and prawns, frozen |
6 |
620590 |
Men’s, boys shirts, of material nes, not knit |
7 |
620462 |
Women’s, girls trousers & shorts, of cotton, not knit |
8 |
611020 |
Pullovers, cardigans etc of cotton, knit |
9 |
610510 |
Men’s, boys shirts, of cotton, knit |
10 |
620349 |
Men’s, boys trousers & shorts, material nes, not knit |
11 |
410439 |
Bovine and equine leather, nes |
12 |
530710 |
Yarn of jute or textile bast fibres nes, single |
13 |
620690 |
Women’s, girls blouses & shirts, material nes, not kni |
14 |
611030 |
Pullovers, cardigans etc of manmade fibres, knit |
15 |
620333 |
Men’s, boys jackets, blazers, synthetic fibre, not kni |
16 |
620343 |
Men’s, boys trousers shorts, synthetic fibre, not knit |
17 |
620630 |
Women’s, girls blouses & shirts, of cotton, not knit |
18 |
620469 |
Women’s, girls trousers, shorts, material nes, not kni |
19 |
530310 |
Jute and other textile bast fibres, raw or retted |
20 |
610990 |
T-shirts, singlets etc, of material nes., knit |
India |
1 |
710239 |
Diamonds (jewellery) worked but not mounted or set |
2 |
271000 |
Oils petroleum, bituminous, distillates, except crude |
3 |
711319 |
Jewellery and parts of precious metal except silver |
4 |
260111 |
Iron ore, concentrate, not iron pyrites, unagglomerate |
5 |
100630 |
Rice, semi-milled or wholly milled |
6 |
294200 |
Organic compounds, nes |
7 |
721049 |
Flat rolled iron or non-alloy steel, coated with zinc, width
>600mm, ne |
8 |
300490 |
Medicaments nes, in dosage |
9 |
999999 |
Commodities not specified according to kind |
10 |
610910 |
T-shirts, singlets and other vests, of cotton, knit |
11 |
620630 |
Women’s, girls blouses & shirts, of cotton, not knit |
12 |
30613 |
Shrimps and prawns, frozen |
13 |
620520 |
Men’s, boys shirts, of cotton, not knit |
14 |
711719 |
Imitation jewellery nes of base metal including plate |
15 |
630492 |
Furnishing articles nes, of cotton, not knit, crochet |
16 |
230400 |
Soya-bean oil-cake and other solid residues |
17 |
80130 |
Cashew nuts, fresh or dried |
18 |
630790 |
Made up articles (textile) nes, textile dress pattern |
19 |
870899 |
Motor vehicle parts nes |
20 |
390210 |
Polypropylene in primary forms |
Maldives |
1 |
271000 |
Oils petroleum, bituminous, distillates, except crude |
2 |
610821 |
Women’s, girls briefs or panties, of cotton, knit |
3 |
160414 |
Tuna, skipjack, bonito, prepared/preserved, not mince |
4 |
490700 |
Documents of title (bonds etc), unused stamps etc |
5 |
620462 |
Women’s, girls trousers & shorts, of cotton, not knit |
6 |
610829 |
Women’s, girls briefs or panties, material nes, knit |
7 |
880330 |
Aircraft parts nes |
8 |
230120 |
Flour or meal, pellet, fish, etc, for animal feed |
9 |
620342 |
Men’s, boys trousers & shorts, of cotton, not knit |
10 |
220890 |
Alcoholic liqueurs nes |
11 |
840710 |
Aircraft engines, spark-ignition |
12 |
845229 |
Sewing machines, other than book-sewing machines, nes |
13 |
720429 |
Waste or scrap, of alloy steel, other than stainless |
14 |
220830 |
Whiskies |
15 |
847420 |
Machines to crush or grind stone, ores and minerals |
16 |
490110 |
Brochures, leaflets and similar, in single sheets |
17 |
740400 |
Copper/copper alloy waste or scrap |
18 |
560490 |
Textile yarn/strip, rubber, plastic impregnated/coate |
19 |
240220 |
Cigarettes containing tobacco |
20 |
901590 |
Parts and accessories for surveying etc instruments |
Pakistan |
1 |
630231 |
Bed linen, of cotton, nes |
2 |
100630 |
Rice, semi-milled or wholly milled |
3 |
520512 |
Cotton yarn >85% single uncombed 714-232 dtex,not ret |
4 |
630260 |
Toilet or kitchen linen, of cotton terry towelling |
5 |
610510 |
Men’s, boys shirts, of cotton, knit |
6 |
520819 |
Woven cotton nes, >85% <200g/m2, unbleached |
7 |
620342 |
Men’s, boys trousers & shorts, of cotton, not knit |
8 |
271000 |
Oils petroleum, bituminous, distillates, except crude |
9 |
420310 |
Articles of apparel of leather or composition leather |
10 |
521051 |
Plain weave cotton, <85% +manmade fibre, <200g print |
11 |
570110 |
Carpets of wool or fine animal hair, knotted |
12 |
890510 |
Dredgers |
13 |
521213 |
Woven cotton fabric, > 200g/m2, dyed, nes |
14 |
520522 |
Cotton yarn >85% single combed 714-232 dtex,not retai |
15 |
950662 |
Inflatable balls |
16 |
630210 |
Bed linen, of textile knit or crochet materials |
17 |
940490 |
Articles of bedding nes |
18 |
611490 |
Garments nes, of materials nes, knit |
19 |
610590 |
Men’s, boys shirts, of materials nes, knit |
20 |
901890 |
Instruments, appliances for medical, etc science, nes. |
Sri Lanka |
1 |
90240 |
Tea, black (fermented or partly) in packages > 3 kg |
2 |
90230 |
Tea, black (fermented or partly) in packages < 3 kg |
3 |
621210 |
Brassieres and parts thereof |
4 |
620342 |
Men’s, boys trousers & shorts, of cotton, not knit |
5 |
610910 |
T-shirts, singlets and other vests, of cotton, knit |
6 |
620462 |
Women’s, girls trousers & shorts, of cotton, not knit |
7 |
620469 |
Women’s, girls trousers, shorts, material nes, not kni |
8 |
880330 |
Aircraft parts nes |
9 |
620520 |
Men’s, boys shirts, of cotton, not knit |
10 |
401290 |
Solid or cushioned tyres, interchangeable treads |
11 |
710391 |
Rubies, sapphires and emeralds worked but not set |
12 |
740319 |
Refined copper products, unwrought, nes |
13 |
611020 |
Pullovers, cardigans etc of cotton, knit |
14 |
610510 |
Men’s, boys shirts, of cotton, knit |
15 |
710239 |
Diamonds (jewellery) worked but not mounted or set |
16 |
620630 |
Women’s, girls blouses & shirts, of cotton, not knit |
17 |
611610 |
Gloves impregnated or coated with plastic,rubber, kni |
18 |
620343 |
Men’s, boys trousers shorts, synthetic fibre, not knit |
19 |
610990 |
T-shirts, singlets etc, of material nes, knit |
20 |
620690 |
Women’s, girls blouses & shirts, material nes, not kni |
Source: Compiled from the UNCTAD COMTRADE Database. |
|