|
Introduction
4.1 Co-operative banking in India has made substantial progress in dissemination of banking services based on co - operative principles. In view of the special thrust on financial inclusion, co-operative banking has acquired renewed significance in the Indian financial system. The focus of the recent policy measures, therefore, has once again shifted to the strengthening of co-operative banking in India. The review of the problems of rural cooperatives by the Task Force (2004) constituted by the Government of India and the Vision Document on urban co-operative banks (UCBs) released in March 2005 by the Reserve Bank, have provided a fresh framework with practical and implementable arrangements to rejuvenate the Indian co-operative banking structure. The emphasis of the recent initiatives has been to revitalise these institutions for reinstating the confidence of the public in the co-operative banking system. While designing the regulatory and supervisory framework, care is being taken to preserve their co-operative character and institutional specifics.
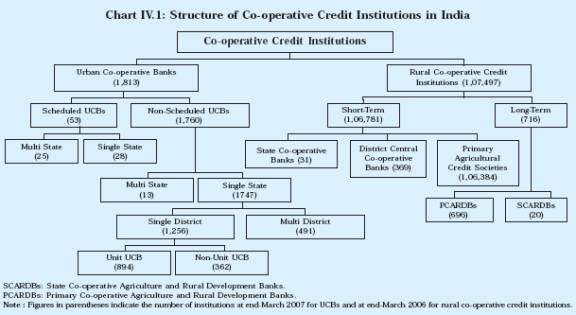
4.2 The co-operative banking structure in India comprises two main components, viz., urban co-operative banks and rural co-operative credit institutions. While urban co-operative banks have a single tier structure, rural cooperatives have a complex structure. Rural cooperative credit institutions have two distinct structures, viz., the short-term co-operative credit structure (STCCS) and the long-term cooperative credit structure (LTCCS). Within the STCCS, primary agricultural credit societies (PACS) at the village level form the base level, while district central co-operative banks (DCCBs) are placed at the intermediate level, and the State co-operative banks (StCBs) at the apex level. The STCCS mostly provide crop and other working capital loans primarily for a short period to farmers and rural artisans. The long-term structure of rural co-operatives comprises State co-operative agriculture and rural development banks (SCARDBs) at the State level, and primary co-operative agriculture and rural development banks (PCARDBs) at the decentralised district or block level. These institutions focus on providing typically medium to long-tem loans for making investments in agriculture, rural industries, and lately housing. The structure of rural co-operative banks is not uniform across the States of the country, and varies significantly from one State to another. Some States have a unitary structure with the State level banks operating through their own branches, while others have a mixed structure incorporating both unitary and federal systems (Chart IV.1).
4.3 Given the significant role played by urban co-operative banks in providing banking services to the middle and lower income people, the Reserve Bank continued to take initiatives to strengthen these banks. In June 2004, it was decided not to issue fresh licenses for setting up new banks or for opening new branches, until a suitable framework for regulation and supervision was put in place for the existing UCBs. In March 2005, the Reserve Bank prepared a draft Vision document for UCBs which, inter alia, discussed the problems of the sector and highlighted the issue of dual regulatory mechanism which restricted the ability of the Reserve Bank in handling the weaknesses of entities in the sector. In order to address the problem of dual control, Vision document proposed the adoption of a consultative approach for deciding the future set up of weak and sick banks in each State. In terms of the Vision document, the Reserve Bank approached the State Governments for signing MOU to ensure greater convergence of approach of the two agencies entrusted with the regulation and supervision of UCBs. As part of the MOU, it was decided to set up State level Task Force for Co-operative Urban Banks (TAFCUBs) comprising representatives of the Reserve Bank, State Government and federation/association of UCBs. The TAFCUB was entrusted to identify the potentially viable and non viable UCBs in the State and provide a revival path for the former and a non-disruptive exit route for the latter set of banks. The exit route could include merger/ amalgamation with stronger banks, conversion into societies or ultimately as a last resort, through liquidation. Till date MOUs have been signed with 13 State Governments and Central Government (in respect of multi-State UCBs), which encompass 1,511 UCBs, i.e., 83 per cent of the banks representing 92 per cent of deposits of the sector. The impact of the initiatives in the recent past is perceptible as there is enhancement of public confidence in the sector which is reflected in the increase of deposits during 2006-07 and 2005-06, reversing the declining trend of 2004-05.
4.4 Taking into account the comfort of coordinated supervision/regulation in the States that have signed MOU with the Reserve Bank, certain business opportunities have been extended to the eligible banks in such States as also to the multi-State UCBs. It was announced in the Annual Policy statement for the year 2006-07 that financially sound banks in such States would also be permitted to open new branches, a facility which was not available to UCBs from 2004. The focus for the sector now is, inter alia, on development of Human Resources (HR) and Information Technology (IT) infrastructure as also on several aspects of governance. Also, the consolidation of UCBs through the process of merger of weak entities with stronger ones has been set in motion providing transparent and objective guidelines for granting ’no objection’ to merger proposals. As on October 30, 2007, a total of 33 mergers had been effected upon the issue of statutory orders by the Central Registrar of Cooperative Societies/Registrar of Co-operative Societies (CRCS/RCS) concerned. In addition to the existing 1,813 UCBs at end-March 2007, 259 UCBs were under various stages of liquidation. Despite the reduction in the number of UCBs, their business operations expanded at a moderate rate. The asset quality of the UCBs also improved significantly.
4.5 The recommendations of the Task Force (Chairman: Prof. A.Vaidyanathan) appointed by the Government of India in 2004 to propose an action plan for reviving the short-term rural cooperative credit structure have been accepted in principle. The Government of India, in consultation with the State Governments, has approved a revival package for the STCCS which was communicated to the State Governments in January 2006. NABARD has been designated the Implementing Agency for implementing the Revival Package in all the States. The process of implementing the revival package in any State begins with the signing of the MoU among the GoI, the participating State Government and NABARD. A special audit of all PACS, DCCBs and StCB in every participating State would be undertaken to arrive at a true and fair assessment of the amount of accumulated losses as on March 31, 2004 as also a fair and acceptable proportion of such losses on the basis of the origin of such losses, i.e., losses due to credit business, public distribution (PDS) business, or other trading business. Every participating State would also promulgate an Ordinance as per para 9 of the MoU to amend the State Co-operative Societies Act to give effect to the institutional and legal reforms envisaged in the revival package or would enact the necessary legislation. Implementation of the package has begun in thirteen States, viz., Andhra Pradesh, Arunachal Pradesh, Bihar, Chhattisgarh, Gujarat, Haryana, Madhya Pradesh, Maharashtra, Orissa, Rajasthan, Uttarakhand, Uttar Pradesh and West Bengal, which have executed the MoUs with the Government of India and NABARD with conduct of special audits of PACS and HRD initiatives. These States have also initiated steps for bringing in necessary legal amendments to the respective Co-operative Societies Acts.
4.6 Balance sheets of all segments of the rural co-operative banking sector, except PACS, expanded during 2005-06 (Appendix Table IV.1). However, their financial performance worsened during the year. Wide variations were also observed in the financial performance of different segments of the rural co-operative banking sector. While the upper tier of both short-term and long-term rural co -operative credit institutions made profits during 2005-06, the lower tier (viz., PACS and PCARDBs) made overall losses. Asset quality of all types of rural co-operative banks deteriorated, except PACS, which improved their recovery performance. The recovery performance of DCCBs and PCARDBs also worsened during the year.
4.7 This chapter covers the developments in the co-operative banking sector, both rural and urban, as well as deals with the micro-finance initiatives of NABARD. The Chapter is organised into six sections. Section 2 deals with the policy measures as well as the business operations of urban co-operative banks, while Section 3 focusses on the policy developments and performance of rural co-operative banks. The developments in the area of micro credit, which has emerged as an important purveyor of credit in remote and rural areas, are discussed in Section 4. Section 5 delineates the role played by NABARD in shaping the developments in the rural co-operative sector during the year. Section 6 deals with the measures initiated for revival of the rural co-operative banking sector in the light of the Vaidyanathan Committee’s recommendations in this area.
2. Urban Co-operative Banks Policy Developments
4.8 In order to develop a consultative mechanism for regulation and supervision of UCBs, the process of signing of MoUs with the Reserve Bank progressed satisfactorily during the year. The Reserve Bank formulated less stringent prudential norms for smaller UCBs with deposit base of less than Rs.100 crore and having branches limited to a single district, i.e., Tier I banks, in line with the proposals in the Vision Document for UCBs. Besides, the Reserve Bank issued a number of guidelines relating to interest rates, prudential norms, disclosure and exposure norms and risk management. In view of the special dispensation of UCBs with respect to urban poor, the guidelines on credit delivery, customer service and financial inclusion were further fine-tuned.
Structural Initiatives
Vision Document
4.9 The Vision Document for UCBs highlighted the problems of the sector and outlined the broad measures to be adopted to enable the UCBs emerge as a sound and healthy network of banking institutions providing need based quality banking services, essentially to the middle and lower middle classes and marginalised sections of the society. In line with the proposals of the Vision Document, the Reserve Bank continued to take several initiatives during the year.
Two-tier Regulatory Structure
4.10 The Vision Document sets out the objective of rationalising the regulatory and supervisory framework for UCBs to enable the smaller UCBs gain in strength. In order to achieve this objective, banks were classified as Tier I banks, i.e., banks having branch/s within a single district and deposits below Rs.100 crore and Tier II banks, i.e., all other UCBs. Prudential norms for Tier I and Tier II banks were also revised. While Tier II banks are under the 90-days delinquency norm as applicable to commercial banks, the 180-day loan delinquency norm for Tier I banks has been extended up to March 31, 2008. This is intended to provide a measure of relief to the small UCBs as lower provisioning is required, which, in turn, would translate into higher profits that could be used to shore up the capital base of these banks. These banks are, however, required to build up adequate provisions in the intervening period to enable them to migrate to 90-day norms in future.
4.11 Further, the following differential asset classification and provisioning norms have been enunciated for Tier I banks : (i) the 12-month period for classification of a sub-standard asset in doubtful category will be effective from April 1, 2008; (ii) these banks would be required to provide 100 per cent on the secured portion of D-III advances (doubtful for more than 3 years) classified as doubtful more than 3 years on or after April 1, 2010; (iii) For the outstanding stock of D-III advances as on March 31, 2010, banks will be required to provide as under: (a) 50 per cent as on March 31, 2010; (b) 60 per cent as on March 31, 2011; (c) 75 per cent as on March 31, 2012; and (d) 100 per cent as on March 31, 2013. For Tier II banks, (i) 100 per cent provisioning for advances classified as D-III will apply to those classified as such on or after April 1, 2007 instead of those so classified on or after April 1, 2006; (ii) for the outstanding stock of D-III assets as on March 31, 2007, banks are required to provide as: (a) 50 per cent up to March 31, 2007; (b) 60 per cent as on March 31, 2008; (c) 75 per cent as on March 31, 2009; and (d) 100 per cent as on March 31, 2010.
4.12 In order to ensure that asset quality is maintained despite high credit growth, it was decided in respect of Tier II banks to increase the general provisioning requirement on standard advances in specific sectors, i.e., personal loans, loans and advances qualifying as capital market exposures and commercial real estate loans from the existing level of 1.0 per cent to 2.0 per cent.
4.13 Another relaxation extended to Tier I banks pertains to investments made in Government securities. In view of market risks associated with such investments, Tier I UCBs have been given exemption from maintaining SLR in government securities (up to 15 per cent of NDTL) to the extent of funds placed in interest bearing deposits with State Bank of India and its subsidiary banks and the public sector banks including Industrial Development Bank of India Ltd. Tier II banks have also been subjected to the stricter provisioning norms on ‘standard advances’ which can be 2 per cent for certain type of exposures. As a part of rationalisation of supervision, while the larger UCBs are placed under a composite off-site surveillance (OSS) reporting system comprising a set of eight prudential supervisory returns, a simplified reporting system consisting of five returns has been introduced for the smaller banks having deposits between Rs.50 crore and Rs.100 crore and whose branches are limited to a single district. The simplified OSS reporting framework would be extended to banks with deposits below Rs.50 crore in the near future.
Alternative Mechanism to Address the Problems of Dual Control
4.14 States having a large number of UCBs were approached by the Reserve Bank for signing Memorandum of Understanding (MoU) to develop a consultative mechanism for regulation and supervision of UCBs. So far, MoUs have been signed with 13 States, viz., Gujarat, Andhra Pradesh, Karnataka, Madhya Pradesh, Uttarakhand, Rajasthan, Chhattisgarh, Goa, Maharastra, Haryana, National Capital Territory of Delhi, West Bengal and Assam which together account for 1,511 out of 1,813 banks as at end-March 2007, i.e., 81.5 per cent of total number of UCBs and 67 per cent of total deposits of the sector. In addition, an MOU has also been signed between the Reserve Bank and the Central Government in respect of Multi-State UCBs that account for 25.5 per cent of deposits of the sector. As such, a total of 83 per cent of UCBs accounting for over 92 per cent of total deposits are covered under the MoU arrangements and the problems of all such banks are being addressed through consultation with other significant stakeholders such as State/Central Government and Federation/Association of UCBs.
4.15 As part of the arrangements under MoU, the Reserve Bank is committed to constituting State level Task Force for Cooperative Urban Banks (TAFCUB) comprising representatives of the Reserve Bank, State Government and the UCB sector. Accordingly, TAFCUBs have been constituted in all States with which MoUs have been signed. A Central TAFCUB has been constituted for the Multi-State UCBs. The TAFCUBs identify potentially viable and non-viable UCBs in the State and suggest revival path for the viable and non-disruptive exit route for the non-viable ones.
4.16 The exit of non-viable banks could be through merger/amalgamation with stronger banks, conversion into societies or ultimately as a last resort, through liquidation. This institutional arrangement for addressing issues of supervisory concern is not available for banks in States that are yet to sign MoU with the Reserve Bank.
4.17 Further, arising out of the comfort of coordinated supervision/regulation in States that have signed MoU with the Reserve Bank, certain additional business opportunities have been extended to the eligible banks in such States as also to the Multi – State UCBs. These facilities include permission to set up currency chests, sell mutual fund products, grant of Authorised Dealer category I and II license, permission to open new ATMs, relaxed norms for conducting insurance business on non-risk participation basis and conversion of extension counters into branches.
It was also announced in the Annual Policy 2006-07 that financially sound banks in such States would also be considered for being given licences to open new branches, a facility which was not available to the UCBs since 2004.
Merger /Amalgamation and Exit of Unviable Entities.
4.18 The process of mergers among UCBs was provided a fresh impetus with the issue of transparent guidelines for grant of ‘no objection’ to merger proposals by the Reserve Bank (Box IV.1).
Box IV.1: Merger and Amalgamation of UCBs
The consolidation of the sector through the process of merger of weak entities with stronger ones has been set in motion by providing transparent and objective guidelines for granting no-objection to merger proposals. The Reserve Bank, while considering proposals for merger/ amalgamation, confines its approval to the financial aspects of the merger taking into consideration the interests of depositors and financial stability. Almost invariably it is a voluntary decision of the banks that approach the Reserve Bank for obtaining no objection for their merger proposal. The guidelines on mergers are intended to facilitate the process by delineating the pre-requisites and steps to be taken for merger between banks.
Pursuant to the issue of guidelines on merger of UCBs, the Reserve Bank received 60 proposals for merger in respect of 52 banks. The Reserve Bank has issued no objection certificate (NOC) in 37 cases. Of these, 20 mergers became effective upon the issuance of statutory orders by the Central Registrar of Co-operative Societies (CRCS)/Registrar of Cooperative Societies (RCS) concerned. Fourteen proposals for merger were rejected by the Reserve Bank, while three proposals were withdrawn by the banks. The remaining six are under consideration (Table 1 and 2). Most of the target banks were loss-making UCBs. In a few cases, mergers were permitted even of profit making banks with the aim of consolidation and in some cases merger were permitted in respect of such banks, as they were not considered viable on a stand-alone basis in the long run.
The process of merger and amalgamation is elaborate. The merger proposal has to be submitted by the acquirer bank to RCS/CRCS and a copy of the proposal is also simultaneously forwarded to the Reserve Bank along with certain specified information. The Reserve Bank examines the proposals and places the same before an Expert Group for screening and recommendations. On evaluation, if the proposal is found to be suitable, the Reserve Bank issues NOC to the RCS/CRCS and the banks concerned. RCS/ CRCS then issues the order of amalgamation of the target UCB in compliance with the provisions of the Co-operative Societies Act under which the bank is registered.
Table 1: State-wise Break up of Acquirer Banks |
(as on May 21, 2007) |
Sr. |
Act Under |
No. of |
No. of |
No. of |
No. of |
No. of |
Proposals |
No. |
Which |
Acquirer |
Proposals |
NOC |
Proposals |
Proposals |
Under |
|
Registered |
Banks |
Submitted |
Issued |
Rejected |
Withdrawn |
Processing |
1 |
2 |
3 |
4 |
5 |
6 |
7 |
8 |
1. |
Multi-State |
7 |
20 |
15 |
4 |
1 |
Nil |
2. |
Maharashtra |
11 |
18 |
8 |
6 |
Nil |
4 |
3. |
Gujarat |
8 |
11 |
9 |
1 |
1 |
Nil |
4. |
Andhra Pradesh |
3 |
3 |
2 |
1 |
Nil |
Nil |
5. |
Karnataka |
3 |
3 |
2 |
1 |
Nil |
Nil |
6. |
Rajasthan |
1 |
1 |
Nil |
1 |
Nil |
Nil |
7. |
Punjab |
1 |
1 |
1 |
Nil |
Nil |
Nil |
8. |
Uttarakhand |
3 |
3 |
Nil |
Nil |
1 |
2 |
Total (1 to 8) |
37 |
60 |
37 |
14 |
3 |
6 |
Table 2: State-wise Break up of Acquired Banks |
(as on May 21, 2007) |
Sr. |
Act Under Which Registered |
No. of Acquired |
No. of Proposals |
No. of NOC |
No. of |
Merged |
No. of Proposals |
Proposals |
Under |
No. |
|
Banks |
Submitted |
Issued |
|
Banks |
Withdrawn |
Rejected |
process |
1 |
2 |
3 |
4 |
5 |
|
6 |
7 |
8 |
9 |
1. |
Multi-State |
1 |
2 |
1 |
|
1 |
Nil |
1 |
Nil |
2. |
Maharashtra |
17 |
21 |
11 |
|
5 |
1 |
6 |
3 |
3. |
Gujarat |
14 |
15 |
13 |
|
6 |
1 |
1 |
Nil |
4. |
Andhra Pradesh |
7 |
7 |
6 |
|
5 |
Nil |
1 |
Nil |
5. |
Karnataka |
3 |
5 |
3 |
|
1 |
Nil |
2 |
Nil |
6. |
Goa |
1 |
1 |
1 |
|
1 |
Nil |
Nil |
Nil |
7. |
Rajasthan |
1 |
1 |
Nil |
|
Nil |
Nil |
1 |
Nil |
8. |
Delhi |
1 |
1 |
Nil |
|
Nil |
Nil |
1 |
Nil |
9. |
Punjab |
1 |
1 |
1 |
|
1 |
Nil |
Nil |
Nil |
10. |
Madhya Pradesh |
3 |
3 |
1 |
|
Nil |
Nil |
1 |
1 |
11. |
Uttarakhand |
3 |
3 |
Nil |
|
Nil |
1 |
Nil |
2 |
Total (1 to 11) |
52 |
60 |
37 |
|
20 |
3 |
14 |
6 |
Interest Rates / Maintenance of CRR
Interest Rates on Non-Resident Deposits
4.19 Urban co-operative banks were prohibited from granting fresh loans in excess of Rs.20 lakh against NRE and FCNR(B) deposits, either to depositors or to third parties. Banks were also advised not to undertake slicing of the loan amount to circumvent the ceiling.
4.20 In keeping with the announcement made in the Review of Annual Policy Statement 2006-07, UCBs, which are authorised dealers in foreign exchange, were advised that in respect of FCNR (B) deposits of all maturities contracted effective from the close of business in India as on January 31, 2007, interest shall be paid within the ceiling rate of LIBOR/ SWAP rates for the respective currency/corresponding maturities minus 25 basis points. From close of business as on April 24, 2007, the rates on FCNR (B) deposits were further revised to the ceiling rate of LIBOR/SWAP rates for the respective currency/corresponding maturities minus 75 basis points. On floating rate deposits, interest can be paid within the ceiling of SWAP rates for the respective currency/maturity minus 25 basis points. For floating rate deposits interest can be reset once in every six months. The interest rates were further revised to the ceiling of SWAP rates for the respective currency/ maturity minus 75 basis points.
Interest Rates on Non-Resident (External) Rupee (NRE) Deposits
4.21 UCBs were advised that with effect from the close of business in India as on April 24, 2007, the interest rates on fresh Non-Resident (External) Rupee term deposits for one to three years maturity should not exceed the LIBOR/SWAP rates, as on the last working day of the previous month, for US dollar of corresponding maturities
Policy on CRR/SLR
4.22 The cash reserve ratio (CRR) for scheduled primary (urban) co-operative banks as a percentage of net demand and time liabilities (NDTL) was increased from 5 per cent to 7.0 per cent in seven stages (Table IV.1).
4.23 The Reserve Bank also exempted those banks from payment of penal interest which had breached the statutory minimum CRR level of 3.0 per cent during the period from June 22, 2006 to
Table IV.1: Changes in CRR |
|
Effective date* |
CRR on NDTL |
|
|
(per cent) |
|
1 |
2 |
1. |
23-Dec-06 |
5.25 |
2. |
6-Jan-07 |
5.50 |
3. |
17-Feb-07 |
5.75 |
4. |
3-Mar-07 |
6.00 |
5. |
14-Apr-07 |
6.25 |
6. |
28-Apr-07 |
6.50 |
7. |
4-Aug-07 |
7.00 |
* : From the fortnight beginning. |
|
March 2, 2007. The Government of India in the Extraordinary Gazette notification dated March 9, 2007 notified Section 3 of the Reserve Bank of India (Amendment) Act, 2006 and fixed April 1, 2007 as the date on which the related provisions would come into force. Pending notification, it was also decided that the Reserve Bank will also pay interest to all scheduled primary (urban) cooperative banks on the eligible CRR balances maintained with the Reserve Bank at the rate of (a) 3.50 per cent per annum from the fortnight beginning June 24, 2006 to December 8, 2006; (b) 2.00 per cent from the fortnight beginning from December 9, 2006 to February 16, 2007; (c) 1.00 per cent from the fortnight beginning from February 17, 2007. It was also decided that with effect from the fortnight beginning April 14, 2007, all scheduled UCBs would be paid interest at the rate of 0.50 per cent per annum on eligible cash balances maintained with the Reserve Bank (instead of 1 per cent as hitherto).
4.24 The Extraordinary Gazette notification dated January 9, 2007 of the Government of India, however, notified January 9, 2007 as the date on which all the provisions, except Section 3, of the Reserve Bank of India (Amendment) Act, 2006 would come into force. Section 3 of the Reserve Bank of India (Amendment) Act, 2006 provided for the removal of the ceiling and floor on the CRR to be prescribed by the Reserve Bank as also the provisions for interest payment on eligible CRR balances. Pending the notifications of the relevant provisions, the floor and ceiling on CRR were restored and the Reserve Bank decided to pay interest on eligible CRR balances but consistent with the monetary policy stance and measures at relevant periods of time. Consistent with the amendment, it was decided that with effect from the fortnight beginning March 31, 2007, the Reserve Bank will not be paying any interest on the CRR balances maintained by scheduled primary (urban) co-operative banks.
Regulatory Initiatives
Risk Management
4.25 Tier II banks are required to increase the general provisioning requirement on standard advances in specific sectors, i.e., personal loans, loans and advances qualifying as capital market exposures and commercial real estate loans from the existing level of one per cent to two per cent. Risk weight on exposure to commercial real estate was increased from 100 per cent to 150 per cent.
4.26 UCBs were advised that the bills purchased/discounted/negotiated under LC (where the payment to the beneficiary is not made ‘under reserve’) should be treated as an exposure on the LC issuing bank and not on the borrower. All clean negotiations as indicated above are required to be assigned the risk weight, as is normally applicable to inter-bank exposures, for capital adequacy purpose. In the case of negotiations ‘under reserve’, the exposure should be treated as on the borrower and risk weight assigned accordingly.
4.27 In the backdrop of a booming stock market, UCBs were advised to monitor on a continuous basis, the end use of funds sanctioned by them. Banks were further advised to submit the reports of the findings of the audit examinations for discussion before the Audit Committee of the Board and with their comments put up the report to the board of directors.
4.28 The issue of correct and realistic valuation of fixed assets owned by banks and those accepted by them as collateral for a sizable portion of their advances portfolio assumes significance in view of its implications for correct measurement of capital adequacy position. Accordingly, guidelines were issued to banks, which they should follow while formulating a policy on valuation of properties and appointment of valuers for the purpose.
4.29 The Government of India and the National Security Council has taken a view that disbursement of forged notes through ATMs would be treated as an attempt to circulate forged notes. Accordingly, UCBs were advised to establish a ‘Forged Note Vigilance Cell’ at their Head Office to perform the function of (i) dissemination of Reserve Bank instructions on forged notes to their branches; (ii) monitoring its implementation; and (iii) compilation of data on detection of forged notes and follow up of such cases filed with police.
4.30 Based on directions of Delhi High Court, UCBs were advised to ensure that housing loans are sanctioned only for authorised structures and the banks have to obtain an undertaking on an affidavit from the loan applicants that the building/s will be constructed as per sanctioned plans, which are to be attached with the undertaking.
KYC Norms/AML Standards/Combating of Financing of Terrorism
4.31 UCBs were advised to ensure that they are fully compliant with anti money laundering standards. Chief Executive Officers (CEOs) of UCBs were required to personally monitor the progress in implementing the KYC guidelines and AML procedures in letter and spirit and put in place a system of fixing responsibility for breach of instructions issued. They were also required to furnish a compliance certificate in this regard.
4.32 As wire transfer is an instantaneous and most preferred route for transfer of funds across the globe, there is a need for preventing terrorists and other criminals from having unfettered access to wire transfers for moving their funds and for detecting any misuse when it occurs. UCBs were, therefore, advised to invariably ensure certain information about all wire transfers. All cross-border wire transfers must be accompanied by accurate and meaningful information about the originator, i.e., name and address of the originator, details of the existing account or unique reference number as prevalent in the country. Complete originator information, i.e., name, address, account number, etc., must be accompanied/made available to the beneficiary bank for all domestic wire transfers of Rs.50,000 and above. If a bank has reason to believe that a customer is intentionally structuring wire transfers to below Rs.50,000 to several beneficiaries in order to avoid reporting or monitoring, the bank must insist on complete customer identification before effecting the transfer. In case of non-co-operation from the customer, efforts should be made to establish his identity and suspicious transaction report (STR) should be made to Financial Intelligence Unit – India (FIU-IND). When a credit or debit card is used to effect money transfer, necessary information of the originator should be included in the message. Inter-bank transfers and settlements where both the originator and beneficiary are banks or financial institutions are exempted from the above requirements.
4.33 An ordering bank where the wire transfer originates must ensure that qualifying wire transfer contains complete originator information and intermediary bank should ensure that the same is retained with the transfer. The record of such information should be preserved for a period of 10 years. A beneficiary bank should have effective risk-based procedures in place to identify wire transfers lacking complete originator information. The lack of complete originator information may be considered as a factor in assessing whether a wire transfer or related transactions are suspicious and whether they should be reported to the FIU-IND.
Corporate Governance
4.34 In terms of the Joint Parliamentary Committee Report on Stock Market Scam and Matters Related thereto, UCBs were prohibited from October 1, 2003, to extend any loans and advances (both secured and unsecured) to the directors, their relatives and the firms/ concerns/ companies in which they are interested. However, on reconsideration it was decided on October 6, 2005, with the approval of Government of India, to exclude (i) regular employee – related loans to staff directors on the board of UCBs; (ii) normal loans, as applicable to members, to the directors on the boards of salary earners’ co-operative banks; and (iii) normal employee-related loans to managing directors of multi-state co-operative banks from the purview of the above instructions. As a further measure of relaxation, UCBs were permitted, in consultation with the Government, to allow the directors and their relatives to avail loans against fixed deposits and life insurance policies standing in their own name.
Credit Delivery and Financial Inclusion
Priority Sector Lending
4.35 With a view to rationalising banks’ investment under priority sector lending and to encourage the banks to increasingly lend directly to priority sector borrowers, investments made by banks in the bonds issued by NHB/HUDCO on or after April 1, 2007 are not considered eligible for classification under priority sector lending.
4.36 UCBs have been allowed to extend individual housing loans up to the limit of Rs.25 lakh per beneficiary of a dwelling unit. However, housing finance to borrowers availing loans above Rs.15 lakh is not treated as priority sector lending.
4.37 An important objective of the Prime Minister’s 15 Point Programme for the Welfare of Minorities is to ensure that an appropriate percentage of priority sector lending is targeted for the minority communities and that the benefits of various government sponsored schemes reach the under-privileged. UCBs were, therefore, advised to ensure that within the overall target for priority sector lending and the sub-target of 25 per cent for the weaker sections, sufficient care is taken to ensure that the minority communities also receive an equitable portion of the credit.
4.38 The definition of micro, small and medium enterprises was modified and was required to be implemented by the banks with immediate effect. UCBs were advised about the definitions of micro, small and medium enterprises engaged in manufacturing or production and in providing or rendering services as under: (i) Enterprises engaged in the manufacture or production, processing or preservation of goods – (a) where investment in plant and machinery does not exceed Rs.25 lakh is a micro enterprise; (b) where the investment in plant and machinery is more than Rs.25 lakh but does not exceed Rs.5 crore is a small enterprise; (c) where the investment in plant and machinery is more than Rs.5 crore but does not exceed Rs.10 crore is a medium enterprise; and (ii) Enterprises engaged in providing or rendering services – (a) where the investment in equipments does not exceed Rs.10 lakh is a micro enterprise; (b) where the investment in equipment is more than Rs.10 lakh but does not exceed Rs.2 crore is a small enterprise; (c) where the investment in equipment is more than Rs.2 crore but does not exceed Rs.5 crore is a medium enterprise (also refer Box II.4). Bank’s lending to medium enterprises is not reckoned for the purpose of lending to priority sector.
Guidelines for Relief to Poultry Industry
4.39 Owing to the outbreak of Avian Influenza (bird flu) in some parts of the country, poultry units were facing severe constraints. According to the guidelines issued to UCBs the principal and interest due on working capital loans as also instalments and interest on term loans fallen due for payments on or after February 1, 2006 were to be converted into term loans which should be recovered in instalments based on projected future inflows over a period of three years with an initial moratorium of up to one year. The relief was extended to all poultry accounts classified as standard as on March 31, 2006. Instructions were issued to UCBs about the scope and manner of calculation and disbursement of interest subvention to poultry industry.
Package of Relief Measures to the Vidarbha Region in Maharashtra
4.40 In order to mitigate distress of farmers in the debt-ridden districts of Vidarbha, banks were advised to implement the rehabilitation package in respect of agricultural credit as announced by the Hon’ble Prime Minister. The package is applicable to the districts of Amaravati, Wardha, Yeotmal, Akola, Washim and Buldhana. The entire interest on overdue loans to farmers as on July 1, 2006 is required to be waived for farmers in the above mentioned six districts and they should have no past interest burden as on that date. The overdue loans as on July 1, 2006 are required to be rescheduled over a period of 3-5 years with a one-year moratorium. After rescheduling as above, fresh need based credit facility can be extended to the farmers.
Relief to be Extended by Banks in Areas Affected by Natural Calamities
4.41 In the context of the recent floods that have affected various parts of the country, banks were advised to ensure accessibility to customers to their bank accounts with alternate arrangements like operating the branches from temporary premises, extension counters, satellite offices and restoration of functioning of ATMs.
4.42 To facilitate opening of new accounts by persons affected by natural calamities, especially for availing various reliefs given by Government / other agencies, banks were advised to open accounts with alternative arrangements for ensuring KYC procedures, in case where the balance in the account does not exceed Rs.50,000, or the amount of relief granted (if higher) than Rs.50,000 and the total credit in the account does not exceed Rs.1,00,000, or the amount of relief, (if higher than Rs.1,00,000) in a year.
4.43 To ensure continuity in clearing service, banks were advised for ‘on-city back-up centres’ in 20 large cities and effective low-cost settlement solutions for the remaining cities. Banks were advised to consider discounting cheques for higher amounts to meet customers’ requirement of funds. They could also consider waiver of fees for EFT, ECS or mail services so as to facilitate inward transfer of funds to accounts of persons affected by a natural calamity.
4.44 UCBs were advised that the present limit for sanction of consumption loans may be enhanced to Rs.5,000 without any collateral and such loans may be provided even if no risk fund has been constituted by the State Governments. While restructuring existing loans, the principal amount outstanding in the crop loans and agricultural term loans as well as accrued interest thereon may be converted into term loans. The restructured period for repayment may be 3 to 5 years. Where the damage is very severe, banks may extend the repayment period up to 7 years and in extreme hardship cases may be prolonged up to 10 years without additional collateral security.
Relief for Stressed Farmers in Andhra Pradesh, Karnataka and Kerala
4.45 The Union Government had approved a package of relief measures for debt stressed farmers from 25 specified districts in the States of Andhra Pradesh, Karnataka and Kerala. Accordingly, all UCBs in these States and multi-state co-operative banks were advised to ensure that all the farmers’ loan-accounts in the specified districts, which are overdue as on July 1, 2006 are rescheduled over a period of 3-5 years with a one-year moratorium and the interest thereon (as on July 1, 2006) is fully waived. Fresh finance could also be extended to such farmers.
Relief Measures to Assist Distressed Farmers
4.46 As per announcement made in the Mid-term Review of Annual Policy Statement for the year 2006-07, it was decided to extend the benefits of one time settlement (OTS) schemes to such distressed farmers whose accounts had earlier been rescheduled/converted on account of natural calamities as also such farmers defaulting on their loans due to circumstances beyond their control. All multi-state UCBs were advised to frame transparent OTS policies for such farmers, with the approval of their boards.
4.47 UCBs were advised to ensure that full address/telephone numbers of the branch is invariably mentioned in the pass book/statement of accounts issued to account holders in order to improve the quality of service available to customers in branches.
Customer Services
4.48 To enable banks to provide better customer service, UCBs were allowed to undertake following limited transactions at the extension counters: (i) deposit/withdrawal transactions; (ii) Issue and encashment of drafts and mail transfers; (iii) issue and encashment of travellers’ cheques; (iv) collection of bills; (v) advances against fixed deposits of their customers (within the sanctioning power of the concerned official at the Extension Counter); and (vi) disbursement of other loans (only for individuals) sanctioned by the head office/ base branch up to the limit of Rs.10 lakh only.
4.49 UCBs were advised to implement the recommendations of the Working Group on ‘Formulating a Scheme for Ensuring Reasonableness of Bank Charges’ as accepted by the Reserve Bank. They were also advised to ensure that customers are made aware of the service charges upfront and are implemented only with the prior notice to the customer.
4.50 In terms of the existing instructions, the decision to prescribe service charges is left to the discretion of the boards of individual banks. Banks are normally expected, while fixing the service charges, to ensure that charges are reasonable, consistent with the cost of providing these services and that the customers with low value/volume of transactions are not penalised. All UCBs have been advised to display and update in their offices/ branches, as also on their website, the details of various service charges in the prescribed format. This is also to be displayed in the local languages.
4.51 Scheduled UCBs have also been advised to display and update on the homepage of their websites the details of certain service charges and fees at a prominent place under the title of ‘Service Charges and Fees’ so as to facilitate easy access to the bank customers. They were also advised to provide on the homepage itself a complaint form along with the name of the nodal officer for complaint redressal. The form should indicate that the first point for redressal of complaint is the bank itself and that the complainant may approach Banking Ombudsman only if the complaint is not resolved at the bank within a month.
4.52 UCBs are required to ensure that duplicate DDs are issued within a fortnight from the receipt of such requests. For delays beyond this stipulated period, UCBs were advised to pay interest to compensate the customers for such delay.
4.53 In view of the complaints received by the Reserve Bank/Banking Ombudsmen, UCBs were advised not to compel their customers to drop cheques in drop boxes and to invariably display on the cheque drop box itself that: ‘Customers can also tender the cheques at the counter and obtain acknowledgement on the pay-in-slip.’
4.54 UCBs were advised to invariably offer passbook facility to all their savings bank account holders (individuals), as it is more convenient than statement of account for small customers. Further, they should not recover the cost of providing such passbooks from the customers.
4.55 UCBs were advised to ensure that cheques/ drafts issued by clients containing fraction of a rupee are not rejected or dishonoured by them. Banks were also advised to ensure that the concerned staffs are well versed with these instructions so that general public does not suffer. They should also ensure that appropriate action is taken against members of their staff who refuse to accept cheques/drafts containing fraction of a rupee. Banks were also advised to note that violation of aforesaid instructions would be liable to be penalised under the provisions of Banking Regulation Act, 1949 [as applicable to co-operative societies (AACS)].
4.56 In keeping with a recent Allahabad High Court judgment, UCBs were advised to generally insist that a person opening a deposit account makes a nomination. The bank should explain the advantages of nomination facility to the depositor and if the person still does not want to nominate, the bank should ask him to give a specific letter to the effect that he does not want to make nomination. In case the person declines to give such a letter, the bank should record the fact on the account opening form and proceed with the opening of the account, if otherwise found eligible.
4.57 Though interest rates charged by UCBs were deregulated, rates of interest beyond a certain level were seen to be usurious and were not conforming to normal banking practice. UCBs were, therefore, advised to lay down appropriate internal principles and procedures, so that usurious interest, including processing and other charges, are not levied by them on loans and advances.
Other Policy Initiatives
Distribution of Units of Mutual Funds
4.58 UCBs registered in States which have signed MoU and those registered under Multi-State Co-operative Societies Act, 2002 were permitted to enter into agreement with mutual funds for marketing their units, subject to certain prescribed norms.
Conduct of Foreign Exchange Business by UCBs
4.59 UCBs registered under the Co-operative Societies Act of a State, which has signed MoU, or under the Multi-State Co-operative Societies Act, 2002, were permitted for Authorised Dealer (AD) Category I and II licence, subject to compliance with certain prescribed norms. In addition to existing two UCBs having AD category I license, two more banks were given AD category I license. Banks having AD category II licence are permitted to release/remit foreign exchange for certain specified non-trade current account transactions. It was also decided not to give any fresh authorisation to UCBs to function as Full Fledged Money Changers (FFMCs).
Installation of Automated Teller Machines (ATMs)
4.60 Sound scheduled and non-scheduled UCBs were permitted to set up select off-site/ on-site ATMs, subject to prescribed eligibility norms. Banks permitted to have ATMs can also issue ATM-cum-debit cards. Prior approval of the Reserve Bank for network connectivity and/or sharing of the ATMs was also dispensed with.
Conversion of Extension Counters into Full-Fledged Branches
4.61 Consequent to the regulatory coordination brought about by signing of MoU with some of the State Governments, it was decided that the Reserve Bank would consider permitting financially sound UCBs registered in States, which have signed MoU with the Reserve Bank and those registered under the Multi-State Cooperative Societies Act, 2002 to convert existing extension counters into full-fledged branches, subject to certain conditions.
Insurance Business
4.62 As announced in the Annual Policy Statement for the year 2007-08, UCBs registered in States that have entered into MoU with the Reserve Bank or those registered under Multi-State Co-operative Societies Act, 2002 were allowed to undertake insurance agency business as corporate agents without risk participation, subject to compliance with the following eligibility norms: (a) UCB should have a minimum net worth of Rs.10 crore; and (b) It should not have been classified as Grade III or IV. In case of UCBs registered in States which have not signed MoUs with the Reserve Bank, the existing norms continue.
Norms for maintaining NRE/NRO accounts
4.63 Banks registered in States that have entered into Memorandum of Understanding (MoU) with the Reserve Bank for supervisory and regulatory co-ordination and those registered under the Multi State Co-operative Societies Act, 2002 were permitted to open NRE account subject to compliance with the certain eligibility norms. In terms of extant instructions, UCBs are not permitted to accept NRO deposits. They were also required to close these accounts, within a given timeframe. It has now been decided that banks may maintain NRO accounts, arising from their re-designation such as upon the account holders becoming non-resident. Opening of fresh NRO accounts is not permitted. Further, no fresh credits, barring periodical credit of interest, are allowed in these accounts. However, these restrictions are not applicable to UCBs holding AD Category - I licence.
Guidelines on One-time Settlement (OTS) Scheme for SME Accounts
4.64 Guidelines for settlement of chronic NPAs in small and medium enterprises sector, were forwarded to the State Governments with a request to notify the scheme to the UCBs under their jurisdiction, keeping in view the legal position obtaining in the State Co-operative Societies Acts/ Rules of the respective States. Similar guidelines were also forwarded to Multi-State UCBs. These guidelines do not cover loans availed of/guaranteed by directors/ their relatives/ firms or companies in which directors are interested and cases of wilful defaults, frauds and malfeasance.
Grant of Loans for Acquisition of Kisan Vikas Patras
4.65 Grant of loans for investing in KVPs does not promote fresh savings. It rather channelises the existing savings in the form of bank deposits to small saving instruments and thereby defeat the very purpose of such schemes. Banks were, therefore, advised not to sanction loans for acquisition of/investing in small savings instruments, including KVPs.
Augmenting Capital of UCBs
4.66 Share capital and retained earnings constitute the owned funds of co-operative banks. Share capital can be withdrawn by members after the minimum lock-in period and does not have the permanence of equity. Co-operative banks are also not allowed to issue shares at a premium. In order to explore various options for raising regulatory capital, it was proposed to constitute a Working Group comprising representatives of the Reserve Bank, State Governments and the UCB sector to examine the issues involved and identify alternate instruments/avenues for augmenting the capital funds of urban co-operative banks (Box IV.2).
Bank and Branch Licensing
4.67 Consequent upon easing of the licensing norms in May 1993, more than 800 banking licenses were issued, up to June 2001. It was, however, observed that close to one third of these newly licensed UCBs became financially weak within a short period. There was, thus, a need to moderate the pace of growth of this sector. Accordingly, it was decided to stop further bank and branch licensing until a suitable framework for regulation and supervision was put in place for the existing large number of UCBs. As at the end of March 2007, out of 1, 813 banks, 925 were unit banks, which were functioning as Head Office-cum-Branch. In the States that have signed MoU with the Reserve Bank, it was decided to consider application for grant of branch licenses from eligible licensed banks, whose net worth was not less than Rs.10 crore and average networth per bank, including the proposed ones was not less than Rs.2 crore in ‘A’ and ‘B’ category centres and Rs.1 crore in ‘C’ and ‘D’ category centres. The eligibility of the banks is decided on the basis of their audited balance sheet for the financial year ended March 2007.
UCBs under Directions
4.68 Directions are issued to UCBs based on the framework of Graded Supervisory Action (GSA) or due to sudden developments like run on bank, among others. These include restriction on acceptance/withdrawal of deposits, restriction or ban on expansion of loans, incurring of expenditure other than minimum establishment expenses required for day to day running of the bank. The banks placed under directions are monitored and decision on removing restrictions depends upon the ability of banks to rectify its inadequacies. During 2006-07, 23 UCBs were placed under directions as against 7 UCBs during the previous year. The total number of UCBs placed under directions at end-March, 2007 was lower at 73, compared with that of 75 at end-March 2006 (Appendix Table IV.2).
UCBs under Liquidation
4.69 As at end-March 2007, 254 UCBs were under various stages of liquidation compared with 226 banks at end-March 2006 (Appendix Table IV.3). As a result of the consultative process adopted in States that have signed MoUs with the Reserve Bank, the process for liquidation has become smooth and quicker, as the decisions are based on the recommendations of the TAFCUBs. Earlier, the requisition for liquidation of a bank was protested by the bank, the sector and often resulted in delay in implementation of the requisition by the State Governments.
Off-site Surveillance
4.70 An off site surveillance (OSS) software has been developed for UCBs to facilitate the preparation and submission of all supervisory and regulatory (including OSS) returns to the Reserve Bank electronically. The returns are e-mailed by UCBs to the respective Regional Offices (ROs) of the Reserve Bank, which are automatically uploaded to the RO database, and the same are transmitted to Central Office server at night over INFINET. As part of efforts towards continuous supervision, data are subjected to analysis using business intelligence software. Analysis is done, inter alia, with the objective of tracking incipient indicators of stress faced by banks as also for identifying outlier banks, i.e., banks that do not fall within reasonable limits in respect of important parameters such as capital adequacy, quality of assets, liquidity, earnings, etc. The OSS
Box IV.2: Report of the Working Group on Issues Concerning Raising of Capital by UCBs
The urban cooperative banking sector has witnessed phenomenal growth during the last one and a half decades. Certain infirmities have, however, manifested in the sector resulting in erosion of public confidence and causing concern to the regulators as also to the well-functioning units in the sector. One of the factors significantly affecting the financial health of the urban co-operative banks (UCBs) was their inability to attract equity/quasi equity investments. At present, UCBs have limited avenues for raising such funds and even their share capital can be withdrawn. Against this backdrop, an announcement was made in the Annual Policy Statement for the year 2006-07 to constitute a Working Group to examine the issue of share capital of UCBs and identify alternate instruments / avenues for augmenting the capital funds of UCBs. Accordingly, a Working Group (Chairman: N.S. Vishwanathan) was constituted.
The major recommendations of the Group are as under:
• Where UCBs with low capital or negative net worth are able to identify potential investors, the monetary ceiling prescribed in the Acts on individual share holding comes in the way of shoring up the share capital through this route. In such cases, the State Governments be requested to exempt the UCBs from the existing monetary ceiling on individual shareholding either through a notification or through amendment to the Act, where necessary.
• To provide instruments and avenues for raising stable and long-term funds having equity or quasi equity characteristics:
i) UCBs may be permitted to issue unsecured, subordinated (to the claims of depositors), non-convertible, redeemable debentures/bonds, which can be subscribed to by those within their area of operations and outside. Funds raised through such instruments may be treated as Tier II capital, subject to the instruments conforming to certain prescribed features. These bonds could be transferable by endorsement and delivery.
ii) UCBs be allowed to issue special shares on specific terms and conditions. Banks can also be allowed to issue these shares at a premium, which could be approved by the respective RCS, in consultation with the Reserve Bank. The special shares will be non-voting, perpetual and transferable by endorsement and delivery. They would rank senior to only the ordinary shares and be treated as Tier I capital.
iii) The Reserve Bank may make an exception with regard to rating requirement to enable the commercial banks to invest in the special shares and Tier II bonds issued by UCBs within the ceiling prescribed for investment in unlisted securities. UCBs may also be permitted to invest in Tier II bonds of other UCBs. The Reserve Bank may prescribe an appropriate limit linked to the investing bank’s and recipient bank’s net owned funds.
iv) UCBs be allowed to issue redeemable cumulative preference shares on specific terms and conditions with the prior permission of the respective RCS, granted in consultation with the Reserve Bank. They may be treated as Tier II capital subject to conforming to certain prescribed features.
v) There is a need to amend the Multi-State Co-operative societies Act to remove the limit prescribed on raising of funds by way of non-convertible debentures/bonds.
Wherever such limits are prescribed in other State Acts, necessary amendments may be made.
vi) UCBs be permitted to raise deposits of over 15 year maturity and such deposits can be considered as Tier II capital, subject to their meeting certain conditions, which, inter alia, include that they shall be subordinate to other deposits and ineligible for DICGC cover.
vii) Where banks with negative net worth raise Tier II capital by way of bonds, preference shares and long maturity deposits, through conversion of existing deposits, the Reserve Bank may, as an exception to the general rule, treat these as part of regulatory capital even though Tier I capital is negative.
As retained earnings form the only source of owned funds, the Reserve Bank could suggest to the Government of India to defer the application of income tax on UCBs for a period of three years by which time the alternative instruments may also take concrete shape.
Since UCBs are brought under the regime of linking capital adequacy in terms of a ratio to risk assets, prescribing a share to loan ratio on a borrower-to-borrower basis may not be necessary and hence the extant instructions on share linking to loans may be dispensed with.
As for International Accounting Standard Board’s proposed standard requiring share capital of cooperatives to be treated as outside liabilities, the Working Group recommended that it may continue to be treated as equity and reckoned as Tier I capital for regulatory purposes in view of the restrictions placed on withdrawal of capital in the Co-operative Societies Acts and taking into account the empirical evidence of share capital of UCBs being by and large stable.
The Working Group has observed that a federated structure can be a lasting solution for the sector. However, it will not only require amendments to the Co-operative Societies Acts, but also entail changes to the supervisory and regulatory practices. The Group has, therefore, recommended that the entire issue of creating an appropriate legislative and supervisory framework for the purpose be separately examined taking into consideration the international experiences and systems.
4.71 Scheduled UCBs were advised to submit the structural liquidity statement and interest rate sensitivity statement through the ALM Module provided in the OSS software. The statement of structural liquidity is required to be prepared at fortnightly intervals beginning with the last reporting Friday of June 2007, i.e., June 22, 2007 and that of interest rate sensitivity on a monthly basis as on last reporting Friday of the month starting with the month of June 2007.
4.72 As there is greater convergence in the supervisory process between the commercial banks and UCBs, the rating model for UCBs was revised to align it with the revised rating model for commercial banks. The new rating models for Tier I and Tier II UCBs have been approved by the Board for Financial Supervision to be adopted with the inspection cycle beginning March 2008 (Box IV.3).
Operations and Financial Performance of Urban Co-operative Banks
A Profile of UCBs
4.73 The urban co-operative banking sector comprises a number of institutions which vary in terms of their size, nature of business and their geographic spread. Primary (Urban) co-operative banks (UCBs) account for about 4.4 per cent of deposits and 3.9 per cent of advances of the banking system, and have 7.1 million borrowers and over 50 million depositors.
4.74 The total number of Grade I and II banks increased consistently during the last three years, while those in Grade III and IV declined. The number of UCBs in Grade III and Grade IV declined to 563 (31 per cent of the total number of UCBs) at end-March 2007, from 677 (37 per cent of the total) at end-March 2006 (Tables IV.2 and IV.3). The improvement in the position of banks signified by an increase in the Grade I and II banks and a decline in Grade III and IV banks, was witnessed in most of the centres. The general improvement in the Grade I and II banks largely reflects the salubrious impact of the consultative process under TAFCUBs.
4.75 The improvement in public confidence in this sector is reflected in the rise in deposit base of the UCBs. The total deposits of UCBs increased by 6.1 per cent during 2006-07, on top of an increase of 8.6 per cent during 2005-06. Besides a few large banks, most of the UCBs are of small
Box IV.3: Revised CAMELS Rating Model for UCBs
At present, a supervisory rating model based on ‘CAMELS’ (similar to commercial banks) and a simplified rating model based on ‘CAEL’ are in vogue for scheduled and non-scheduled UCBs, respectively. A system of supervisory grading of UCBs into grades I to IV based on financial parameters, viz., CRAR, Net NPA, Net Profit and compliance with CRR/SLR is also in place for both scheduled and non-scheduled UCBs. While the supervisory ratings of UCBs are disclosed to the Board level functionaries only, the grades are advised to the banks concerned and the RCS (except in case of banks classified as Grade I, where grade is not advised to the bank/RCS).
In order to bring about supervisory and regulatory convergence between co-operative and commercial banks, without missing out on the governance structure and the level of MIS and risk management systems obtaining in the UCBs, the rating models for UCBs have been revised. The revised rating model for UCBs is on the lines of revised rating model for commercial banks with suitable adaptation in the parameters rated so as not to unduly raise the bar in respect of UCBs vis-à-vis commercial banks keeping in view their overall financial health, the level of MIS and risk management systems prevailing. These apart, the dissimilarities in the structure of management, the size of the regulated entities, the regulations presently applicable to them, the level of use of banking technology, among others, have also been taken into account while adapting the model. Suitable modifications have been made considering the fact that UCBs, as compared to commercial banks, have larger average gross and net NPAs, particularly hardcore NPAs and larger cost-income ratios.
Under the Management head, suitable adaptation has been made keeping in view the election on democratic principle and corporate governance aspects obtaining in the UCB sector. Suitable modifications have also been made under the head Management for UCBs working under Administrators, where the boards have been superceded. (A significant number of UCBs are functioning under Administrators, their boards having been superceded due to various reasons).
Keeping in view the existing twin-track regulatory regime, the revised CAMELS model, which is more akin to the revised model adopted for commercial banks, would be adopted for UCBs with deposits of Rs.100 crore and above and the revised simplified version thereof would be adopted for UCBs with deposits of less than Rs.100 crore. As against the present system of rating of UCBs in four scales under A to D, UCBs would be rated in ten scales under A+ to D, using both positive and negative connotations to the principal rating. For instance, A+, A, A-. All UCBs with deposits of Rs. 100 crore and above would be brought under ALM discipline. The revised rating model will be made applicable to UCBs from the inspection cycle beginning from the year April 2008, i.e., with reference to their financial position as on March 31, 2008 and the existing grading system would be dispensed with.
Table IV.2: Centre-wise Gradation of Urban Co-operative Banks |
Centre |
Grade I |
Grade II |
Grade III |
Grade IV |
Total |
|
|
2006 |
2007 |
2006 |
2007 |
2006 |
2007 |
2006 |
2007 |
2006 |
2007 |
1 |
2 |
3 |
4 |
5 |
6 |
7 |
8 |
9 |
10 |
11 |
Ahmedabad |
136 |
114 |
50 |
88 |
67 |
42 |
43 |
40 |
296 |
284 |
Bangalore |
90 |
99 |
76 |
92 |
85 |
55 |
46 |
42 |
297 |
288 |
Bhopal |
16 |
12 |
28 |
24 |
17 |
15 |
14 |
9 |
75 |
60 |
Bhubaneswar |
1 |
2 |
6 |
4 |
3 |
4 |
4 |
4 |
14 |
14 |
Chandigarh |
10 |
9 |
1 |
3 |
1 |
– |
4 |
4 |
16 |
16 |
Chennai |
54 |
69 |
32 |
34 |
39 |
22 |
7 |
6 |
132 |
131 |
Dehradun |
– |
4 |
– |
– |
– |
1 |
– |
2 |
– |
7 |
Guwahati |
6 |
6 |
4 |
6 |
4 |
4 |
4 |
1 |
18 |
17 |
Hyderabad |
48 |
65 |
43 |
33 |
18 |
7 |
15 |
11 |
124 |
116 |
Jaipur |
25 |
24 |
10 |
13 |
3 |
1 |
1 |
1 |
39 |
39 |
Jammu |
2 |
3 |
– |
– |
2 |
1 |
– |
– |
4 |
4 |
Kolkata |
30 |
31 |
11 |
10 |
3 |
1 |
7 |
9 |
51 |
51 |
Lucknow |
47 |
44 |
13 |
17 |
9 |
4 |
8 |
5 |
77 |
70 |
Mumbai |
173 |
117 |
128 |
178 |
84 |
76 |
71 |
80 |
456 |
451 |
Nagpur |
53 |
17 |
45 |
76 |
43 |
39 |
33 |
39 |
174 |
171 |
New Delhi |
12 |
12 |
1 |
1 |
– |
– |
2 |
2 |
15 |
15 |
Patna |
3 |
5 |
1 |
– |
1 |
– |
– |
– |
5 |
5 |
Raipur |
– |
5 |
– |
5 |
– |
– |
– |
4 |
– |
14 |
Thiruvananthapuram |
10 |
14 |
11 |
14 |
28 |
23 |
11 |
9 |
60 |
60 |
Total |
716 |
652 |
460 |
598 |
407 |
295 |
270 |
268 |
1,853 |
1,813 |
– : Nil. |
|
|
|
|
|
|
|
|
|
|
Note : As at end-March 2006, data for Bhopal include Raipur and data for Lucknow include Dehradun. |
to medium size (Table IV.4). As at end-March 2007, of the total 1,813 UCBs, 34.5 per cent of UCBs had deposits less than Rs.10 crore. However, they accounted for only 3.1 per cent of total deposits. At the other end of the spectrum, 77 banks with deposits of Rs.250 crore and above accounted for half of the total deposits. Of these, 15 banks with deposits Rs.1,000 crore and above accounted for 27.1 per cent of total deposits of UCBs at end-March 2007. In all, 95.8 per cent banks had a deposit base of less than Rs.250 crore and accounted for 50 per cent of deposits, while 4.2 per cent banks with a deposit base of Rs.250 crore and above accounted for remaining 50 per cent of the deposits of the UCB sector, reflecting highly skewed distribution of deposits across UCBs.
4.76 Fifty-three UCBs, which were accorded scheduled status constituted a sizeable section of the UCB sector in terms of their share in assets/ deposits/investments/loans and advances which was a little over 40 per cent. On the other hand, 1,760 non-scheduled UCBs accounted for the remaining share (Table IV.5).
Table IV.3: Summary of Grade-wise Position of UCBs |
End- |
No. of |
Grade I |
Grade II |
Grade III |
Grade IV |
Grade |
Grade |
Grade |
Grade |
March |
UCBs |
|
|
|
|
I+II |
III+IV |
(I+II) |
III+IV |
|
|
|
|
|
|
|
|
as a |
(as a |
|
|
|
|
|
|
|
|
percent |
percent |
|
|
|
|
|
|
|
|
to Total |
to Total) |
1 |
2 |
3 |
4 |
5 |
6 |
7 |
8 |
9 |
10 |
2005 |
1,872 |
807 |
340 |
497 |
228 |
1,147 |
725 |
61 |
39 |
2006 |
1,853 |
716 |
460 |
407 |
270 |
1,176 |
677 |
63 |
37 |
2007 |
1,813 |
652 |
598 |
295 |
268 |
1,250 |
563 |
67 |
31 |
|
(End-March 2007) |
Sr. No. |
Deposit Base
(Rs. crore) |
No. of UCBs |
Deposits |
|
|
No. |
Share in |
Amount |
Share in |
|
|
|
Total |
|
Total |
|
|
|
(per cent) |
(Rs. crore) |
(per cent) |
|
1 |
2 |
3 |
4 |
5 |
1. |
> 1,000 |
15 |
0.8 |
32,748 |
27.1 |
2. |
500 to < 1,000 |
17 |
0.9 |
11,897 |
9.8 |
3. |
250 to < 500 |
45 |
2.5 |
16,152 |
13.4 |
4. |
100 to < 250 |
143 |
7.9 |
22,042 |
18.1 |
5. |
50 to < 100 |
206 |
11.4 |
14,948 |
12.4 |
6. |
25 to < 50 |
315 |
17.4 |
11,283 |
9.3 |
7. |
10 to < 25 |
446 |
24.6 |
8,198 |
6.8 |
8. |
< 10 |
626 |
34.5 |
3,715 |
3.1 |
|
Total |
1,813 |
100.0 |
1,20,983 |
100.0 |
Operations, Financial Performance and Asset Quality of Urban Co-operative Banks
Operations of UCBs
4.77 The business operations of UCBs expanded at a much lower rate of 5.9 per cent during 2006-07, compared with a growth of 24.8 per cent by scheduled commercial banks (SCBs) during the same period (Table IV.6). As a result, the relative asset size of UCBs at end-March 2007 declined to around 4.0 per cent of assets of SCBs from the level of 5.0 per cent a year ago. The composition of the assets and liabilities of the UCBs remained broadly on the lines of the last year. Deposits, the main item on the liabilities side, accounted for nearly 75.7 per cent of total resources. Borrowings registered a sharp increase of 46.1 per cent while ‘other liabilities’ registered a modest rise (1.8 per cent) during 2006-07. Capital and reserves increased at a higher rate of 11.4 per cent and 3.6 per cent during 2006-07 compared with 8.3 per cent and 1.0 per cent, respectively, in the previous year Loans and advances and investments, the major constituents on the asset side, constituted 49.2 per cent and 29.6 per cent of the total assets, respectively. While deposits grew by 6.1 per cent during the year, loans and advances increased by 9.8 per cent and investments declined by 6.1 per cent during 2006-07.
Table IV.6: Liabilities and Assets of Urban |
Co-operative Banks |
(Amount in Rs. crore) |
Item |
|
As at |
Percentage |
|
|
end-March |
Variations |
|
|
2006 |
2007 P |
2006-07 |
1 |
|
2 |
3 |
4 |
Liabilities |
|
|
|
1. |
Capital |
3,488 |
3,884 |
11.4 |
|
|
(2.3) |
(2.4) |
|
2. |
Reserves |
10,485 |
10,867 |
3.6 |
|
|
(6.9) |
(6.8) |
|
3. |
Deposits |
1,14,060 |
1,20,983 |
6.1 |
|
|
(75.6) |
(75.7) |
|
4. |
Borrowings |
1,781 |
2,602 |
46.1 |
|
|
(1.2) |
(1.6) |
|
5. |
Other Liabilities |
21,140 |
21,515 |
1.8 |
|
|
(14.0) |
(13.5) |
|
|
|
|
|
|
Total Liabilities/Assets |
1,50,954 |
1,59,851 |
5.9 |
|
|
(100.0) |
(100.0) |
|
Assets |
|
|
|
1. Cash in Hand |
1,558 |
1,639 |
5.2 |
|
|
(1.0) |
(1.0) |
|
2. Balances with Banks |
9,037 |
9,806 |
8.5 |
|
|
(6.0) |
(6.1) |
|
3. |
Money at Call and Short Notice |
1,835 |
1,859 |
1.3 |
|
|
(1.2) |
(1. 2) |
|
4. Investments |
50,395 |
47,316 |
-6.1 |
|
|
(33.4) |
(29.6) |
|
5. Loans and Advances |
71,641 |
78,660 |
9.8 |
|
|
(47.5) |
(49.2) |
|
6. Other Assets |
16,488 |
20,571 |
24.8 |
|
|
(10.9) |
(12.9) |
|
P : Provisional.
Note : Figures in parenthesis are percentages to total liabilities/assets.
Source: Balance sheets of respective UCBs. |
Table IV.5: A Profile of UCBs |
(End-March 2007) |
(Amount in Rs. crore) |
Category |
No. of UCBs |
Assets |
Deposits |
Investments |
Loans and Advances |
1 |
2 |
3 |
4 |
5 |
6 |
1. |
All UCBs |
1,813 |
1,59,851 |
1,20,983 |
47,316 |
78,660 |
|
|
(100.0) |
(100.0) |
(100.0) |
(100.0) |
(100.0) |
2. |
Scheduled UCBs |
53 |
71,562 |
51,173 |
20,279 |
32,884 |
|
|
(2.9) |
(44.8) |
(42.3) |
(42.9) |
(41.8) |
3. |
Non-Scheduled |
1,760 |
88,290 |
69,810 |
27,037 |
45,776 |
|
|
(97.1) |
(55.2) |
(57.7) |
(57.1) |
(58.2) |
Note :
1. Figures in parentheses represent percentages to total of all UCBs.
2. Data are provisional. |
Priority Sector Lending
4.78 As against the stipulated target of 60.0 per cent of their total loans and advances to the priority sector and 25.0 per cent of priority sector lending towards weaker sections, UCBs extended 56.0 per cent of total credit to the priority sector and 25.9 per cent of total priority sector loans to the weaker section. Thus, although the UCBs fell short of meeting the priority sector target by a thin margin, they were able to meet the requirements for lending to the weaker sections. (Table IV.7).
4.79 SLR investments constituted bulk of investment (93.1 per cent) of UCBs as at end-
Table IV.7: Priority Sector and Weaker |
Section Advances by Urban Co-operative |
Banks - 2006-07 |
Segment |
Priority Sector |
Weaker Sections |
|
Amount |
Share in |
Amount |
Share in |
|
(Rs. crore) |
Total |
(Rs. crore) |
Total |
|
|
Advances |
|
Advances |
|
|
(Per cent) |
|
(Per cent) |
1 |
2 |
3 |
4 |
5 |
Agriculture and Allied |
|
|
|
|
Activities |
2,190 |
2.8 |
1,010 |
1.3 |
Cottage and Small |
|
|
|
|
Scale Industries |
12,125 |
15.4 |
1,397 |
1.8 |
Road and Water |
|
|
|
|
Transport Operators |
2,147 |
2.7 |
497 |
0.6 |
Private Retail Trade |
|
|
|
|
(Essential Commodities) |
2,034 |
2.6 |
761 |
1.0 |
Retail Trade (Others) |
4,699 |
6.0 |
1,069 |
1.3 |
Small Business |
|
|
|
|
Enterprises |
6,079 |
7.7 |
1,698 |
2.2 |
Professional and |
|
|
|
|
Self Employed |
2,685 |
3.4 |
927 |
1.2 |
Educational Loans |
628 |
0.8 |
232 |
0.3 |
Housing Loans |
10,247 |
13.0 |
3,092 |
3.9 |
Consumption Loans |
1,169 |
1.5 |
709 |
0.9 |
Software Industries |
55 |
0.1 |
7 |
0.0 |
Total |
44,058 |
56.0 |
11,399 |
14.5 |
Note : Data are provisional. |
Table IV.8: Investments by Urban |
Co-operative Banks |
(Amount in Rs. crore) |
Item |
As at |
Percentage |
|
end-March |
Variations |
|
2006 |
2007P |
2006-07 |
1 |
2 |
3 |
4 |
Total Investments (A+B) |
50,395 |
47,316 |
-6.1 |
|
(100.0) |
(100.0) |
|
A. SLR Investments (i to v) |
47,635 |
44,060 |
-7.5 |
|
|
(94.5) |
(93.1) |
|
i) |
Central Government |
28,178 |
28,158 |
-0.1 |
|
Securities |
(55.9) |
(59.5) |
|
ii) |
State Government |
3,902 |
3,534 |
-9.4 |
|
Securities |
(7.7) |
(7.5) |
|
iii) |
Other approved |
935 |
835 |
-10.7 |
|
securities |
(1.9) |
(1.8) |
|
iv) Term deposits with |
4,704 |
4,932 |
4.9 |
|
StCBs |
(9.3) |
(10.4) |
|
v) |
Term deposits with |
9,916 |
6,601 |
-33.4 |
|
DCCBs |
(19.7) |
(14.0) |
|
B. Non-SLR Investments |
2,760 |
3,256 |
18.0 |
(in bonds of public sector |
(5.5) |
(6.9) |
|
Institutions/AIFIs, shares |
|
|
|
of AIFIs and units of UTI) |
|
|
|
Note: Figures in parentheses are percentages to total investments. |
March 2007 (Table IV.8). While investments in Central Government securities remained more or less at the previous year’s level, investments in State Government securities and other approved securities declined sharply. All categories of investments declined during 2006-07, except term deposits with state co-operative banks and non-SLR investments.
Capital Adequacy
4.80 As at end-March 2007, 1,496 UCBs out of total 1,813 UCBs, had CRAR of 9 per cent and above (Table IV.9).
Table IV.9: CRAR-wise distribution of All UCBs |
|
(End-March 2007) |
|
|
(Amount in Rs. crore) |
Range of CRAR |
<3 |
3 to 6 |
6 to 9 |
>9 |
Grand |
(per cent) |
|
|
|
|
Total |
1 |
2 |
3 |
4 |
5 |
6 |
Non-Scheduled |
202 |
48 |
57 |
1,453 |
1,760 |
Scheduled |
7 |
0 |
3 |
43 |
53 |
All UCBs |
209 |
48 |
60 |
1,496 |
1,813 |
P : Provisional. |
|
|
|
|
|
Table IV.10: Gross Non-Performing Assets of |
Urban Co-operative Banks |
(Amount in Rs. crore) |
End- |
No. of |
Gross |
Gross |
Net |
Net |
March |
Repor- |
NPAs |
NPAs as |
NPAs |
NPAs as |
|
ting |
(Rs. |
percentage |
(Rs. |
percentage |
|
UCBs |
crore) |
of total |
crore) |
of total |
|
|
|
Advances |
|
Advances |
1 |
2 |
3 |
4 |
5 |
6 |
2004 |
1,926 |
15,406 |
22.7 |
8,242 |
2.1 |
2005 |
1,872 |
15,486 |
23.2 |
8,257 |
12.3 |
2006 |
1,853 |
13,506 |
18.9 |
6,335 |
8.8 |
2007P |
1,813 |
13,363 |
17.0 |
6,044 |
7.7 |
P: Provisional. |
Asset Quality
4.81 The asset quality of the UCBs improved during the year as reflected in the decline in NPAs (gross and net) in absolute as well as percentage terms. However, NPA ratios of UCBs at 17.0 per cent (gross) and 7.7 per cent (net) at end-March 2007 were high compared with 2.4 per cent (gross) and 1.0 per cent (net), for scheduled commercial banks (Table IV.10).
Operations and Performance of Scheduled Urban Co-operative Banks
4.82 Total assets of scheduled UCBs expanded at a slower rate of 10.6 per cent during 2006-07, compared with 15.1 per cent in the previous year (Table IV.11). Deposits of scheduled UCBs grew at a higher rate in comparison with the previous year. Borrowings by scheduled UCBs increased, although, their share in total liabilities remained below 2 per cent. On the asset side, while loans and advances increased at a higher rate as compared to the previous year, investments declined as against a sharp increase in the previous year (Table IV.11).
Financial Performance
4.83 During 200-07, income and expenditure of scheduled UCBs, increased by 5.5 per cent and 6.3 per cent, respectively. On the income side, while interest income increased by 6.5 per cent, non-interest income witnessed a modest decline during the year. On the expenditure side, while interest expended increased marginally during 2006-07, the non-interest expenses of the scheduled UCBs increased by 19.5 per cent during
Table IV.11: Liabilities and Assets of |
Scheduled Urban Co-operative Banks |
(Amount in Rs. crore) |
Item |
|
As at |
Percentage |
|
|
end-March |
Variation |
|
|
2006 |
2007P |
2006-07 |
1 |
|
2 |
3 |
4 |
Liabilities |
|
|
|
1. |
Capital |
899 |
1,018 |
13.2 |
|
|
(1.4) |
(1.4) |
|
2. |
Reserves |
5,439 |
5,918 |
8.8 |
|
|
(8.4) |
(8.3) |
|
3. |
Deposits |
45,297 |
51,173 |
13.0 |
|
|
(70.0) |
(71.5) |
|
4. |
Borrowings |
922 |
1,350 |
46.4 |
|
|
(1.4) |
(1.9) |
|
5. |
Other Liabilities |
12,145 |
12,103 |
-0.3 |
|
|
(18.8) |
(16.9) |
|
|
|
|
|
|
Total Liabilities/Assets |
64,702 |
71,562 |
10.6 |
|
|
(100.0) |
(100.0) |
|
Assets |
|
|
|
1. |
Cash in hand |
386 |
426 |
10.4 |
|
|
(0.6) |
(0.6) |
|
2. |
Balances with Banks |
4,227 |
4,700 |
11.2 |
|
|
(6.5) |
(6.6) |
|
3. |
Money at call and |
618 |
1,095 |
77.1 |
|
short notice |
(1.0) |
(1.5) |
|
4. |
Investments |
22,593 |
20,279 |
-10.2 |
|
|
(34.9) |
(28.3) |
|
5. |
Loans and Advances |
27,960 |
32,884 |
17.6 |
|
|
(43.2) |
(46.0) |
|
6. |
Other Assets |
8,918 |
12,178 |
36.6 |
|
|
(13.8) |
(17.0) |
|
P : Provisional.
Note : Figures in parentheses are percentages to total liabilities/assets.
Source: Balance sheet of respective UCBs. |
2006-07. Net interest income of scheduled UCBs increased to Rs.1,641 crore during 2006-07 as compared to Rs.1,396 crore during 2005-06 and Rs.1,094 crore during 2004-05 (Table IV.12).
4.84 During 2006-07, while operating profit increased by 2.2 per cent, net profit witnessed a decline by 14.0 per cent reflecting a strong growth in provisions, contingencies, taxes, etc.
Operations and Performance of Non-scheduled Urban Co-operative Banks
4.85 The consolidated balance sheet of non-scheduled UCBs expanded at a much lower rate of 2.4 per cent as compared with 10.6 per cent
Table IV.12: Financial Performance of Scheduled UCBs |
(Amount in Rs. crore) |
|
Percentage Variation |
|
2004-05 R |
2005-06 R |
2006-07 P |
2005-06 |
2006-07 |
1 |
2 |
3 |
4 |
5 |
6 |
A. |
Total Income (i+ii) |
4,182 |
4,499 |
4,748 |
7.6 |
5.5 |
|
|
|
(100.0) |
(100.0) |
(100.0) |
|
|
|
i. |
Interest Income |
3,675 |
3,912 |
4,166 |
6.4 |
6.5 |
|
|
|
(87.9) |
(87.0) |
(87.7) |
|
|
|
ii. |
Non- interest Income |
507 |
587 |
582 |
15.8 |
-0.9 |
|
|
|
(12.1) |
(13.0) |
(12.3) |
|
|
B. |
Total Expenditure (i+ii) |
3,560 |
3,653 |
3,883 |
2.6 |
6.3 |
|
|
|
(100.0) |
(100.0) |
(100.0) |
|
|
|
i. |
Interest Expenditure |
2,581 |
2,516 |
2,525 |
-2.5 |
0.4 |
|
|
|
(72.5) |
(68.9) |
(65.0) |
|
|
|
ii. |
Non-Interest Expenditure |
979 |
1,137 |
1,358 |
16.1 |
19.4 |
|
|
of which: |
(27.5) |
(31.1) |
(35.0) |
|
|
|
|
wage bill |
557 |
634 |
650 |
13.8 |
2.5 |
|
|
|
(15.6) |
(17.4) |
(16.7) |
|
|
C. |
Profit |
|
|
|
|
|
|
i. |
Amount of operating profit |
622 |
846 |
865 |
36.0 |
2.2 |
|
ii. |
Provisions, contingencies, taxes |
371 |
332 |
423 |
-10.5 |
27.4 |
|
iii. |
Amount of net profit |
251 |
514 |
442 |
104.8 |
-14.0 |
|
iv. |
Accumulated Loss (-)/Surplus carried over (+) |
-2,201 |
-2,032 |
-1,996 |
-7.7 |
-1.8 |
P: Provisional R: Revised
Note : Figures in brackets are percentages to respective totals.
Source : Balance sheet of respective UCBs. |
growth for scheduled UCBs during 2006-07 (Table IV.13). While deposits of non-scheduled UCBs increased at a moderate rate, borrowings showed a higher increase. On the assets side, the loans and advances of non-scheduled UCBs grew by 4.8 per cent, while their investments witnessed a decline.
Urban Co-operative Banks - Regional Operations
4.86 The spatial distribution of UCBs is highly skewed as they are concentrated mainly in five States/Union Territories, viz., Andhra Pradesh, Gujarat, Karnataka, Maharashtra and Tamil Nadu. As at end-March 2007, nearly 80 per cent of total UCBs with around 85 per cent of total branches operated in five States, viz., Andhra Pradesh, Gujarat, Karnataka, Maharashtra (including Goa) and Tamil Nadu (including Puducherry). Maharashtra (including Goa) alone accounted for around 53 per cent of total branches of UCBs. Of the 7,453 branches of UCBs at end-March 2007, 894 were unit banks, i.e., banks which function as head office-cum-branch. Maharashtra (including Goa), Gujarat and Karnataka had the highest number (60 per cent) of unit banks (Table IV.14).
4.87 Andhra Pradesh, Gujarat, Karnataka, Maharashtra and Tamil Nadu together accounted
Table IV.13: Liabilities and Assets of |
Non-Scheduled UCBs* |
(Amount in Rs. crore) |
Item |
|
As at |
Percentage |
|
|
end-March |
Variation |
|
|
2006 |
2007P |
2006-07 |
1 |
|
2 |
3 |
4 |
Liabilities |
|
|
|
1. |
Capital |
2,589 |
2,867 |
10.7 |
|
|
(3.0) |
(3.2) |
|
2. |
Reserves |
5,046 |
4,949 |
-1.9 |
|
|
(5.9) |
(5.6) |
|
3. |
Deposits |
68,763 |
69,810 |
1.5 |
|
|
(79.7) |
(79.1) |
|
4. |
Borrowings |
859 |
1,252 |
45.8 |
|
|
(1.0) |
(1.4) |
|
5. |
Other Liabilities |
8,994 |
9,412 |
4.6 |
|
|
(10.4) |
(10.7) |
|
Total Liabilities/Assets |
86,251 |
88,290 |
2.4 |
|
|
(100.0) |
(100.0) |
|
Assets |
|
|
|
1. |
Cash in Hand |
1,171 |
1,213 |
3.6 |
|
|
(1.4) |
(1.4) |
|
2. |
Balances with Banks |
4,810 |
5,106 |
6.2 |
|
|
(5.6) |
(5.8) |
|
3. |
Money at Call and Short Notice |
1,217 |
764 |
-37.2 |
|
|
(1.4) |
(0.9) |
|
4. |
Investments |
27,802 |
27,037 |
-2.8 |
|
|
(32.2) |
(30.6) |
|
5. |
Loans and Advances |
43,680 |
45,776 |
4.8 |
|
|
(50.6) |
(51.8) |
|
6. |
Other Assets |
7,571 |
8,394 |
10.9 |
|
|
(8.8) |
(9.5) |
|
* P : Provisional.
Note : Figures in parentheses are percentages to total liabilities/assets.
Source: Balance sheet of respective UCBs. |
Table IV.14: Distribution of Urban Co-operative Banks – State wise |
|
As on end-March 2007 |
As on end-March 2006R |
As on end-March 2005R |
State |
Number |
Unit |
Bran- |
Exten- |
Number |
Unit |
Bran- |
Exten- |
Number |
Unit |
Bran- |
Exten- |
|
of |
UCBs |
ches# |
sion |
of |
UCBs |
ches# |
sion |
of |
UCBs |
ches# |
sion |
|
UCBs |
|
|
Count- |
UCBs |
|
|
Coun- |
UCBs |
|
|
Coun- |
|
opera- ting |
|
|
ers |
opera- ting |
|
|
ter |
opera- ting |
|
|
ters |
1 |
2 |
3 |
4 |
5 |
6 |
7 |
8 |
9 |
10 |
11 |
12 |
13 |
Andhra Pradesh |
116 |
87 |
273 |
5 |
124 |
95 |
281 |
5 |
127 |
97 |
305 |
10 |
Asam/Manipur/ |
|
|
|
|
|
|
|
|
|
|
|
|
Meghalaya/Mijoram |
|
|
|
|
|
|
|
|
|
|
|
|
/Tripura |
17 |
13 |
28 |
|
18 |
14 |
29 |
|
18 |
14 |
29 |
|
Bihar/Jharkhand |
5 |
4 |
6 |
1 |
5 |
4 |
6 |
1 |
5 |
4 |
6 |
1 |
Chhattisgarh |
14 |
10 |
20 |
1 |
|
|
|
|
|
|
|
|
Gujarat |
284 |
151 |
924 |
4 |
296 |
163 |
966 |
7 |
308 |
175 |
990 |
3 |
Jammu & Kashmir |
4 |
1 |
16 |
4 |
4 |
1 |
16 |
4 |
4 |
1 |
16 |
4 |
Karnataka |
288 |
153 |
848 |
16 |
297 |
153 |
870 |
18 |
296 |
153 |
880 |
21 |
Kerala |
60 |
17 |
324 |
2 |
60 |
17 |
325 |
2 |
60 |
17 |
325 |
2 |
Madhya Pradesh* |
60 |
45 |
80 |
|
75 |
58 |
103 |
4 |
77 |
58 |
106 |
4 |
Maharshtra |
|
|
|
|
|
|
|
|
|
|
|
|
(including Goa) |
622 |
237 |
4010 |
138 |
630 |
240 |
4027 |
139 |
633 |
240 |
4020 |
139 |
New Delhi |
15 |
6 |
60 |
1 |
15 |
6 |
60 |
1 |
15 |
6 |
60 |
1 |
Orissa |
14 |
5 |
51 |
4 |
14 |
5 |
51 |
4 |
12 |
4 |
46 |
4 |
Punjab/Haryana/ |
|
|
|
|
|
|
|
|
|
|
|
|
Himachal Pradesh |
16 |
10 |
39 |
3 |
16 |
10 |
39 |
3 |
17 |
10 |
39 |
3 |
Rajasthan |
39 |
19 |
142 |
7 |
39 |
19 |
142 |
7 |
39 |
19 |
142 |
7 |
Tamil Nadu/ |
|
|
|
|
|
|
|
|
|
|
|
|
Pondicherry |
131 |
60 |
311 |
0 |
132 |
62 |
312 |
|
133 |
63 |
313 |
2 |
Uttar Pradesh** |
70 |
42 |
173 |
27 |
77 |
45 |
218 |
30 |
77 |
45 |
218 |
30 |
Uttarakhand |
7 |
3 |
45 |
2 |
|
|
|
|
|
|
|
|
West Bengal/Sikkim |
51 |
31 |
103 |
2 |
51 |
31 |
103 |
2 |
51 |
31 |
103 |
2 |
Total |
1813 |
894 |
7453 |
217 |
1853 |
923 |
7548 |
227 |
1872 |
937 |
7598 |
233 |
R : Revised.
* : includes Chhattisgarh for data at end-March 2006 and end-March 2005;
** : includes Uttarakhand for data at end-March 2006 and end-March 2005
# : including head office cum branch. |
for 88.2 per cent of the deposits and 89.8 per cent of the credit of the entire UCB sector at end-March 2007. Maharashtra alone accounted for 64.7 per cent of deposits and 66.2 per cent of total advances. As at end-March 2007, the number of districts with the presence of a UCB was the highest in Madhya Pradesh, followed by Uttar Pradesh and Maharashtra (Table IV.15).
4.88 At end-March 2007, the C-D ratio of scheduled UCBs at select centres showed large variations across centres. The C-D ratio was the highest in Ahmedabad (69.7 per cent) followed by Nagpur (67.6 per cent) and Mumbai (63.5 per cent). Mumbai accounted for largest share in deposits (81.1 per cent) (Table IV.16).
4.89 Non-scheduled UCBs in five centres, viz., Ahmedabad, Bangalore, Chennai, Mumbai and Nagpur accounted for more than three-fourths of capital and about four-fifth of reserves, deposits and advances of all non-scheduled UCBs at end-March 2007 (Table IV.17). Wide variations were observed in the C-D ratio of non-scheduled UCBs.
Table IV.15: State-wise Distribution of |
Urban Co-operative Banks |
(As at end-March 2007) |
State |
No. of |
Amount |
Total number of |
|
UCBs |
of Deposits |
districts with |
|
|
(Rs. crore) |
a presence of |
|
|
|
UCB branch |
1 |
2 |
3 |
4 |
1. |
Andhra Pradesh |
116 |
2,665 |
21 |
2. |
Assam |
9 |
208 |
1 |
3. |
Bihar |
3 |
26 |
2 |
4. |
Chhattisgarh |
14 |
233 |
7 |
5. |
Goa |
6 |
982 |
5 |
6. |
Gujarat |
284 |
14,660 |
25 |
7. |
Haryana |
7 |
192 |
7 |
8. |
Himachal Pradesh |
5 |
176 |
8 |
9. |
Jammu and Kashmir |
4 |
211 |
4 |
10. |
Jharkhand |
2 |
8 |
2 |
11. |
Karnataka |
288 |
8,277 |
25 |
12. |
Kerala |
60 |
2,878 |
14 |
13. |
Madhya Pradesh |
60 |
827 |
48 |
14. |
Maharashtra |
616 |
78,280 |
34 |
15. |
Manipur |
3 |
108 |
2 |
16. |
Meghalaya |
3 |
45 |
1 |
17. |
Mizoram |
1 |
17 |
1 |
18. |
New Delhi |
15 |
922 |
1 |
19. |
Orissa |
14 |
617 |
10 |
20. |
Puducherry |
1 |
79 |
1 |
21. |
Punjab |
4 |
382 |
6 |
22. |
Rajasthan |
39 |
1,624 |
24 |
23. |
Sikkim |
1 |
2 |
1 |
24. |
Tamil Nadu |
130 |
2,884 |
30 |
25. |
Tripura |
1 |
10 |
1 |
26. |
Uttar Pradesh |
70 |
1,998 |
37 |
27. |
Uttarakhand |
7 |
813 |
7 |
28. |
West Bengal |
50 |
1,859 |
11 |
|
Total |
1,813 |
1,20,983 |
336 |
The C-D ratio was the highest in Chennai (76.7 per cent), while it was the lowest in Raipur (30.1
Table IV.17: Centre-wise Select Indicators of |
Non-Scheduled Urban Co-operative Banks |
(As at end-March 2007) |
|
|
|
|
(Amount in Rs. crore) |
Centre |
Share |
Free |
Deposits |
Loans |
Demand |
C-D |
|
Capital |
Reserves |
|
and |
and |
Ratio |
|
|
|
|
Advances |
Time |
(per |
|
|
|
|
|
Liabilities |
cent) |
1 |
2 |
3 |
4 |
5 |
6 |
7 |
Ahmedabad |
329 |
1,768 |
9,512 |
5,572 |
10,348 |
58.6 |
Bangalore |
383 |
561 |
7,946 |
5,332 |
8,255 |
67.1 |
Bhopal |
41 |
31 |
827 |
455 |
962 |
55.0 |
Bhubaneswar |
32 |
31 |
617 |
419 |
633 |
68.0 |
Chandigarh |
33 |
63 |
750 |
426 |
767 |
56.8 |
Chennai |
154 |
137 |
2,963 |
2,273 |
412 |
76.7 |
Deharadun |
12 |
68 |
813 |
3,238 |
820 |
50.7 |
Guwahati |
14 |
30 |
388 |
187 |
422 |
48.2 |
Hyderabad |
106 |
166 |
1,955 |
1,144 |
2,731 |
58.5 |
Jaipur |
81 |
59 |
1,624 |
958 |
1,732 |
59.0 |
Jammu |
4 |
7 |
210 |
113 |
209 |
53.5 |
Kolkata |
131 |
190 |
1,861 |
1,211 |
2,094 |
65.0 |
Lucknow |
127 |
87 |
1,720 |
1,092 |
1,977 |
63.5 |
Mumbai |
1,019 |
1,026 |
27,870 |
19,251 |
30,591 |
69.1 |
Nagpur |
252 |
436 |
6,687 |
4,499 |
6,648 |
67.3 |
New Delhi |
44 |
147 |
922 |
421 |
989 |
45.6 |
Patna |
3 |
6 |
34 |
20 |
36 |
58.4 |
Raipur |
8 |
16 |
233 |
70 |
226 |
30.1 |
Thiruvanan- |
|
|
|
|
|
|
thapuram |
94 |
120 |
2,878 |
1,921 |
3,042 |
66.8 |
Total |
2,867 |
4,949 |
69,810 |
45,776 |
75,721 |
65.6 |
Memo Item: |
|
|
|
|
|
|
Share of Major |
|
|
|
|
|
Centres* |
74.5 |
79.4 |
78.8 |
80.7 |
78.0 |
|
* : Share of Ahmedabad, Bangalore, Chennai, Mumbai and Nagpur in total. |
per cent). The C-D ratio of non-scheduled UCBs was less than 50 per cent at three centres.
Table IV.16: Centre-wise Select Indicators of Scheduled Urban Co-operative Banks |
(As at end-March 2007) |
(Amount in Rs. crore) |
Centre |
No. |
Capital |
Reserves |
Deposits |
Loans and |
Demand |
C-D Ratio |
|
|
|
|
|
Advances |
and Time Liabilities |
(per cent) |
1 |
2 |
3 |
4 |
5 |
6 |
7 |
8 |
Ahmedabad |
8 |
109 |
2,829 |
5,148 |
3,590 |
6,233 |
69.7 |
Bangalore |
1 |
6 |
23 |
331 |
189 |
470 |
57.1 |
Hyderabad |
3 |
31 |
62 |
710 |
432 |
405 |
60.8 |
Lucknow |
1 |
6 |
12 |
278 |
149 |
304 |
53.6 |
Mumbai |
35 |
781 |
2,848 |
41,494 |
26,353 |
39,501 |
63.5 |
Nagpur |
5 |
85 |
144 |
3,212 |
2,171 |
3,000 |
67.6 |
Total |
53 |
1,018 |
5,918 |
51,173 |
32,884 |
49,913 |
64.3 |
C-D : Credit to Deposit. |
|
|
|
|
|
|
|
3. Rural Co-operatives
4.90 Rural credit co-operative institutions have wide outreach particularly among the rural and vulnerable segments of society. Recognising their role in purveying rural credit and deposit mobilisation, efforts have been made in recent years to restore operational viability and financial health of these institutions.
4.91 The functioning and performance of rural co-operative credit institutions continued to suffer from several weaknesses including high NPAs/poor recovery and accumulated losses. As on March 31, 2006, four out of 31 SCBs, 88 out of 366 DCCBs, 53,626 out of 1,05,735 PACS, eight out of 19 reporting SCARDBs and 194 out of 696 reporting PCARDBs incurred losses, which together amounted to Rs.1,601 crore (excluding PACS).
4.92 In view of the above, the Reserve Bank and NABARD continued to provide focussed attention to facilitate the growth and development of rural credit institutions. The supervisory measures initiated during 2006-07 are detailed below.
Regulation of Rural Co-operative Banks
4.93 The Fazilka District Central Co-operative Bank Ltd. and Ambala District Central Cooperative Bank Ltd. were granted banking licence during 2006-07. The total number of licensed StCBs and DCCBs as on March 31, 2007 was 14 and 75, respectively. As on date, two StCBs and nine DCCBs are under the Reserve Bank’s directions issued in terms of Section 35A of the Banking Regulation Act, 1949 (as Applicable to Co-operative Societies - AACS) prohibiting them from accepting fresh deposits, allowing withdrawal of deposits in excess of stipulated amount, granting loans and advances to certain categories of borrowers, etc. Directions imposed on three other DCCBs (Siva gangai DCCB, Vijyanagarm DCCB and Srikakulam DCCB) were withdrawn fully during 2006-07 (April to March). No licence/application for licence was cancelled/ rejected during the year. No StCB was granted scheduled status during the year for inclusion in the Second Schedule under Section 42 of the RBI Act. The total number of scheduled StCBs remains at 16. As on June 30, 2007, seven out of 31 StCBs and 127 out of 367 DCCBs did not comply with the provisions of Section 11 (1) of the Banking Regulation Act, 1949 (AACS). Similarly, six StCBs and 127 DCCBs did not comply with the provisions of Section 22(3) (a) of the Act ibid, implying that they were not in a position to pay their depositors in full as and when their claims accrued. Further, 14 StCBs and 333 DCCBs did not comply with Section 22(3)(b) of the Banking Regulation Act.
Collection of Cheques at Regular Collection Counters
4.94 The Reserve Bank and the Banking Ombudsmen have been receiving complaints that many bank branches were not accepting cheques at the counters and were compelling the customers to drop the cheques in the cheque-drop box. All StCBs/DCCBs were, therefore, advised that customers should not be compelled to drop the cheques in the drop box. While the cheque-drop box facility may be made available to the customers, the facility for acknowledgement of the cheques at the regular collection counters should also be available to the customers. Further, no branch should refuse to give an acknowledgement if the customer tenders the cheque at the counters. Wherever the cheque-drop box facility has been introduced, it is necessary that the customer is made aware of both the options available to him, i.e., dropping cheques in the drop-box or tendering them at the counters, so that he can take an informed decision in this regard. Banks have also been advised to invariably display on the cheque-drop box itself in English, Hindi and the concerned regional language of the State that ‘Customers can also tender the cheques at the counter and obtain acknowledgement on the pay-in-slips’.
Prohibition of Stapling of Note Packets
4.95 All StCBs/DCCBs were advised that they should do away with stapling of note packets and instead secure them with paper bands. Further, they were also advised to sort notes into re-issuables and non-issuables, and issue only clean notes to public. Soiled notes in unstapled condition may be tendered at the Reserve Bank in inward remittances through currency chests. They were also advised that they should stop writing of any kind on watermark window of bank notes.
Restrictions on Sanction of Loans for Investing in Small Savings
4.96 StCBs and DCCBs were advised that the sanction of loans for acquisition of small saving instruments, such as, Kisan Vikas Patra (KVP) was not in conformity with the objectives of small savings schemes. The basic objective of small savings schemes is to provide a secure avenue of savings for small savers and promote savings, as well as to inculcate the habit of thrift among the people. The grant of loans for acquiring/investing in KVPs does not promote fresh savings. It rather channelises the existing savings in the form of bank deposits to small savings instruments and thereby defeats the very purpose of such schemes. Therefore, all the StCBs/DCCBs were advised to ensure that no loans were sanctioned for acquisition of/investing in small savings instruments, including Kisan Vikas Patras.
Prohibition on Charging of various Interest and Other Charges
4.97 Consequent upon the announcement in the Annual Policy Statement for the year 2007-08, boards of all StCBs/DCCBs were advised to lay down appropriate internal principles and procedures so that usurious interest, including processing and other charges, are not levied by them on loans and advances. In laying down such principles and procedures in respect of small value loans, particularly, personal loans and such other loans of similar nature, banks are required to take into account, inter-alia, the following broad guidelines: (i) an appropriate prior-approval process for sanctioning such loans, which should take into account, among others, the cash flows of the prospective borrower; (ii) interest rates charged by banks, inter-alia, to incorporate risk premium, as considered reasonable and justified, having regard to the internal rating of the borrower and considering the question of risk, to take into account the presence or absence of security and the value thereof; (iii) the total cost to the borrower, including interest and all other charges levied on a loan, to be justifiable having regard to the total cost incurred by the bank in extending the loan, sought to be defrayed and the extent of return reasonably expected from the transaction; (iv) an appropriate ceiling on the interest, including processing and other charges to be levied on such loans, which may be suitably publicised.
Supervision of the Rural Co-operative Structure
4.98 NABARD undertakes inspection of RRBs, StCBs and DCCBs, besides conducting voluntary inspections of SCARDBs, Apex Weavers’ Cooperative Societies, State Co-operative Marketing Federations, in accordance with the powers vested under Section 35(6) of the Banking Regulation Act, 1949 (AACS). The objective of NABARD’s supervision is to assess the financial and operational soundness and managerial efficiency of co-operative banks (StCBs, DCCBs and SCARDBs) and RRBs as also to ensure that the affairs of these banks are conducted in conformity with the provisions of the relevant Acts/Rules, Regulations, Bye-laws, etc., so as to protect the interests of their depositors. It also suggests ways and means for strengthening the institutions to enable them to play a more efficient role in the dispensation of rural credit. Under the revised strategy, the inspection is sharply focussed on the core areas of the functioning of banks pertaining to capital adequacy, asset quality, management, earnings, liquidity, systems and compliance (CAMELSC).
4.99 The frequency of statutory/voluntary inspections by NABARD was increased from 2005-06. Accordingly, statutory inspections of all StCBs as well as of those DCCBs and RRBs, which were not complying with minimum capital requirements as required under the Banking Regulation Act, 1949 (AACS), and the RBI Act, 1934, respectively, are conducted on an annual basis. The statutory inspections of DCCBs and RRBs with positive networth as also the voluntary inspections of Apex Co-operative Societies/ Federations continue to be conducted once in two years. During the year, NABARD carried out statutory inspections of 416 co-operative banks (31 StCBs, 247 DCCBs and 57 RRBs) and voluntary inspections of 18 SCARDBs and two Apex co-operative societies.
4.100 The Board of Supervision [BoS] (for StCBs, DCCBs and RRBs) met thrice during the year. The issues deliberated by the BoS included (i) functioning of StCBs and SCARDBs based on inspection findings; (ii) functioning of cooperative credit institutions of Chhattisgarh, Himachal Pradesh and Uttar Pradesh and that of insolvent StCBs and DCCBs; (iii) need and extent of regulatory action required against StCBs and DCCBs in the context of MoUs executed by the State Governments under the Government of India revival package, based on Vaidyanathan Committee recommendations; (iv) review of frauds, misappropriation, embezzlements, defalcations, etc., in StCBs, DCCBs and RRBs; (v) review of financial position of RRBs sponsored by Bank of Maharashtra; (vi) compliance with Section 42 (6) (a) (i) & (ii) of RBI Act, 1934, by RRBs, their internal control system, status of amalgamation and review of inspection strategy; (vii) review of Section 11 non-compliant/recomplied banks; (viii) review of investment portfolio of banks; (ix) the ways and means for fast tract regulatory action; (x) the scope for refinement of supervisory processes, tools and instruments; (xi) status of implementation of the Reserve Bank guidelines on compounding of interest on agricultural advances; (xii) system of receipt and disposal of public complaints against the banks and strategies for redressal of their grievances; and (xiii) review of audit system for co-operative banks, norms of audit rating vis-à-vis supervisory rating.
4.101 As advised by the BoS, for greater sharing of information with the public, the balance sheets of co-operative banks are put on the website of NABARD with a suitable disclaimer. Co-operative banks have also been advised to display the abridged balance sheets in their branches. A separate Trigger Point mechanism for regulatory actions is being evolved for assessing the extent of improvement and compliance in the case of cooperative banks situated in States that have executed the MoU for implementation of reform package, based on the recommendations of the Vaidyanathan Committee for short-term cooperative credit structure.
Management of Co-operatives
4.102 The number of co-operatives where boards were under supersession remained high, even as the percentage of boards under supersession declined to 45.7 per cent at end-March 2006 from 48.3 per cent at end-March 2005. The number and proportion of boards under supersession at end-March 2006 declined for all segments of rural co-operative banking sector, except for DCCBs where it increased marginally (Table IV.18).
A Profile of Rural Co-operative Banks
4.103 Rural co-operative credit institutions (including primary agricultural credit societies) grew modestly by 4.2 per cent during 2005-06. As on March 31, 2006, these institutions together held Rs.3,38,927 crore of assets, Rs.1,53,516 crore of deposits and a loan portfolio of Rs.2,01,118 crore. Total assets held by them at end-March 2006 constituted 12.2 per cent of the total assets of scheduled commercial banks. However, their financial performance deteriorated from an already precarious position with their modest profit turning into overall loss during 2005-06. The number of loss making entities continued to far exceed the number of profit making entities. Institution-wise, while the upper-tier of the short-term and long-term structure made profit, the lower-tier (i.e., PACS and PCARDBs) made losses. The problem of high non-performing assets and low recovery performance aggravated during 2005-06 in respect of rural co-operative banks, especially the long-term structure. While the recovery performance of the lower-tier of the short-term structure (PACS) worsened, their asset quality improved (Table IV.19).
Table IV.18: Elected Boards under Supersession |
(As at end-March 2006) |
Particulars |
StCBs |
DCCBs |
SCARDBs |
PCARDBs |
Total |
|
1 |
2 |
3 |
4 |
5 |
6 |
|
|
|
|
|
|
|
(i) |
Total no. of Institutions |
31 |
366 |
20 |
696 |
1,113 |
|
|
|
|
|
|
|
(ii) |
No. of Institutions where Boards |
|
|
|
|
|
are under supersession |
12 |
160 |
7 |
330 |
509 |
Percentage of Boards under supersession |
|
|
|
|
|
[(ii) as percentage of (i)] |
38.7 |
43.7 |
35.0 |
47.4 |
45.7 |
Source : NABARD. |
Table IV.19: A Profile of Rural Co-operative Banks |
(At end-March 2006) |
(Amount in Rs. crore) |
Item |
Short-Term |
Long-Term |
Total |
|
StCBs |
DCCBs |
PACS |
SCARDBs |
PCARDBs |
|
1 |
2 |
3 |
4 |
5 |
6 |
7 |
A. |
No. of Co-operative Banks |
31 |
366* |
1,06,384 |
20 |
696** |
1,07,497 |
B. |
Balance Sheet Indicators^ |
|
|
|
|
|
|
|
i) |
Owned Fund (Capital+Reserves) |
10,545 |
23,450 |
9,292 |
3,352 |
3,380 |
50,019 |
|
ii) |
Deposits |
45,405 |
87,532 |
19,561 |
636 |
382 |
1,53,516 |
|
iii) |
Borrowings |
16,989 |
24,217 |
41,018 |
17,075 |
13,066 |
1,12,365 |
|
iv) |
Loans and Advances Issued |
48,260 |
73,583 |
42,920 |
2,907 |
2254 |
1,69,924 |
|
v) |
Loans and Advances Outstanding |
39,684 |
79,202 |
51,779 |
17,713 |
12,740 |
2,01,118 |
|
vi) |
Total Liabilities/Assets |
76,481 |
143,090 |
73,387+ |
24,604 |
21,365 |
3,38,927 |
|
|
|
|
|
|
|
|
|
C. |
Financial Performance^ |
|
|
|
|
|
|
|
i) |
Institutions in Profit |
|
|
|
|
|
|
|
|
a) No. |
27 |
278 |
44,321 |
11 |
331 |
44,968 |
|
|
b) Amount of Profit |
408 |
1,116 |
1,064 |
335 |
328 |
3,251 |
|
ii) |
Institutions in Loss |
|
|
|
|
|
|
|
|
a) No. |
4 |
88 |
53,050 |
8 |
194 |
53,344 |
|
|
b) Amount of Loss |
30 |
913 |
1,920 |
247 |
411 |
3,521 |
|
iii) |
Overall Profit/Loss (-) |
378 |
203 |
-856 |
88 |
-83 |
-271 |
|
iv) |
Accumulated Loss |
274 |
5,275 |
N.A. |
918 |
2,672 |
9,139 |
D. Non-performing Assets^ |
|
|
|
|
|
|
|
i) |
Amount |
6,360 |
15,712 |
15,476@ |
5,786 |
4,554 |
47,888 |
|
ii) |
As Percentage of Loans Outstanding |
16.0 |
19.8 |
30.4# |
32.7 |
35.4 |
23.8 |
|
iii) |
Recovery of Loans to Demand (%) |
87 |
69 |
62.1 |
47 |
48 |
|
N.A. Not available.
* : Taran Taran DCCB IN Punjab excluded as the scheme of bifurcation was not approved by the Reserve Bank.
** : Number reduced due to recognition of 48 PCARDBs in Haryana to 19 District PCARDBs and two PCARDBs in Orissa.
+ : Working Capital.
@ : Total Overdues.
^ : Figures based on reporting co-operative banks and may not tally with the appendix tables.
# : Percentage of Overdues to Demand.
Source : NABARD and NAFSCOB. |
Rural Co-operative Banks – Short-Term Structure
State Co-operative Banks
4.104 The composition of the liabilities of the State Co-operative Banks (StCBs) in terms of major constituents (viz., capital, reserves, deposits, borrowings and other liabilities) remained broadly unaltered between end-March 2005 and end-March 2006 (Table IV.20). Deposits remained the mainstay of their resources, though the share of deposits in total liabilities declined somewhat. Growth of borrowings continued to be high, reflecting their dependence on outside sources for expansion. On the assets side, investments grew sharply while loans and advances increased by around 6 per cent.
Financial Performance
4.105 While operating profits of StCBs declined by 8.3 per cent during 2005-06, their net profits increased significantly by 32.3 per cent mainly on account of a substantial decline in provisioning (Table IV.21). Out of 31 reporting StCBs, 27 earned profits aggregating Rs.408 crore, while 4 made losses amounting to Rs.30 crore. Interest income contributed almost 94 per cent of total income of StCBs as they had very limited sources of non-interest income. On the other hand, their operating expenses continued to rise.
Asset Quality and Recovery Performance
4.106 The overall NPAs of StCBs increased, both in absolute and percentage terms during 2005-06, in contrast to a decline witnessed during the previous year. Substantial asset slippage continued during the year with a decline in the sub-standard assets and an increase in doubtful and loss assets. Recovery performance also remained more or less at the previous year’s level. In line with earlier years, StCBs were able to meet the provisioning requirements comfortably during 2005-06 (Table IV.22).
Table IV.20: Liabilities and Assets of |
State Co-operative Banks |
(Amount in Rs. crore) |
Item |
As at |
Percentage |
|
end-March |
Variations |
|
2004-05 |
2005-06 |
2004-05 |
2005-06 |
1 |
2 |
3 |
4 |
5 |
Liabilities |
|
|
|
|
1. Capital |
1,012 |
1,114 |
6.5 |
10.1 |
|
(1.4) |
(1.5) |
|
|
2. Reserves |
8,488 |
9,431 |
12.8 |
11.1 |
|
(11.8) |
(12.3) |
|
|
3. Deposits |
44,335 |
45,405 |
2.0 |
2.4 |
|
(61.7) |
(59.4) |
|
|
4. Borrowings |
14,602 |
16,989 |
17.2 |
16.3 |
|
(20.3) |
(22.2) |
|
|
5. Other Liabilities |
3,388 |
3,542 |
-1.0 |
4.5 |
|
(4.8) |
(4.6) |
|
|
Total Liabilities/Assets |
71,825 |
76,481 |
5.9 |
6.5 |
|
(100.0) |
(100.0) |
|
|
Assets |
|
|
|
|
1. Cash and Bank balance |
6,600 |
4,323 |
10.3 |
-34.5 |
|
(9.2) |
(5.7) |
|
|
2. Investments |
23,303 |
27,694 |
5.0 |
18.8 |
|
(32.4) |
(36.2) |
|
|
3. Loans and Advances |
37,353 |
39,684 |
6.4 |
6.2 |
|
(52.0) |
(51.9) |
|
|
4. Other Assets |
4,569 |
4,781 |
0.2 |
4.6 |
|
(6.4) |
(6.2) |
|
|
Note :
1. Figures in parentheses are percentages to total
liabilities/assets.
2. ‘Reserves’ include credit balance in profit and loss
account shown separately by some of the banks.
3. Data for StCBs in the States of Manipur and Kerala is repeated for the year 2005-06 from previous year.
Source : NABARD. |
Regional Dimensions
4.107 The recovery performance of StCBs as a proportion of demand at the all-India level increased to 87 per cent in 2005-06 from 86 per cent in 2004-05. Among the various States/Union Territories, the recovery performance improved in Andaman and Nicobar, Arunachal Pradesh,
Table IV.21: Financial Performance of State |
Co-operative Banks |
(Amount in Rs. crore) |
Item |
2004-05 |
2005-06 |
Percentage Variations |
|
|
|
2004-05 |
2005-06 |
1 |
2 |
3 |
4 |
5 |
A. Income (i+ii) |
5,772 |
5,656 |
-4.5 |
-2.0 |
|
|
(100.0) |
(100.0) |
|
|
i) |
Interest Income |
5,382 |
5,320 |
1.3 |
-1.2 |
|
|
(93.2) |
(94.1) |
|
|
ii) |
Other Income |
390 |
336 |
-46.7 |
-13.8 |
|
|
(6.8) |
(5.9) |
|
|
B. Expenditure (i+ii+iii) |
5,486 |
5,278 |
-3.3 |
-3.8 |
|
|
(100.0) |
(100.0) |
|
|
i) |
Interest Expended |
3,701 |
3,658 |
-7.4 |
-1.2 |
|
|
(67.5) |
(69.3) |
|
|
ii) |
Provisions and |
1,259 |
1,039 |
4.6 |
-17.5 |
|
Contingencies |
(22.9) |
(19.7) |
|
|
iii) |
Operating Expenses |
526 |
581 |
11.6 |
10.5 |
|
|
(9.6) |
(11.0) |
|
|
of which : Wage Bill |
369 |
381 |
16.5 |
3.3 |
|
|
(6.7) |
(7.2) |
|
|
C. Profit |
|
|
|
|
i) |
Operating Profit |
1,545 |
1,417 |
-2.0 |
-8.3 |
ii) |
Net Profit |
286 |
378 |
-23.6 |
32.2 |
D. Total Assets |
71,825 |
76,481 |
5.9 |
6.5 |
Note :
1. Figures in parentheses are percentages to the respective total.
2. Data for StCBs in the States of Manipur and Kerala repeated for the year 2005-06 from previous year.
3. Data are provisional.
Source : NABARD. |
Assam, Chhattisgarh, Chandigarh, Goa, Mizoram, and Puducherry, while it declined in Maharashtra, Manipur and West Bengal. StCBs in States/Union Territories of Andaman and Nicobar, Haryana, Karnataka, Kerala, Madhya Pradesh, Punjab, Rajasthan, Uttarakhand and Tamil Nadu achieved more than 90 per cent recovery during 2005-06.
4.108 Twenty seven StCBs earned profits, while four StCBs made losses. Twenty one StCBs earned higher profits during 2005-06, while five StCBs (in the States of Jammu and Kashmir, Punjab, Bihar, Maharashtra and Puducherry) earned lower profits. While StCB in Kerala maintained the profit at previous year’s level, StCBs in Arunachal Pradesh, Nagaland, Tripura and Chhattisgarh incurred losses during the year (Appendix Table IV.6).
4.109 NPAs of StCBs varied widely across the States at end-March 2006. In some States such
Table IV.22: Asset Quality of State |
Co-operative Banks |
(Amount in Rs. crore) |
Item |
As at |
Percentage |
|
end-March |
Variations |
|
2005 |
2006 |
2004-05 |
2005-06 |
1 |
2 |
3 |
4 |
5 |
A. |
Asset Classification |
6,073 |
6,360 |
-5.2 |
4.7 |
|
Total NPAs (i+ii+iii) |
(100.0) |
(100.0) |
|
|
|
i) |
Sub-Standard |
2,962 |
2,498 |
-7.8 |
-15.7 |
|
|
|
(48.8) |
(39.3) |
|
|
|
ii) |
Doubtful |
1,975 |
2,234 |
-33.4 |
13.1 |
|
|
|
(32.5) |
(35.1) |
|
|
|
iii) |
Loss Assets |
1,136 |
1,628 |
402.7 |
43.3 |
|
|
|
(18.7) |
(25.6) |
|
|
B. NPAs to Loans Ratio |
16.3 |
16.0 |
|
|
|
Memo Item: |
|
|
|
|
|
i) |
Recovery to Demand |
|
|
|
|
|
|
(in per cent) |
86 |
87 |
|
|
|
ii) |
Provisions Required |
|
|
|
|
|
|
(Rs. crore) |
2,806 |
3,314 |
-18.3 |
18.1 |
|
iii) |
Provisions Made |
|
|
|
|
|
|
(Rs. crore) |
2,982 |
3,558 |
-19.3 |
19.3 |
Note : Figures in parentheses represent percentages to total.
Source : NABARD. |
as Haryana, Rajasthan and Punjab, NPAs were less than 3.0 per cent, while in some other States (Arunachal Pradesh, Assam and Nagaland) NPAs were more than 50 per cent. Only in nine out of 31 States/UTs, the NPA ratio was less than 10 per cent. The recovery rate of StCBs also varied significantly across the States. StCBs operating in Haryana, Punjab, Rajasthan, Andaman and Nicobar Island, Madhya Pradesh, Uttarakhand, Karnataka, Kerala, and Tamil Nadu, achieved more than 90 per cent recovery during 2005-06. However, in several States such as Jammu and Kashmir, Assam, Manipur, Meghalaya and Tripura, the recovery rate was less than 50 per cent (Appendix Table IV.6).
District Central Co-operative Banks
4.110 The business operations of district central co-operative banks (DCCBs) registered a healthy growth during 2005-06. On the liability side, the share of deposits declined marginally to 61.2 per cent even as it continued to be the major source of funding. Retained earnings increased sharply during the year. On the asset side, while loans and advances increased by 8.3 per cent, and investments witnessed a modest growth (1.9 per cent) (Table IV.23).
Table IV.23: Liabilities and Assets of District |
Central Co-operative Banks |
(Amount in Rs. crore) |
Item |
As at |
Percentage |
|
end-March |
Variations |
|
2005 |
2006 |
2004-05 |
2005-06 |
1 |
2 |
3 |
4 |
5 |
Liabilities |
|
|
|
|
1. Capital |
4,342 |
4,748 |
11.4 |
9.3 |
|
|
(3.3) |
(3.3) |
|
2. Reserves |
16,156 |
18,702 |
6.1 |
15.8 |
|
|
(12.1) |
(13.1) |
|
3. Deposits |
82,129 |
87,532 |
3.8 |
6.6 |
|
|
(61.6) |
(61.2) |
|
4. Borrowings |
22,575 |
24,217 |
11.4 |
7.3 |
|
|
(16.9) |
(16.9) |
|
5. Other Liabilities |
8,174 |
7,891 |
14.4 |
-3.5 |
|
|
(6.1) |
(5.5) |
|
Total Liabilities/Assets |
1,33,377 |
1,43,090 |
6.1 |
7.3 |
|
(100.0) |
(100.0) |
|
|
Assets |
|
|
|
|
1. Cash and Bank balance |
8,567 |
10,695 |
11.4 |
24.8 |
|
|
(6.4) |
(7.5) |
|
2. Investments |
35,937 |
36,628 |
2.2 |
1.9 |
|
|
(26.9) |
(25.6) |
|
3. Loans and Advances |
73,125 |
79,202 |
8.9 |
8.3 |
|
|
(54.8) |
(55.4) |
|
4. Other Assets |
15,748 |
16,565 |
0.5 |
5.2 |
|
|
(11.8) |
(11.6) |
|
Note :
1. Figures in parentheses are percentages to total.
2. ‘Reserves’ include credit balance in profit and loss account shown separately by some of the banks.
3. Data are provisional.
Source : NABARD. |
Financial Performance
4.111 Despite expansion in balance sheet of DCCBs, both their income and expenditure declined during 2005-06. However, decline in income was sharper than the decline in expenditure, resulting in a sharp decline in operating and net profits. Interest income accounted for nearly 90 per cent of the total income, while interest expenditure accounted for nearly two-thirds of total expenditure. As observed for StCBs, the non-interest income of DCCBs also declined. Provisions and contingencies made by DCCBs, however, increased. During 2005-06, out of 366 reporting DCCBs, 278 made profits amounting to Rs.1,116 crore, while 88 DCCBs made losses to the tune of Rs.913 crore (Table IV.24).
Table IV.24: Financial Performance of District |
Central Co-operative Banks |
(Amount in Rs. crore) |
Item |
2004-05 |
2005-06 |
Percentage Variations |
|
|
|
2004-05 |
2005-06 |
1 |
2 |
3 |
4 |
5 |
A. |
Income (i+ii) |
12,731 |
11,688 |
6.9 |
-8.2 |
|
|
(100.0) |
(100.0) |
|
|
|
i) |
Interest Income |
11,420 |
10,687 |
3.6 |
-6.4 |
|
|
(89.7) |
(91.4) |
|
|
|
ii) |
Other Income |
1,310 |
1,000 |
47.6 |
-23.7 |
|
|
(10.3) |
(8.6) |
|
|
B. |
Expenditure |
11,759 |
11,481 |
-0.4 |
-2.4 |
|
(i+ii+iii) |
(100.0) |
(100.0) |
|
|
|
i) |
Interest Expended |
7,405 |
6,577 |
1.2 |
-11.2 |
|
|
(63.0) |
(57.3) |
|
|
|
ii) |
Provisions and |
2,125 |
2,563 |
-12.0 |
20.6 |
|
|
Contingencies |
(18.1) |
(22.3) |
|
|
|
iii) |
Operating Expenses |
2,230 |
2,341 |
7.7 |
5.0 |
|
|
(19.0) |
(20.4) |
|
|
|
of which : Wage Bill |
1,607 |
1,648 |
5.3 |
2.6 |
|
|
(13.7) |
(14.4) |
|
|
C. |
Profit |
|
|
|
|
|
i) |
Operating Profit |
3,096 |
2,769 |
22.8 |
-10.6 |
|
ii) |
Net Profit |
971 |
207 |
799.3 |
-78.7 |
D. |
|
Total Assets |
1,33,377 |
1,43,090 |
6.1 |
7.3 |
Note :
1. Figures in parentheses are percentage to the respective total.
2. ‘Reserves’ include credit balance in profit and loss
account shown separately by some of the banks.
3. Data are provisional.
Source : NABARD. |
Asset Quality and Recovery Performance
4.112 The NPAs ratio of DCCBs remained more or less unchanged during 2005-06. However, substantial asset slippage was also observed across all categories of assets. Recovery performance declined during the year. Provisions made declined during the year as against a sharp increase during the previous year (Table IV.25).
Regional Dimensions
4.113 During 2005-06, out of 366 reporting DCCBs, 278 made profits amounting to Rs.1,116 crore, while 88 DCCBs made losses to the tune of Rs.913 crore. DCCBs operating in 14 out of
19 States made profits, while DCCBs in five States (Jammu and Kashmir, Uttar Pradesh, Maharashtra, Andhra Pradesh and Tamil Nadu) made losses. Number of profit-earning DCCBs during 2005-06 increased in Rajasthan, Bihar,
Table IV.25: Asset Quality of District Central |
Co-operative Banks |
(Amount in Rs. crore) |
Item |
As at |
Percentage |
|
end-March |
Variations |
|
2005 |
2006 |
2004-05 |
2005-06 |
1 |
2 |
3 |
4 |
5 |
A. |
Asset Classification |
14,520 |
15,712 |
-10.1 |
8.2 |
|
Total NPAs (i+ii+iii) |
(100.0) |
(100.0) |
|
|
|
i) |
Sub-Standard |
6,468 |
6,905 |
-23.3 |
6.8 |
|
|
|
(44.5) |
(43.9) |
|
|
|
ii) |
Doubtful |
6,053 |
6,699 |
-0.2 |
10.7 |
|
|
|
(41.7) |
(42.6) |
|
|
|
iii) |
Loss Assets |
1,999 |
2,109 |
21.3 |
5.5 |
|
|
|
(13.8) |
(13.4) |
|
|
B. NPAs to Loans Ratio |
19.9 |
19.8 |
|
|
Memo Item: |
|
|
|
|
i) |
Recovery to Demand |
72 |
69 |
|
|
ii) |
Provisions Required |
8,678 |
8,713 |
37.8 |
0.4 |
iii) |
Provisions Made |
11,387 |
9,440 |
65.0 |
-17.1 |
Note : Figures in parentheses represent percentages to total.
Source : NABARD. |
Madhya Pradesh, Uttarakhand, Maharashtra, Karnataka and Kerala. In the case of Maharashtra, while the number of profit-making DCCBs increased, the amount of profits earned declined. The number of loss making DCCBs as well as overall losses incurred by them increased in seven States (Haryana, Jharkhand, West Bengal, Uttar Pradesh, Gujarat, Andhra Pradesh and Tamil Nadu) (Table IV.26 and Appendix Table IV.7).
4.114 The NPAs ratio in respect of DCCBs varied significantly across the States from 5.2 per cent to 68.7 per cent at end-March 2006. Only in three States (Haryana, Himachal Pradesh and Punjab), the NPAs ratio was less than 10 per cent, while the NPAs ratio was higher than 50 per cent in Jharkhand (68.7 per cent) and Bihar (57.6 per cent). However, NPAs in three States, Rajasthan, West Bengal and Andhra Pradesh, which traditionally had low NPAs (less than 20 per cent), increased during the year. NPAs in some other States such as Jammu and Kashmir, Bihar, Orissa, Chhattisgarh, Madhya Pradesh, Maharashtra and Karnataka which already had high NPA levels (greater than 20 per cent), increased during the year. The sharpest decline (10.4 per cent) in NPA ratio was observed in Jharkhand and the highest increase (12.7 per
Table IV.26: Region-wise Profit/Loss Making District Central Co-operative Banks |
(As on March ) |
|
2004-05 |
2005-06 |
|
Profit |
Loss |
Profit |
Loss |
State |
No. |
Amount |
No. |
Amount |
No. |
Amount |
No. |
Amount |
1 |
2 |
3 |
4 |
5 |
6 |
7 |
8 |
9 |
Northern Region |
66 |
262.89 |
4 |
11.48 |
64 |
213.64 |
5 |
15.4 |
Eastern Region |
54 |
123.6 |
10 |
16.23 |
52 |
92.72 |
12 |
28.0 |
Central Region |
70 |
121.03 |
34 |
155.78 |
74 |
159.19 |
30 |
174.0 |
Western Region |
35 |
295.39 |
14 |
169.49 |
34 |
244.23 |
15 |
245.8 |
Southern Region |
70 |
552.42 |
10 |
85.9 |
54 |
406.6 |
26 |
450.0 |
All India |
295 |
1355.33 |
72 |
438.88 |
278 |
1116.38 |
88 |
913.2 |
Note : Data for 2005-06 are provisional and based on the reporting banks.
Source : NABARD. |
cent) was observed in Karnataka. At the all-India level, the recovery performance of DCCBs worsened from 72.2 per cent to 69.2 per cent during 2005-06. The recovery by DCCBs generally worsened in all States, except Himachal Pradesh, Jammu and Kashmir, Punjab, Bihar, West Bengal, Chhattisgarh, Uttar Pradesh, Uttarakhand, Andhra Pradesh and Karnataka. In some States such as Haryana, Punjab, Rajasthan, Uttarakhand, Kerala and Tamil Nadu, the recovery rate was more than 80 per cent during 2005-06 (Appendix Table IV.7).
Primary Agricultural Credit Societies (PACS)
4.115 Primary agricultural credit societies (PACS), the grassroot level tier of short-term cooperative credit structure, deal directly with individual borrowers, grant short and medium-term loans and also undertake distribution and marketing functions. A large number of PACS, however, face severe financial problems primarily due to significant erosion of own funds, deposits, and low recovery rates. Various policies have been adopted to improve the financial health of the PACS. NABARD has been extending support to develop the infrastructure in PACS out of Cooperative Development Fund (CDF). Total number of PACS declined to 106,384 in 2005-06 from 108,779 in the previous year. The membership of PACS also declined by 3.8 per cent to 123 million. However, the number of borrowing members increased to 46 million, constituting 37.6 per cent of the total membership as compared with 35.4 per cent in the previous year (Table IV.27).
Operations
4.116 While total resources of PACS increased during 2005-06 on the back of modest growth in deposits, the working capital of PACS declined marginally by 2.7 per cent. On the asset side, the loan portfolio expanded by around 10 per cent due entirely to growth of short-term loans. This partly reflected an increase in the total number of borrowing members. Total loans outstanding, however, witnessed a slower growth on account of higher repayments (Table IV.28).
Financial Performance
4.117 During 2005-06, the number of both profit and loss making PACS declined. The total profits
Table IV.27: Primary Agricultural Credit |
Societies - Membership |
(Amount in Rs. crore) |
Item |
As at end-March |
|
2005 |
2006 |
1 |
2 |
3 |
1. No. of Societies |
108,779 |
106,384 |
2. Total Membership (in million) |
127.41 |
122.56 |
of which: |
|
|
a) |
SC |
30.93 |
30.58 |
b) |
ST |
11.80 |
11.66 |
3. Total No. of Borrowers (in million) |
45.07 |
46.08 |
of which: |
|
|
a) |
SC |
7.25 |
6.98 |
b) |
ST |
3.46 |
3.33 |
4. Total No. of Employees |
388,118 |
241,609 |
Note : Data are provisional.
Source : NAFSCOB. |
Table IV.28: Primary Agricultural Credit |
Societies – Select Indicators |
(Amount in Rs. crore) |
Item |
As at end- |
Percentage |
|
March |
Variations |
|
2005 |
2006 |
2004 |
2005 |
|
|
|
-05 |
-06 |
1 |
2 |
3 |
4 |
5 |
A. Liabilities |
|
|
|
|
1. |
Total Resources |
|
|
|
|
|
(2+3+4) |
68,423 |
69,871 |
12.5 |
2.1 |
2. |
Owned Funds (a+b) |
9,197 |
9,292 |
9.5 |
1.0 |
|
a. Paid-up Capital |
5,571 |
5,644 |
7.8 |
1.3 |
|
of which: |
|
|
|
|
|
Government |
|
|
|
|
|
Contribution |
621 |
622 |
-1.4 |
0.2 |
|
b. Total Reserves |
3,626 |
3,648 |
12.2 |
0.6 |
3. |
Deposits |
18,976 |
19,561 |
4.6 |
3.1 |
4. |
Borrowings |
40,250 |
41,018 |
17.5 |
1.9 |
5. |
Working Capital |
75,407 |
73,387 |
21.5 |
-2.7 |
B. Assets |
|
|
|
|
1. |
Total Loans Issued |
|
|
|
|
|
(a+b)* |
39,212 |
42,920 |
11.7 |
9.5 |
|
a) Short-Term |
31,887 |
35,624 |
8.7 |
11.7 |
|
b) Medium-Term |
7,325 |
7,296 |
26.4 |
-0.4 |
2. |
Total Loans |
|
|
|
|
|
Outstanding (a+b)
+ |
48,785 |
51,779 |
11.2 |
6.1 |
|
a) Short-Term |
32,481 |
34,140 |
5.4 |
5.1 |
|
b) Medium-Term |
16,304 |
17,639 |
24.8 |
8.2 |
C. Overdues |
|
|
|
|
1. |
Total Demand |
47,785 |
50,979 |
8 |
6.7 |
2. |
Total Collection |
31,733 |
35,503 |
13.6 |
11.9 |
3. |
Total Balance |
|
|
|
|
|
(Overdues) (a+b) |
16,052 |
15,476 |
-1.5 |
-3.6 |
|
a) Short-Term |
11,656 |
11,387 |
-5.1 |
-2.3 |
|
b) Medium-Term |
4,396 |
4,089 |
12.2 |
-7.0 |
4. |
Percentages of Overdues |
|
|
|
|
|
to Total Demand |
33.6 |
30.4 |
|
|
* : During the year. +
: As at the beginning of the year.
Note : Data are provisional.
Source : NAFSCOB. |
earned by profit-making PACS increased, while the losses made by loss making PACS declined. In the aggregate, 44,321 PACS earned profits amounting to Rs.1,064 crore, while 53,050 PACS incurred losses of Rs.1,920 crore. As a result, PACS, as a group, incurred lower net losses of Rs.857 crore during 2005-06 as compared with a total loss of Rs.1,261 crore during 2004-05. Both total demand and total collections increased during 2005-06. However, collections grew sharply. As a result, total overdues, as percentage of total demand, declined sharply to 30.4 per cent during 2005-06 from 33.6 per cent during 2004-05.
Regional Dimensions
4.118 On an average, a PACS served seven villages for the country as a whole at end-March 2006. Only in five States/UTs (Chandigarh, Nagaland, Sikkim, Maharashtra and Kerala) the penetration of PACS was high as they served on an average up to two villages. The North-Eastern region is relatively underserved (Table IV.29 and Appendix Table IV.8).
4.119 The average size of deposits mobilised by PACS was Rs.18.4 lakh. The average size of deposits of PACS in Kerala at Rs.563 lakh far exceeded that of any other States. In the States of Tamil Nadu, Orissa and Puducherry the average size of deposits mobilised by PACS was Rs.57 lakh, Rs.59 lakh, Rs.91 lakh, respectively. Average deposit mobilisation by PACS in most other States was insignificant.
4.120 In eleven States (Himachal Pradesh, Punjab, Rajasthan, Arunachal Pradesh, Mizoram, Sikkim, Jharkhand, Uttarakhand, Uttar Pradesh, Goa and Gujarat), the number of profit-making PACS as well as profits earned by them exceeded the number of loss making PACS and the amount of losses incurred by them. In three States/UTs (Chandigarh, Chhattisgarh and Kerala) the losses made by loss making PACS exceeded those of profits of profit-making PACS. In fifteen other States/UTs (Haryana, Jammu and Kashmir, Assam, Manipur, Meghalaya, Nagaland, Tripura, Andaman and Nicobar Island, Orissa, West Bengal, Madhya Pradesh, Maharashtra, Andhra Pradesh, Karnataka, Puducherry and Tamil Nadu) the number of loss making PACS as well as the amount of losses incurred by them exceeded the number of profit-making PACS and the amount of profits earned by them. Bihar was the only State where PACS earned overall profits even as the number of loss making PACS were more than the number of profit-making PACS. (Appendix Table IV.8).
4.121 Out of 106,376 PACS as on March 31, 2006, 66,525(63.5 per cent) were viable, 29,684 (27.9 per cent) potentially viable, 4,631 (4.4 per cent) dormant, 1,998 (1.9 per cent) defunct and 3,538 (2.4 per cent) others. The number of dormant and defunct PACS was the highest in West Bengal (1,282), followed by Nagaland (1,034) and Gujarat (942) (Appendix Table IV.8).
Table IV.29: Select Indicators of Primary Agricultural Credit Societies – |
State-wise-2005-06 |
Sr. |
State |
No. of |
No. of |
Average |
Working |
Societies in Profit |
Societies in Loss |
No. |
|
PACS |
Villages |
Deposits |
Capital |
No. |
Amount |
No. |
Amount |
|
|
|
covered |
(Rs. Lakh) |
(Rs. Lakh) |
|
(Rs. Lakh) |
|
(Rs. Lakh) |
1 |
|
2 |
3 |
4 |
5 |
6 |
7 |
8 |
9 |
Northern Region |
13,480 |
74,988 |
13.2 |
12,34,264 |
8,398 |
20,086 |
4,198 |
9,009 |
1. |
Chandigarh |
16 |
22 |
0.2 |
23 |
14 |
5 |
1 |
12 |
2. |
Delhi |
– |
– |
– |
– |
– |
– |
– |
– |
3. |
Haryana |
2,441 |
7,132 |
13.1 |
5,03,523 |
1,198 |
3,709 |
1,243 |
3,906 |
4. |
Himachal Pradesh |
2,086 |
19,388 |
31.4 |
93,743 |
1,701 |
937 |
318 |
84 |
5. |
Jammu and Kashmir |
187 |
2,950 |
4.9 |
9,976 |
22 |
15 |
165 |
130 |
6. |
Punjab |
3,978 |
12,428 |
15.0 |
4,16,652 |
2,403 |
3,595 |
1,171 |
1,574 |
7. |
Rajasthan |
4,772 |
33,068 |
4.1 |
2,10,347 |
3,060 |
11,825 |
1,300 |
3,303 |
North-Eastern Region |
3,535 |
35,546 |
3.9 |
6,40,096 |
600 |
7,841 |
867 |
10,253 |
8. |
Arunachal Pradesh |
31 |
3,649 |
– |
5,64,249 |
20 |
25 |
6 |
8 |
9. |
Assam |
809 |
23,422 |
0.6 |
7,533 |
309 |
7,639 |
419 |
9,909 |
10. |
Manipur |
186 |
– |
35.0 |
45,904 |
– |
– |
108 |
201 |
11. |
Meghalaya |
179 |
5,780 |
0.5 |
1,283 |
60 |
27 |
119 |
33 |
12. |
Mizoram |
175 |
660 |
0.1 |
175 |
59 |
70 |
4 |
10 |
13. |
Nagaland |
1,719 |
969 |
3.7 |
11,246 |
– |
– |
– |
– |
14 |
Sikkim |
166 |
166 |
– |
146 |
56 |
6 |
37 |
4 |
15. |
Tripura |
270 |
900 |
0.3 |
9,560 |
96 |
75 |
174 |
89 |
Eastern Region |
28,830 |
271,438 |
11.2 |
9,10,708 |
10,971 |
3,517 |
16,455 |
7,742 |
16. |
Andaman and Nicobar Island |
46 |
204 |
0.4 |
638 |
7 |
1 |
37 |
4 |
17. |
Bihar |
5,936 |
45,098 |
1.0 |
44,337 |
1,168 |
520 |
3,953 |
64 |
18. |
Jharkhand |
208 |
5,185 |
6.1 |
1,523 |
203 |
91 |
– |
– |
19. |
Orissa |
3,860 |
43,303 |
58.8 |
4,96,403 |
1,415 |
1,290 |
2,352 |
4,757 |
20. |
West Bengal |
18,780 |
177,648 |
4.7 |
3,67,807 |
8,178 |
1,615 |
10,113 |
2,918 |
|
|
|
|
|
|
|
|
|
|
Central Region |
15,381 |
193,562 |
4.5 |
5,72,972 |
7,401 |
9,041 |
5,080 |
14,718 |
21. |
Chhattisgarh |
1,373 |
20,841 |
12.3 |
87,193 |
811 |
1,153 |
562 |
1,681 |
22. |
Madhya Pradesh |
4,633 |
54,017 |
9.2 |
3,48,022 |
1,792 |
6,008 |
2,450 |
12,847 |
23. |
Uttarakhand |
446 |
5,900 |
6.6 |
11,830 |
262 |
107 |
100 |
37 |
24. |
Uttar Pradesh |
8,929 |
112,804 |
0.8 |
1,25,927 |
4,536 |
1,774 |
1,968 |
153 |
|
|
|
|
|
|
|
|
|
|
Western Region |
29,607 |
54,701 |
1.1 |
15,57,894 |
12,588 |
21219 |
16,266 |
47,458 |
25. |
Goa |
75 |
242 |
28.9 |
5,203 |
54 |
115 |
21 |
29 |
26. |
Gujarat |
8,487 |
16,997 |
2.1 |
5,29,421 |
5,027 |
3,763 |
2,880 |
3,487 |
27. |
Maharashtra |
21,045 |
37,462 |
0.7 |
10,23,270 |
7,507 |
17341 |
13,365 |
43,941 |
|
|
|
|
|
|
|
|
|
|
Southern Region |
15,543 |
84,938 |
86.2 |
29,85,282 |
4,357 |
18,074 |
10,160 |
1,02,867 |
28. |
Andhra Pradesh |
4,491 |
30,715 |
17.2 |
5,64,249 |
1,002 |
4,015 |
3,194 |
17,851 |
29. |
Karnataka |
4,911 |
34,069 |
20.9 |
4,70,393 |
1,732 |
4,621 |
2,811 |
8,239 |
30. |
Kerala |
1,600 |
1,556 |
562.9 |
11,31,095 |
772 |
4,807 |
762 |
8,224 |
31. |
Puducherry |
52 |
287 |
90.7 |
7,671 |
21 |
1 |
31 |
4 |
32. |
Tamil Nadu |
4,489 |
18,311 |
56.6 |
8,11,874 |
830 |
4,629 |
3,362 |
68,549 |
All-India Total |
106,376 |
715,173 |
18.4 |
7,338,667 |
44,321 |
71936 |
53,050 |
192,048 |
– : Nil/Negligible.
Note : Data on Dadra and Nagar Haveli are not available.
Source : NAFSCOB. |
Rural Co-operative Banks - Long-Term Structure
Structure, Spread and Growth
4.122 As at end-March 2006, the long-term cooperative credit structure consisted of 20 state co-operative agriculture and rural development banks (SCARDBs) and 696 primary co-operative agriculture and rural development banks (PCARDBs). Of the 20 SCARDBs (having 864 branches), eight were with unitary structure with branches, while twelve were federal/mixed in nature. In those States which were not served by the long-term structure, separate sections of the state co-operative banks look after the long-term credit needs. In the North-Eastern region, only three States (Assam, Manipur and Tripura) had long-term structure. The number of operational PCARDBs declined to 696 in March 2006 from 727 in March 2005 due to the amalgamation/ merger of PCARDBs.
State Co-operative Agriculture and Rural Development Banks
Operations
4.123 The assets/liabilities of the SCARDBs registered a moderate growth of 1.4 per cent during 2005-06 in comparison with 3.8 per cent in the previous year. On the liability side, the growth rate of deposits decelerated sharply while borrowing, which is the main source of resources for the SCARDBs, registered a marginal decline. On the asset side, the trend of unwinding of the investment portfolio in favour of loans and advances witnessed in 2004-05 was arrested as SCARDBs made fresh investments during the year. The growth rate of loans and advances extended by them, however, decelerated during 2005-06 (Table IV.30).
Financial Performance
4.124 Income of SCARDBs increased sharply, while their expenditure declined substantially. As a result, operating profits of SCARDBs increased sharply. Provisions and contingencies also declined during the year. Financial performance of the SCARDBs made a turnaround during 2005-06 and earned a net profit of Rs.262 crore during 2005-06 as compared with a net loss of Rs.163 crore during 2004-05 (Table IV.30). However, eight out of twenty SCARDBs recorded losses. The SCARDBs in Assam, Maharashtra, Karnataka and Tamil Nadu made a turnaround (Appendix Table IV.9). As a result of net profit during the year,
Table IV.30: Liabilities and Assets of |
State Co-operative Agriculture and |
Rural Development Banks |
(Amount in Rs. crore) |
Item |
As at end- |
Percentage |
|
March |
Variations |
|
2005 |
2006 |
2004 |
2005 |
|
|
|
-05 |
-06 |
1 |
2 |
3 |
4 |
5 |
Liabilities |
|
|
|
|
1. |
Capital |
791 |
801 |
3.6 |
1.3 |
|
|
(3.3) |
(3.2) |
|
|
2. |
Reserves |
2,165 |
2,354 |
-40.5 |
8.7 |
|
|
(8.9) |
(9.6) |
|
|
3. |
Deposits |
608 |
636 |
16.0 |
4.7 |
|
|
(2.5) |
(2.6) |
|
|
4. |
Borrowings |
17,182 |
17,075 |
1.5 |
-0.6 |
|
|
(70.8) |
(69.4) |
|
|
5. |
Other Liabilities |
3,525 |
3,738 |
131.0 |
6.0 |
|
|
(14.5) |
(15.2) |
|
|
Total Liabilities/Assets |
24,271 |
24,604 |
3.8 |
1.4 |
|
|
(100.0) |
(100.0) |
|
|
Assets |
|
|
|
|
1. |
Cash and Bank Balances |
360 |
365 |
-46.7 |
1.4 |
|
|
(1.5) |
(1.5) |
|
|
2. |
Investments |
1,867 |
1,885 |
-19.2 |
1.0 |
|
|
(7.7) |
(7.7) |
|
|
3. |
Loans and Advances |
17,403 |
17,713 |
7.0 |
1.8 |
|
|
(71.7) |
(72.0) |
|
|
4. |
Other Assets |
4,641 |
4,641 |
12.2 |
0.0 |
|
|
(19.1) |
(18.8) |
|
|
Note :
1.Figures in parentheses are percentages to total.
2. ata for Jammu and Kashmir repeated from 2004 and Manipur from 2002, respectively.
3. Data for SCARDBs in the States of Assam, Kerala and Himachal Pradesh repeated for the year 2005-06 from previous year.
4. Data are provisional.
Source : NABARD. |
accumulated losses declined to Rs.918 crore at end-March 2006 from Rs.1,098 crore at end-March 2005.
Asset Quality and Recovery Performance
4.125 The overall NPAs of SCARDBs continued to increase during 2005-06, both in absolute terms and in relation to total loan portfolio, although at a slower rate. However, increase in NPAs during the year was entirely on account of increase in NPAs in the ‘sub-standard’ category. NPAs in the ‘doubtful’ and ‘loss’ category declined
Table IV.31: Financial Performance of State |
Co-operative Agriculture and Rural |
Development Banks |
(Amount in Rs. crore) |
Item |
As at end- |
Percentage |
|
March |
Variations |
|
2004 |
2005 |
2004 |
2005 |
|
-05 |
-06 |
-05 |
-06 |
1 |
2 |
3 |
4 |
5 |
A. Income (i+ii) |
2,145 |
2,369 |
3.0 |
10.5 |
|
|
(100.0) |
(100.0) |
|
|
i) |
Interest Income |
2,100 |
2,269 |
2.5 |
8.0 |
|
|
(97.9) |
(95.8) |
|
|
ii) |
Other Income |
45 |
101 |
28.2 |
124.3 |
|
|
(2.1) |
(4.3) |
|
|
B. Expenditure (i+ii+iii) |
2,308 |
2,107 |
4.8 |
-8.7 |
|
|
(100.0) |
(100.0) |
|
|
i) |
Interest Expended |
1,371 |
1,335 |
-5.0 |
-2.6 |
|
|
(59.4) |
(63.4) |
|
|
ii) |
Provisions and |
|
|
|
|
|
Contingencies |
727 |
531 |
31.9 |
-27.0 |
|
|
(31.5) |
(25.2) |
|
|
iii) |
Operating Expenses |
209 |
241 |
1.5 |
15.2 |
|
|
(9.1) |
(11.4) |
|
|
|
of which : Wage Bill |
165 |
181 |
1.9 |
9.7 |
|
|
(7.2) |
(8.6) |
|
|
C. Profit |
|
|
|
|
i) |
Operating Profit |
564 |
793 |
30.4 |
40.5 |
ii) |
Net Profit |
-162.6 |
262.1 |
36.6 |
-261.2 |
D. Total Assets |
24,271 |
24,604 |
3.8 |
1.4 |
Note :
1. Figures in parentheses are percentages to respective totals.
2. Data for Jammu and Kashmir and Manipur repeated from
2003-04 and Manipur from 2001-02, respectively.
3. Data for SCARDBs in the States of Assam, Kerala and Himachal Pradesh repeated for the year 2005-06 from previous year.
4. Figures may differ from Appendix Table IV.9 due to different data sources.
5. Data are provisional.
Source : NABARD. |
during the year. Recovery performance witnessed sharp variations across the SCARDBs. However, on the whole overall recovery performance improved during the year. As a result of increase in NPAs, provisioning requirement and provisioning made increased during 2005-06 (Table IV.32).
Regional Dimensions
4.126 While SCARDBs operating in 11 States earned profits, in eight States they incurred losses
Table IV.32: Asset Quality of State |
Co-operative Agriculture and Rural |
Development Banks |
(Amount in Rs. crore) |
Item |
As at end- |
Percentage |
|
March |
Variations |
|
2005 |
2006 |
2004-05 |
2005-06 |
1 |
2 |
3 |
4 |
5 |
A. |
Asset Classification |
5,437 |
5,786 |
25.4 |
6.4 |
|
Total NPAs (i+ii+iii) |
(100.0) |
(100.0) |
|
|
|
i) |
Sub-Standard |
3,288 |
3,758 |
25.0 |
14.3 |
|
|
(60.5) |
(65.0) |
|
|
|
ii) |
Doubtful |
2,129 |
2,011 |
26.2 |
-5.5 |
|
|
(39.2) |
(34.8) |
|
|
|
iii) |
Loss Assets |
20 |
17 |
0.0 |
-16.9 |
|
|
(0.4) |
(0.3) |
|
|
B. |
NPAs to Loans Ratio |
31.2 |
32.7 |
|
|
|
Memo Item: |
|
|
|
|
|
i) |
Recovery to Demand |
44 |
47 |
|
|
|
ii) |
Provisions Required |
1,024 |
1445 |
22.9 |
41.1 |
|
iii) |
Provisions Made |
1,097 |
1573 |
31.8 |
43.4 |
Note :
Figures in parentheses are percentages to total.
Source : NABARD. |
(information for one State was not available). Profits earned by SCARDBs in four States (Punjab, Assam, Gujarat, and Kerala) improved during the year, while they declined in four States (Rajasthan, West Bengal, Madhya Pradesh and Uttar Pradesh). The performance of three SCARDBs in three States (Himachal Pradesh, Chhattisgarh and Puducherry) worsened during the year as they registered losses against net profits during 2004-05. Losses incurred by SCARDBs in Haryana, Tripura and Bihar increased further, while they declined for Orissa and Jammu and Kashmir (Appendix Table IV.9).
4.127 NPAs, as percentage of advances, of SCARDBs across States varied from nil (Punjab) to 100 per cent (Manipur) at end-March 2006. NPAs in four other States (Orissa, Chhattisgarh, Madhya Pradesh and Kerala) were less than 20 per cent. In as many as six States (Assam, Manipur, Bihar, Gujarat, Maharashtra, and Tamil Nadu), the NPA ratio was more than 50.0 per cent. The recovery ratio also varied widely between 1.9 per cent (Bihar) and 94.1 per cent (Punjab). The average recovery of SCARDBs increased to 47.3 per cent during 2005-06 of total demand from
44.0 per cent during 2004-05. In as many as 12 States, the recovery rate was less than 50 per cent (Appendix Table IV.9).
Primary Co-operative Agriculture and Rural Development Banks
Operations
4.128 Assets/liabilities of PCARDBs expanded moderately during 2005-06. Like SCARDBs, PCARDBs meet most of their fund requirement through borrowings which increased moderately during the year. Their reserves, another important source of funds, however, increased sharply, reversing the trend of the previous year. On the asset side, investment declined while loans and advances registered a marginal growth (Table IV.33).
Table IV.33: Liabilities and Assets of |
PCARDBs |
(Amount in Rs. crore) |
Item |
As at |
Percentage |
|
end-March |
Variations |
|
2005 |
2006 |
2004- |
2005- |
|
|
|
05 |
06 |
1 |
2 |
3 |
4 |
5 |
Liabilities |
|
|
|
|
1. Capital |
920 |
922 |
0.7 |
0.2 |
|
(4.5) |
(4.3) |
|
|
2. Reserves |
2,196 |
2,665 |
-25.4 |
21.4 |
|
(10.8) |
(12.5) |
|
|
3. Deposits |
364 |
382 |
-7.8 |
4.9 |
|
(1.8) |
(1.8) |
|
|
4. Borrowings |
12,750 |
13,066 |
7.3 |
2.5 |
|
(62.5) |
(61.2) |
|
|
5. Other Liabilities |
4,184 |
4,330 |
23.6 |
3.5 |
|
(20.4) |
(22.5) |
|
|
Total Liabilities/Assets |
20,413 |
21,365 |
4.6 |
4.7 |
|
(100.0) |
(100.0) |
|
|
Assets |
|
|
|
|
1. Cash and Bank Balances |
209 |
224 |
-9.2 |
7.3 |
|
(1.0) |
(1.1) |
|
|
2. Investments |
804 |
778 |
3.1 |
-3.3 |
|
(3.9) |
(3.6) |
|
|
3. Loans and Advances |
12,622 |
12,740 |
11.6 |
0.9 |
|
(61.9) |
(59.6) |
|
|
4. Other Assets |
6,778 |
7,623 |
-5.8 |
12.5 |
|
(33.2) |
(35.7) |
|
|
Note :
1. Figures in parentheses are percentages to total.
2. ‘Reserves’ include provisions and credit balance in profit and loss account.
3. Data for PCARDBs in the States of Tamil Nadu and Kerala repeated for the year 2005-06 from previous year.
4. Data are provisional.
Source : NABARD. |
Financial Performance
4.129 The financial performance of the PCARDBs deteriorated during 2005-06. Net interest income of PCARDBs increased significantly. On the expenditure side, operating expenses were also contained during the year. However, sharp decline in non-interest income resulted in sharp decline in operating profits. This combined with sharp growth in provisions and contingencies resulted in a net loss during 2005-06 as against net profit during 2004-05. In 2005-06, 331 PCARDBs registered profit of Rs.328 crore, while 194 loss-making PCARDBs incurred losses amounting to Rs.411 crore. The rise in overall losses led to an increase in the accumulated losses of PCARDBs to Rs.2,672 crore at end-March 2006 from Rs.2,475 crore at end-March 2005 (Table IV.34, Appendix Table IV.10).
Asset Quality and Recovery Performance
4.130 The overall NPAs of the PCARDBs, both in absolute amount and as percentage of total loans and advances, registered significant increases during 2005-06. Increase in NPAs was observed in ‘sub-standard’ asset categories, while NPAs in the‘doubtful’ and ‘loss’ asset category declined. Recovery performance also deteriorated at the aggregate as well as for most of the States. Provisioning requirement declined during the year. As a result, provisions made also declined somewhat. As in the previous year, provisions made exceeded the provisioning requirement (Table IV.35).
Regional Dimensions
4.131 Out of the 696 PCARDBs operating in 12 States, information was available for only 525 banks. While 331 PCARDBs made profits, 194 incurred losses. Himachal Pradesh and Maharashtra did not have any profit-making PCARDB (Appendix Table IV.10).
4.132 The NPA ratio of PCARDBs in all the States was more than 20.0 per cent at end-March 2006. PCARDBs operating in Punjab had the lowest NPA ratio (21.1 per cent), while those in Tamil Nadu the highest (69.9 per cent). NPAs of PCARDBs operating in Orissa, and Maharashtra were above 40 per cent, while those of Haryana, Himachal Pradesh, Madhya Pradesh, Karnataka and Kerala were above 30 per cent (Appendix Table IV.10).
Table IV.34: Financial Performance of |
PCARDBs |
(Amount in Rs. crore) |
Item |
|
|
Percentage |
|
|
|
Variations |
|
2004-05 |
2005-06 |
2004-05 |
2005-06 |
1 |
2 |
3 |
4 |
5 |
A. |
Income (i+ii) |
2,345 |
2,123 |
30.8 |
-9.5 |
|
|
(100.0) |
(100.0) |
|
|
|
i) |
Interest Income |
1,465 |
1,690 |
-0.4 |
15.4 |
|
|
(62.5) |
(79.6) |
|
|
|
ii) |
Other Income |
880 |
433 |
174.2 |
-50.8 |
|
|
(37.5) |
(20.4) |
|
|
B. |
Expenditure |
1,986 |
2,232 |
-3.1 |
12.4 |
|
(i+ii+iii) |
(100.0) |
(100.0) |
|
|
|
i) |
Interest Expended |
1,130 |
1,239 |
-1.3 |
9.6 |
|
|
(56.9) |
(55.5) |
|
|
|
ii) |
Provisions and |
545 |
698 |
-10.9 |
28.1 |
|
|
Contingencies |
(27.5) |
(31.3) |
|
|
|
iii) |
Operating Expenses |
311 |
295 |
6.4 |
-5.1 |
|
|
(15.6) |
(13.2) |
|
|
|
of which : |
204 |
205 |
0.1 |
0.5 |
|
Wage Bill |
(10.3) |
(9.2) |
|
|
C. |
Profit |
|
|
|
|
|
i) |
Operating Profit |
904 |
589 |
155.4 |
-34.8 |
|
ii) |
Net Profit |
359 |
-109 |
-239.2 * |
-130.3 |
D. |
Total Assets |
20,413 |
21,365 |
4.6 |
4.7 |
* : Represents an increase over a net loss of Rs.258 crore during 2003-04.
Note :
1. Figures in parentheses are percentages to respective total.
2. Data for PCARDBs in the States of Tamil Nadu and Kerala
repeated for the year 2005-06 from previous year.
3. Figures may differ from Appendix Table IV.10 due to different data sources.
4. Data are provisional.
Source : NABARD. |
The average recovery PCARDBs in three States (Himachal Pradesh, Karnataka and Tamil Nadu) was more than 60 per cent of total demand. The recovery rate of PCARDBs in seven more States (Punjab, Rajasthan, Orissa, West Bengal, Chhattisgarh, Madhya Pradesh, and Kerala) ranged between 40 per cent and 60 per cent. In the remaining two States (Haryana and Maharashtra), recovery rates were below 40 per cent (Appendix Table IV.10).
Table IV.35: Asset Quality of PCARDBs |
(Amount in Rs. crore) |
Item |
As at |
Percentage |
|
end-March |
Variations |
|
2005 |
2006 |
2004-05 |
2005-06 |
1 |
2 |
3 |
4 |
5 |
A. Asset Classification |
4,056 |
4,554 |
1.0 |
12.3 |
Total NPAs |
(100.0) |
(100.0) |
|
|
i) |
Sub-Standard |
2,161 |
2,635 |
3.9 |
21.9 |
|
|
(53.3) |
(57.9) |
|
|
ii) |
Doubtful |
1,845 |
1,873 |
-2.4 |
1.5 |
|
|
(45.5) |
(41.1) |
|
|
iii) |
Loss Assets |
50 |
46 |
6.4 |
-8.0 |
|
|
(1.2) |
(1.0) |
|
|
|
|
|
|
|
|
B. NPAs to Loans Ratio |
32.1 |
35.7 |
|
|
Memo Item: |
|
|
|
|
C. Recovery to Demand |
54 |
48 |
|
|
D. Provisions Required |
872 |
745 |
-7.6 |
-14.6 |
E. Provisions Made |
910 |
786 |
-3.5 |
-13.6 |
Note : Figures in parentheses represent percentages to total.
Source : NABARD. |
4. Micro Finance
4.133 In the post-nationalisation era, the banking system in India witnessed unprecedented growth and achieved phenomenal outreach. Notwithstanding this, empirical studies in the 1980s revealed that a very large number of the poorest of the poor continue to remain outside the reach of the formal banking system. It was realised that the existing banking policies, systems and procedures and deposits and loan products were not well suited to meet the credit needs of the poor. Apart from the existing banking network, with a view to developing a supplementary credit delivery system that is cost effective and user friendly for both banks and the poor, micro finance initiatives were encouraged in India. These initiatives have been centered around two models, i.e., the SHG-Bank Linkage Programme and the Micro Finance Institutions (MFIs) model.
Self-Help Group (SHG) - Bank Linkage Programme
4.134 The SHG-Bank Linkage Programme was started as an action research project in 1989. The findings of the project led to the launching of the pilot project by NABARD in 1992 with policy support from the Reserve Bank. The pilot project was designed as a partnership model between three agencies, viz., the SHGs, banks and non-government organisations (NGOs). The SHGs were expected to facilitate collective decision making by the poor and provide ‘doorstep banking’, the banks as wholesalers of credit, were to provide the resources, while the NGOs were to act as agencies to organise the poor, build their capacities and facilitate the process of empowering them.
4.135 The programme has since come a long way from the pilot project of financing 500 SHGs across the country. It has proved its efficacy as a mainstream programme for banking with the poor who mainly comprise the marginal farmers, landless labourers, artisans and craftsmen and others engaged in small businesses such as hawking and vending in the rural areas. The main advantages of the programme are timely repayment of loans to banks, reduction in transaction costs both to the poor and the banks, doorstep “saving and credit” facility for the poor and exploitation of the untapped business potential of the rural areas. The programme, which started as an outreach programme has not only aimed at promoting thrift and credit, but also contributed immensely towards the empowerment of the rural women.
Progress during 2006-07
4.136 The SHG-Bank Linkage Programme continued to be the predominant micro finance model in the country. During 2006-07, 686,408 new SHGs were credit linked with banks, taking the cumulative number of SHGs credit linked to 2.92 million. In addition, 457,410 existing SHGs received repeat finance during the year. Bank loans disbursed to SHGs during 2006-07 amounted to Rs.6,643 crore taking the cumulative bank loan disbursed to SHGs up to March 2007 to Rs.18,041 crore. The phenomenal outreach of the programme has enabled more than 41 million poor households to gain access to micro finance from the formal banking system, registering a growth of 24 per cent over 2005-06 (Table IV.36).
4.137 During 2006-07, NABARD intensified the implementation of the programme in the 13 identified priority States, some of which account for the bulk of the rural poor, viz., Uttar Pradesh, Orissa, West Bengal, Madhya Pradesh, Maharashtra, Gujarat, Rajasthan, Chhattisgarh, Jharkhand, Bihar, Assam, Himachal Pradesh and Uttrakhand. Accordingly, the programme spread rapidly in these states indicating a marked shift from its initial localisation in the Southern region.
Table IV.36: SHG - Bank Linkage Programme |
(Amount in Rs. crore) |
Year |
Total SHGs financed by banks (in '000) |
Bank Loans |
Refinance |
|
During the year |
Cumulative |
During the year |
Cumulative |
During the year |
Cumulative |
1 |
2 |
3 |
4 |
5 |
6 |
7 |
1992-99 |
33 |
33 |
57 |
57 |
52 |
52 |
1999-00 |
82 |
115 |
136 |
193 |
98 |
1507 |
|
(147.9) |
(247.9) |
(138.1) |
(238.1) |
(88.6) |
(188.6) |
2000-01 |
149 |
264 |
288 |
481 |
251 |
401 |
|
(82.3) |
(129.9) |
(112) |
(149.2) |
(155.5) |
(167.0) |
2001-02 |
198 |
461 |
545 |
1,026 |
396 |
796 |
|
(32.6) |
(74.9) |
(89) |
(113.4) |
(57.9) |
(98.8) |
2002-03 |
256 |
717 |
1,022 |
2,049 |
622 |
1,419 |
|
(29.5) |
(55.4) |
(87) |
(99.6) |
(57.2) |
(78.1) |
2003-04 |
362 |
1079 |
1,856 |
3,904 |
706 |
2,125 |
|
(41.4) |
|
(81) |
(90.6) |
(13.4) |
(49.7) |
2004-05 |
539 |
1,618 |
2,994 |
6,898 |
968 |
3,092 |
|
(49.1) |
(50.0) |
(61) |
(76.7) |
(37.1) |
(45.5) |
2005-06 |
620 |
2,239 |
4,499 |
11,398 |
1,068 |
4,160 |
|
(15.0) |
(38.3) |
(50.3) |
(65.2) |
(10.3) |
(34.5) |
2006-07 |
686 |
2,924 |
6,643 |
18,041 |
1,299 |
5,459 |
|
(11.0) |
(30.6) |
(47.6) |
(58.3) |
(21.6) |
(31.2) |
Note :
1. Figures in parentheses indicate annual percentage growth.
2. Data for 2006-07 are provisional.
Source : NABARD. |
Table IV.37: Region-wise Growth in Credit Linkage of SHGs |
Region |
Number of SHGs Credit Linked |
Number of SHGs Credit Linked |
|
2000-01 |
Cumulative |
2006-07 |
Cumulative |
|
|
at end-March 2001 |
|
at end-March 2007 |
|
Number |
Share in |
Number |
Share in |
Number |
Share in |
Number |
Share in |
|
|
total |
|
total |
|
total |
|
total |
1 |
2 |
3 |
4 |
5 |
6 |
7 |
8 |
9 |
Northern |
4,221 |
3.0 |
9,012 |
3.4 |
48,921 |
7.1 |
182,018 |
6.3 |
North-Eastern |
160 |
0.1 |
477 |
0.2 |
29,237 |
4.2 |
91,754 |
3.1 |
Eastern |
11,057 |
7.9 |
22,252 |
8.4 |
131,530 |
19.2 |
525,881 |
17.8 |
Central |
8,631 |
6.2 |
28,851 |
10.9 |
64,814 |
9.5 |
332,729 |
11.4 |
Western |
6,911 |
4.9 |
15,543 |
5.9 |
104,193 |
15.2 |
270,447 |
9.3 |
Southern |
109,218 |
77.9 |
187,690 |
71.2 |
307,713 |
44.8 |
1,522,144 |
52.0 |
Total |
140,198 |
100.0 |
263,825 |
100.0 |
686,408 |
100.0 |
2,924,973 |
100.0 |
Note : Data for 2006-07 are provisional.
Source : NABARD. |
The cumulative share of non-southern regions rose from 29 per cent at end-March 2001 to 48 per cent at end-March 2007 (Table IV.37).
4.138 The low transaction cost and almost zero NPA levels in the SHG portfolio of the banks has made the SHG-Bank Linkage programme a useful commercial proposition for the banks. In terms of relative shares of different agencies, commercial banks continue to maintain their lead both in terms of numbers of SHGs credit linked and loan disbursed. Though RRBs take the second position after banks, their share in the total has declined in recent years. The share of co-operative banks remained unchanged at 14 per cent in terms of number of SHGs credit linked and their share in loan disbursed dropped during the year (Table IV.37).
4.139 Of the approximately 2.9 million SHGs, over one million are mature SHGs and have availed multiple loans from the banking system. Enabling such mature SHGs to take up micro enterprises is a major challenge for development planners. During 2005-06, a focussed and location-specific micro-enterprise development programme (MEDP) on skill upgradation and development for sustainable livelihoods for members of the matured SHGs was launched by NABARD. During 2006-07, 297 MEDPs were conducted covering 7,579 SHG members. The micro enterprises for which training was imparted to the SHG members included diverse activities such as goatery, mushroom cultivation, papad, agarbatti (incense stick) making, candle making, jute products making, among others.
4.140 Out of the three models which emerged under the SHG-Bank Linkage Programme over the years, about 81.1 per cent of the SHGs were financed by banks under Model II which involved NGO and government agencies (Table IV.39).
4.141 NABARD had also launched a pilot project for promotion of micro enterprises among the members of matured SHGs during 2005-2006. This pilot project is being implemented in nine districts spread over nine States. Fourteen NGOs, acting as ‘micro enterprise promotion agency’ (MEPA), are implementing the pilot project under the technical guidance of New Delhi based organisation called Marketing and Research Team (MART). During 2006-07, MEPAs completed the detailed survey of the districts. The surveys typically identified existing opportunities and supply and demand pattern for farm and non-farm activities that can be taken up on a project basis for sustainable income generation in the identified project area. Besides survey analysis, the identification of suitable activities was carried out through participatory processes and in consultation with SHG members. Action plans were finalised by each MEPA after discussions and consultations with the identified members of SHGs and also keeping in view the survey findings. Micro enterprise specific training calendar has been prepared for skill upgradation and better market acceptability of products. So far, out of 14 NGOs, four have completed the training schedule and 141 micro - enterprises have been established with financial assistance of Rs.31.19 lakhs.
Table IV.38: Linkage Position-Agency-wise* |
(As at end-March) |
(Amount in Rs. crore) |
Agency |
Number (in '000) of SHGs |
Bank Loan Disbursed |
|
2005-06 |
2006-07 |
Percentage variation |
2005-06 |
2006-07 |
Percentage variation |
|
|
|
2005-06 |
2006-07 |
|
|
2005-06 |
2006-07 |
1 |
2 |
3 |
4 |
5 |
6 |
7 |
8 |
9 |
Commercial Banks |
1,188 |
1,595 |
40.9 |
34.3 |
6,988 |
11,397 |
68.0 |
63.09 |
|
(53.0) |
(55.0) |
|
|
(61.0) |
(63.0) |
|
|
RRBs |
740 |
911 |
31.2 |
23.1 |
3,322 |
5,031 |
58.2 |
51.4 |
|
(33.0) |
(31.0) |
|
|
(29.0) |
(28.0) |
|
|
Co-operative Banks |
310 |
418 |
46.9 |
34.8 |
1,087 |
1,597 |
69.8 |
46.9 |
|
(14.0) |
(14.0) |
|
|
(10.0) |
(9.0) |
|
|
Others |
271 |
– |
– |
– |
0.52 |
15 |
– |
– |
|
(12.1) |
|
|
|
(0.005) |
(0.1) |
|
|
Total |
2,239 |
2,924 |
38.4 |
30.6 |
11,398 |
18,040 |
65.2 |
58.3 |
|
(100.0) |
(100.0) |
|
|
(100.0) |
(100.0) |
|
|
*: Cumulative position as at end of the period.
Note : Figures in parentheses are percentages to total.
Source : NABARD. |
MFIs-Bank Linkages
4.142 Micro-Finance Institutions (MFIs) are working under various legal forms in the country. These can be broadly classified as (i) a Society registered under the Societies Registration Act, 1860; (ii) a Public Trust registered under the Indian Trust Act, 1882 / Public Trust Act, 1920 or any State enactment governing religious or charitable public trusts; (iii) a co-operative society registered under the provisions of the State Cooperative Societies Act or under the Mutually Aided or Mutual Benefit Co-operative Societies Act or Multi-State Co-operative Societies Act, 2002 or under any other law relating to Co-operative Societies in force in India; (iv) a not-for-profit company registered under Section 25 of the Companies Act, 1956 and specifically exempted from registration by the Reserve Bank; and (v) non-banking financial companies (NBFCs) registered under the Companies Act, 1956 and regulated by the Reserve Bank.
4.143 The Finance Minister in the Budget Speech for 2005-06 had indicated that the Government intended to promote MFIs in a big way. Accordingly the ‘Micro-Finance Development Fund’ placed with NABARD was re-designated as ‘Micro-Finance Development and Equity Fund’ and its corpus was enhanced to Rs.200 crore from Rs.100 crore.
4.144 During 2006-07, efforts were made to strengthen MFIs and promote linkages of MFIs with banks. The scheme for providing financial support to banks for rating of MFIs was broad based and extended up to March 2008. Besides, a scheme called ‘Capital/Equity support to MFIs from MFDEF’ was launched to enable the MFIs to leverage capital/equity for accessing commercial and other funds from banks. Three MFIs were provided capital support to the tune of Rs.3 crore during the year.
4.145 Further, with a view to promoting the orderly growth of the micro finance sector, a Micro Financial Sector (Development and Regulation) Bill, 2007 was prepared by NABARD in consultation with the Ministry of Finance, Government of India. The Bill was introduced in the Lok Sabha on March 20, 2007. It has been referred to the ‘Standing Committee’ of Parliament for further deliberations.
4.146 Notwithstanding the continuing efforts to improve the micro finance system and extend its outreach, the system faces some challenges at the present juncture (Box IV.4).
Box IV.4: Micro Finance: Future Challenges and Strategy
Micro finance acts as a catalyst in the lives of the poor. It has helped them achieve a reasonable rise in their income level and improve their standards of living. Thus, micro finance is expected to play an important role in promoting financial inclusion and inclusive growth. However, there is a large gap in the demand and supply of credit to the poor. As per some estimates, the credit support for poor households in India has been assessed at about Rs.4,50,000 crore. Some of the micro level studies indicate that the poor still continue to depend on informal sources of credit, accounting for 40 per cent to 60 per cent of the household demand. There are, however, several challenges faced by the micro finance system.
Regional Imbalances : There is a skewed distribution of SHGs in favour of Southern region. The dominance of the Southern States has, albeit, declined in recent years on account of rapid progress in promotion and credit linkage of SHGs in non-Southern States. Nevertheless, over 50 per cent of the total SHG credit linkages in the country are concentrated in the Southern States. However, in States which have a larger share of the poor, the coverage is comparatively low.
Quality of SHGs : Sustainability in income generation is dependent on the quality of a SHG. Therefore, ensuring quality of a SHG is a big challenge. Owing to the fast growth of the SHG-Bank Linkage Programme, the quality of SHGs has come under stress. Some of the factors affecting the quality of SHGs are (i) the target oriented approach of some of the government departments in promoting groups; (ii) inadequate incentives to NGOs for nurturing them on a sustainable basis; and (iii) low level of skills on the part of the SHG members in managing their groups.
The strength of the programme stems from the fact that the loan recovery levels under the programme are significantly higher than credit disbursed under various government sponsored programmes. However, the quality of SHGs is of paramount importance to sustain the higher recovery levels.
Training of SHPIs, banks, SHG members : The success of the programme depends on the role played by self-help promoting institutions (SHPIs) in the promotion of quality groups and easy hassle free availability of bank credit. The promotion of quality groups, in turn, depends on the internal strengths – managerial and financial – of SHPIs. Therefore, capacity building through training programmes in respect of various stakeholders remains a challenge in the absence of quality resource centers at the district level as also lack of adequate appreciation on providing training to various personnel involved in the programme implementation.
Graduation from credit to enterprise : The more critical challenge is to induce SHGs to graduate into matured levels of enterprise, livelihood diversification, increased access to the supply chain, linkages to the capital market and appropriate/production and processing technologies.
The SHG Bank-Linkage programme needs to enable SHGs to also meet the non-financial requirements for setting up businesses and enterprises. However, there are not many viable and sustainable livelihoods in the area. This has led to groups turning morbid. i.e., older SHGs not availing credit from banks after the initial few rounds of credit linkage. The job of micro enterprise promotion is further compounded because of factors like self-confidence, ability to invest, and access to market opportunities being unequal among the groups.
Emergence of SHG Federations: Of late, many SHPIs have started promoting federations of SHGs so that some of their functions can be performed by them in a cost effective and sustainable manner. However, no serious efforts have been made towards capacity building of federations. There is no established model which can be replicated across the country.
The emergence of SHG Federations represents the aggregation of collective bargaining power and economies of scale. They are fora for addressing social and economic issues. However, every additional tier adds to its cost and, thus, tends to weaken the primaries. It must, therefore, be ensured that the quality of the federations is good. To ensure the quality of federations, care needs to be taken by monitoring institutions engaged in promoting SHG Federations. One, federation should be evolved based on the felt need of the SHGs and the group should have freedom to or not to join the federation. Two, the federations need to be evolved as member-owned, member-driven institutions so that they can function in a democratic manner, keeping in view the aspirations of their constituents – self-help group. Three, the process and systems of federations need to be designed in such a way that these federations do not depend on the promoter perpetually and become self-managed in a reasonable period of time.
High Cost of Delivery: MFI model is comparatively costlier in terms of delivery of financial services due to low volume of loan and also loan size as also the cost of funds. A good number of MFIs are subsidy dependent and only few MFIs are able to cover more than 80 per cent of their costs. High rate of interest charged by them has become an area of concern. While it is agreed that the cost of services offered by MFIs is high, there is no consensus on the floor limit of rate of interest that could be permitted to be charged by MFIs. They, therefore, need to develop strategies for increasing the range and volume of their financial services so that they can provide their services at a cost affordable by poor.
Capacity building of MFIs: Successful delivery of flexible, client driven and innovative micro finance services to the poor would not be possible without building up the capacities of the MFIs and their primary stakeholders. Innovations in various aspects such as social intermediation, strategic linkages and new approaches centered on the livelihood issues surrounding the poor, and the re-engineering of the financial products offered by them are the need of the hour.
Future Strategies: Inspite of phenomenal growth of SHG-Bank Linkage Programme achieved over the years, there is still a large segment of society that is denied access to financial services. An estimate suggests that only 20 per cent of the low income group population has access to financial services. Thus, there is an urgent need to widen the scope, outreach as also the scale of financial services to cover the un-reached population.
5. NABARD and the Co-operative Sector
4.147 National Bank for Agriculture and Rural Development (NABARD) was established on July 12, 1982 as a development bank to perform the following functions: (i) to serve as an apex financing agency for the institutions providing investment and production credit for promoting various developmental activities in rural areas; (ii) to take measures towards institution building for improving absorptive capacity of the credit delivery system, including monitoring, formulation of rehabilitation schemes, restructuring of credit institutions and training of personnel; (iii) to co-ordinate the rural financing activities of all institutions engaged in developmental work at the field level and liaison with the Government of India, the State Governments, the Reserve Bank and other national level institutions concerned with policy formulation; and (iv) to undertake monitoring and evaluation of projects refinanced by it.
4.148 NABARD’s refinance is available to state co-operative agriculture and rural development banks (SCARDBs), state co-operative banks (StCBs), regional rural banks (RRBs), commercial banks and other financial institutions approved by the Reserve Bank, while the ultimate beneficiaries of investment credit can be individuals, partnership concerns, companies, State-owned corporations or co-operative societies. Production credit is generally extended to individuals.
Resources of NABARD
4.149 Till 2005-06, the Reserve Bank provided two General Lines of Credit (GLC) to NABARD under Section 17(4E) of the RBI Act 1934, to enable it to meet the short-term requirements of scheduled commercial banks, State co-operative banks and RRBs. During 2005-2006 (July-June), a GLC of Rs.3,000 crore was sanctioned at an interest rate of 6 per cent per annum, for providing refinance to State co-operative banks and RRBs for seasonal agricultural operations (SAO). However, NABARD was permitted to operate the GLC limit sanctioned for 2005-06 for drawals as well as for repayments up to December 31, 2006. As the limit was not available after December 31, 2006, NABARD was advised to consider accessing the markets on a regular basis for sufficient amounts so that the timeframe indicated for withdrawal of GLC was adhered to. Accordingly, the entire outstanding amount was repaid to the Reserve Bank on January 31, 2007.
4.150 Net accretion to the resources of NABARD at Rs.13,615 crore during 2006-07 registered a sharp increase of 199.5 per cent. Rural Infrastructure Development Fund (RIDF) and issuance of bonds emerged as the two most important sources of funds. After repaying the entire outstanding amount to the Reserve Bank as mentioned above, NABARD was left with a sizable amount for lending activity during the year (Table IV.40).
Table IV.39: Model-Wise Linkage Position |
Model Type |
As at March 31, |
As at March 31, |
|
|
|
2006 |
2007 (P) |
|
|
No. of SHGs |
Bank loans |
No. of SHGs |
Bank loans |
|
|
('000) |
(Rs. crore) |
('000) |
(Rs. crore) |
1 |
|
2 |
3 |
4 |
5 |
i. |
SHGs promoted, guided
and financed by banks |
449 |
1,637 |
566 |
2,383 |
|
|
(20.1) |
(14.4) |
(19.4) |
(13.2) |
ii. |
SHGs promoted by
NGOs/Government agencies |
1,646 |
9,200 |
2,162 |
14,633 |
|
and financed by banks |
(73.5) |
(80.7) |
(73.9) |
(81.1) |
iii. |
SHGs promoted by NGOs
and financed by banks |
143 |
561 |
197 |
1,024 |
|
using NGOs/formal agencies
as financial intermediaries |
(6.4) |
(4.9) |
(6.7) |
(5.7) |
Total (i+ii+iii) |
2,239 |
11,398 |
2,925 |
18,040 |
P : Provisional
Note : Figures in parentheses are
percentages to total
Source : NABARD. |
Rural Infrastructure Development Fund (RIDF)
4.151 RIDF was set up with NABARD under the initiative of the Central Government in 1995-96 to provide loans to the State Governments for financing rural infrastructure projects. Since then, twelve tranches of allocations have been made towards the fund. Commercial banks make contributions to the fund to the extent of shortfalls in their agriculture and/or priority sector lending. Since 1999-2000, the scope of RIDF has been widened to enable utilisation of loan by Panchayat Raj institutions (PRIs), self-help groups (SHGs), non-government organisations (NGOs), among others.
4.152 In pursuance to the announcement made by the Finance Minister, a separate window was opened under RIDF XII for funding rural road component of Bharat Nirman Programme with an allocation of Rs.4,000 crore during 2006-07. National Rural Roads Development Agency (NRRDA), a society under the Ministry of Rural Development, is the identified nodal Agency to borrow from NABARD for the purpose and a loan of Rs.4,000 crore was also sanctioned to it under RIDF XII.
4.153 With the receipt of Rs. 6,966 crore deposits from commercial banks during the year, the cumulative deposits received under RIDF amounted to Rs.35,716 crore (Table IV.41).
4.154 The total corpus of the RIDF under tranches I to XII (excluding for Bharat Nirman) aggregated Rs.60,000 crore. Financial assistance
Table IV.40: Net Accretion to the |
Resources of NABARD |
(Amount in Rs. crore) |
Type of Resource |
2005-06 |
2006-07 |
1 |
2 |
3 |
1. |
Capital |
– |
– |
2. |
Reserves and Surplus |
775 |
828 |
3. |
National Rural Credit (NRC) (i+ii) |
42 |
42 |
|
i) |
Long-Term Operations (LTO) Fund |
31 |
31 |
|
ii) |
Stabilisation Fund |
11 |
11 |
4. |
Deposits (i+ii) |
4,827 |
6,185 |
|
i) |
Ordinary Deposits |
21 |
5 |
|
ii) |
RIDF Deposits |
4,806 |
6,180 |
5. |
Borrowings (i+ii+iii+iv+v) |
873 |
5,058 |
|
i) |
Bonds and Debentures |
3,609 |
8,079 |
|
ii) |
Borrowings from Central |
|
|
|
|
Government |
-4 |
-18 |
|
iii) |
Borrowings from the |
|
|
|
|
Reserve Bank |
-929 |
-2,998 |
|
iv) |
Foreign Currency Loans |
-3 |
-5 |
|
v) |
Borrowings from |
|
|
|
|
Commercial Banks |
-1,800 |
0 |
6. |
Other Liabilities |
60 |
688 |
7. |
Other Funds |
249 |
814 |
Total |
6,826 |
13,615 |
– : Nil/Negligible.
Source : NABARD. |
sanctioned and disbursed under RIDF I to XII was Rs.61,540 crore and Rs.37,560 crore, respectively, as on March 31, 2007 (Table IV.42). RIDF V was closed on June 30, 2006 and the disbursements
Table IV.41: Deposits Mobilised under RIDF |
(Rs. crore) |
Year |
RIDF |
RIDF |
RIDF |
RIDF |
RIDF |
RIDF |
RIDF |
RIDF |
RIDF |
RIDF |
RIDF |
RIDF |
Total |
|
I |
II |
III |
IV |
V |
VI |
VII |
VIII |
IX |
X |
XI |
XII |
|
1 |
2 |
3 |
4 |
5 |
6 |
7 |
8 |
9 |
10 |
11 |
12 |
13 |
14 |
1995-96 |
350 |
– |
– |
– |
– |
– |
– |
– |
– |
– |
– |
– |
350 |
1996-97 |
842 |
200 |
– |
– |
– |
– |
– |
– |
– |
– |
– |
– |
1,042 |
1997-98 |
188 |
670 |
149 |
– |
– |
– |
– |
– |
– |
– |
– |
– |
1,007 |
1998-99 |
140 |
500 |
498 |
200 |
– |
– |
– |
– |
– |
– |
– |
– |
1,338 |
1999-00 |
67 |
539 |
797 |
605 |
300 |
– |
– |
– |
– |
– |
– |
– |
2,307 |
2000-01 |
– |
161 |
412 |
440 |
851 |
790 |
– |
– |
– |
– |
– |
– |
2,654 |
2001-02 |
– |
155 |
264 |
– |
689 |
988 |
1,495 |
– |
– |
– |
– |
– |
3,591 |
2002-03 |
– |
– |
188 |
168 |
541 |
817 |
731 |
1,413 |
– |
– |
– |
– |
3,857 |
2003-04 |
– |
– |
– |
– |
261 |
503 |
257 |
681 |
457 |
– |
– |
– |
2,159 |
2004-05 |
– |
– |
– |
– |
125 |
488 |
752 |
1,213 |
1,354 |
422 |
– |
– |
4,353 |
2005-06 |
– |
– |
– |
– |
215 |
165 |
461 |
923 |
1,372 |
2,020 |
936 |
– |
6,092 |
2006-07 |
– |
– |
– |
– |
70 |
161 |
202 |
561 |
752 |
2,288 |
1,586 |
1,346 |
6,966 |
Total |
1,587 |
2,225 |
2,308 |
1,412 |
3,052 |
3,912 |
3,898 |
4,791 |
3,933 |
4,730 |
2,522 |
1,346 |
35,716 |
Table IV.42: Loans Sanctioned and Disbursed under RIDF |
(As on March 31, 2007) |
RIDF |
Year |
No. of |
Corpus |
Loans |
Loans |
Loan disbursed |
|
|
Projects |
(Rs. crore) |
Sanctioned |
Disbursed |
as percentage of |
|
|
|
|
(Rs. crore) |
(Rs. crore) |
loans sanctioned |
1 |
2 |
3 |
4 |
5 |
6 |
7 |
I |
1995 |
4,168 |
2,000 |
1,906 |
1,761 |
92.4 |
II |
1996 |
8,193 |
2,500 |
2,636 |
2,398 |
91.0 |
III |
1997 |
14,345 |
2,500 |
2,733 |
2,454 |
89.8 |
IV |
1998 |
6,171 |
3,000 |
2,903 |
2,482 |
85.5 |
V |
1999 |
12,234 |
3,500 |
3,472 |
3,055 |
88.0 |
VI |
2000 |
43,295 |
4,500 |
4,504 |
3,957 |
87.9 |
VII |
2001 |
24,781 |
5,000 |
4,625 |
3,947 |
85.4 |
VIII |
2002 |
20,968 |
5,500 |
5,987 |
4,770 |
79.7 |
IX |
2003 |
19,595 |
5,500 |
5,593 |
4,008 |
71.7 |
X |
2004 |
17,524 |
8,000 |
8,117 |
4,732 |
58.3 |
XI |
2005 |
30,434 |
8,000 |
8,509 |
2,456 |
36.0 |
XII |
2006 |
42,317 |
10,000 |
10,555 |
1,541 |
46.9 |
|
|
|
|
|
|
|
Total |
|
2,44,025 |
60,000 |
61,540 |
37,560 |
71.4 |
Source : NABARD. |
thereunder were allowed up to September 30, 2006. The implementation period for the projects sanctioned under RIDF VI to IX were extended up to March 31, 2007 to enable the State Governments to complete ongoing projects and avail reimbursement of the expenditure.
4.155 Details regarding State-wise cumulative sanctions and disbursements under RIDF scheme are set out in Appendix Table IV.11.
Credit Extended by NABARD
4.156 NABARD provides short-term credit facilities to StCBs for financing Seasonal Agricultural Operations (SAO); marketing of crops; pisciculture activities; production/ procurement and marketing activities of cooperative weavers societies; purchase and sale of yarn by apex/regional societies; production and marketing activities of industrial co-operatives; financing of individual rural artisans through PACS; purchase and distribution of fertilisers and allied activities; and marketing activities. Medium-term facilities were provided to StCBs and RRBs for converting short-term loans for financing SAO to medium-term (conversion) loans and for approved agricultural purposes. Long-term loans are provided to the State Governments for contributing to share capital of co-operative credit institutions. During 2006-07, NABARD sanctioned total credit limits aggregating Rs.16,338 crore as against Rs.13,099 crore during 2005-06 for various short and medium-term purposes to StCBs and RRBs, and long-term loans to the State Governments. While limits granted to the State co-operative banks increased significantly, those granted to RRBs declined during the year. However, amounts drawn by these institutions were significantly lower than the previous year. The repayments were also significantly lower, leading to an increase in outstanding amount at end-June 2007 (Table IV.43).
Interest Rates charged by NABARD
4.157 Interests rate charged by NABARD for term loans effective May 14, 2007 ranged from 9.0 per cent to 9.5 per cent. The interest rate charged for term loan from RRBs were lowered from 9.5 percents to 9 per cent effective November 1, 2007. The interest rate charged by NABARD has been neutral to the size of loan (Table IV.44).
Kisan Credit Card Scheme
4.158 The Kisan Credit Card (KCC) scheme, introduced in August 1998 for short-term loans for seasonal agricultural operations, has been under implementation in all States and UTs by all public sector banks, RRBs and co-opeartive banks, facilitating smooth flow of crop loans. To further expand the coverage of borrowers under the KCC scheme and to improve the credit flow
Table IV.43: NABARD's Credit to StCBs, State Government and RRBs |
(Amount in Rs. crore) |
Category |
2005-06 |
2006-07 |
|
Limits |
Drawals |
Repayments |
Outstanding |
Limits |
Drawals |
Repayments |
Outstanding |
1 |
2 |
3 |
4 |
5 |
6 |
7 |
8 |
9 |
1. |
State Co-operative Banks |
|
|
|
|
|
|
|
|
|
(a+b) |
9,834 |
13,795 |
10,975 |
9,610 |
13,632 |
12,153 |
3,131 |
11,557 |
|
a. |
Short-term |
9,319 |
12,594 |
10,764 |
7,539 |
13,404 |
12,093 |
3,045 |
9,512 |
|
b. |
Medium-term |
515 |
1,201 |
211 |
2,071 |
228 |
60 |
86 |
2,045 |
2. |
State Governments |
|
|
|
|
|
|
|
|
|
Long-term |
23 |
47 |
65 |
387 |
20 |
16 |
68 |
335 |
3. |
Regional Rural Banks |
|
|
|
|
|
|
|
|
|
(a+b) |
3,243 |
3,222 |
1,833 |
2,770 |
2,686 |
2,702 |
327 |
3,147 |
|
a. |
Short-term |
2,761 |
2,613 |
1,831 |
2,142 |
2,686 |
2,702 |
326 |
2,519 |
|
b. |
Medium-term |
482 |
609 |
2 |
628 |
00 |
00 |
1 |
627 |
Grand Total (1+2+3) |
13,099 |
17,063 |
12,873 |
12,767 |
16,338 |
14,871 |
3,526 |
15,039 |
Note :
1. Short-term includes seasonal agricultural operations (SAO)
and other than seasonal agricultural operations (OSAO).
2. SAO (SCBs) period July to June, SAO (RRBs) period July to June,
OSAO (SCBs) period April to March, OSAO (RRBs) period July to June.
3. Medium-term includes MT Conversion and Liquidity Support Scheme;
MT (SCBs) period July to June, MT (RRBs) period January-December.
4. Loans to State Government period April to March.
Source : NABARD. |
under agriculture, the scheme has been extended to borrowers for term credit as also working capital for agriculture and allied activities and a reasonable component for consumption needs, thus, paving the way for acceptance of KCC as a single window for comprehensive credit.
4.159 During 2006-07, the co-operative banks, commercial banks and RRBs issued 2.30 million, 4.81 million and 1.40 million cards, respectively (Table IV.45). Of the total 66.56 million cards issued by the banking system since inception of the scheme upto March 31, 2007, co-operative banks accounted for the largest share (49.1 per cent), followed by commercial banks (38.4 per cent) and RRBs (12.4 per cent). The banking system has been routing crop loans through KCCs, having recognised it as an accepted mechanism for delivery of credit to farmers.
Table IV.44: Rate of Interest on refinance from NABARD on Investment Credit |
under Farm/Non-Farm Sectors* |
(per cent per annum) |
Size of loan |
Rate of Interest to ultimate beneficiaries |
Rate of Interest on Refinance |
|
Commercial |
RRBs |
StCBs/ |
Commercial |
StCBs / |
|
Banks |
|
SCARDBs |
Banks/RRBs/ |
SCARDB |
|
|
|
|
PUCBs |
|
1 |
2 |
3 |
4 |
5 |
6 |
Up to Rs.25,000 |
As per RBI |
As per RBI |
As determined by |
9.5 |
9 |
|
instructions. |
instructions |
NABARD subject |
|
|
|
|
|
to minimum of |
|
|
|
|
|
12 per cent for |
|
|
|
|
|
ultimate borrowers |
|
|
Above Rs.25,000 and |
|
|
|
|
|
up to Rs.2 lakh |
Do |
Do |
Do |
Do |
Do |
Above Rs.2. lakh |
Do |
Do |
Do |
Do |
Do |
* : The above rate of interest on refinance is effective
from May 14, 2007 and is neutral to the size of loan. |
|
Note:
1. In respect of externally aided projects, the rate as per provisions
contained in the relative agreement /sanction will apply.
2. The rate of interest for refinance is effective in North-Eastern States,
Sikkim and Andaman & Nicobar Islands is 9 per cent for all agencies
with effect from May 28, 2007.
3. The rate of interest on refinance for Micro Finance Institutions (MFIs)
is 3 per cent less than the rate at which commercial banks are financing
them subject to minimum of 9.5 per cent. |
Table IV.45: Number of Kisan Credit Cards |
Issued: Agency-wise and Year-Wise |
(As on March 31, 2007) |
(Numbers in million) |
Year |
Co-operative |
RRBs |
Commercial |
Total |
|
Banks |
|
Banks |
Banks |
1 |
2 |
3 |
4 |
5 |
1998-99 |
0.16 |
0.01 |
0.62 |
0.78 |
1999-00 |
3.60 |
0.17 |
1.37 |
5.13 |
2000-01 |
5.61 |
0.65 |
2.39 |
8.65 |
2001-02 |
5.44 |
0.83 |
3.07 |
9.34 |
2002-03 |
4.58 |
0.96 |
2.70 |
8.24 |
2003-04 |
4.88 |
1.28 |
3.09 |
9.25 |
2004-05 |
3.56 |
1.73 |
4.40 |
9.68 |
2005-06 |
2.60 |
1.25 |
4.17 |
8.01 |
2006-07 |
2.30 |
1.40 |
3.77* |
7.47 |
Total |
32.71 |
8.28 |
25.57 |
66.56 |
Share in |
|
|
|
|
Total (per cent) |
49.1 |
12.4 |
38.4 |
100.0 |
Source : NABARD.
* : Data available upto December 31, 2006. |
4.160 The State -wise progress in implementation of KCC scheme revealed that Andhra Pradesh, Karnataka, Madhya Pradesh, Maharashtra, Orissa, Rajasthan, Tamil Nadu and Uttar Pradesh were forerunners in the implementation of the scheme, accounting for 75 per cent of the total cards issued by banks across the country. The progress was, however, tardy in Goa, Himachal Pradesh, Jammu and Kashmir, Sikkim and the States in North-Eastern Region (Appendix Table IV.12).
4.161 Keeping in view the Central Government’s emphasis on increasing credit flow to the agricultural sector, NABARD advised banks to identify and cover all farmers, including defaulters, oral lessees, tenant farmers and sharecroppers who might have been left outside t he hold of the KCC scheme for any reason as also new farmers so that all farmers are covered under the scheme by March 31, 2007. Further, banks were advised to issue KCCs in a hassle free manner, extend crop loans only through KCCs and renew them so as to ensure ‘quality in operations’.
Recent initiatives by NABARD
4.162 Several initiatives taken by NABARD during 2006-07 are expected to boost the flow of credit to the rural sector (Box IV.5).
Revival of the Rural Co-operative Banking Sector
Recommendations of the Vaidyanathan Committee
4.163 The Task Force on Revival of Rural Cooperative Credit Institutions (Chairman: Prof. A. Vaidyanathan) observed that the co-operative credit structure (CCS) was impaired in governance both on managerial and financial fronts and, hence, needed to be revived and restructured. The main focus of the recommendations of the Task Force was to restore the autonomous character of credit co-operatives by bringing down the control and interference of State Governments through suitable amendments to the State Cooperative Societies Acts and the Banking Regulation Act, 1949. Further, the Task Force recommended provision of required financial assistance for recapitalisation of the Short-term Co-Operative Credit Structure (STCCS) for funding the accumulated losses of the structure, evolving a common accounting system, management information system (MIS), computerisation and human resource development (HRD) initiatives. Financial assistance was recommended to be back ended, subject to the introduction of institutional, legal and regulatory reforms.
4.164 Based on the recommendations of the Task Force, the Central Government finalised a Revival Package encompassing the financial assistance as well as legal and institutional reforms. Financial assistance to the short-term co-operative credit structure would cover cleansing of the balance sheets as on March 31, 2004, support for minimum capital requirements, developing uniform accounting and monitoring systems, capacity building and computerisation. Funding of financial package, estimated at Rs.13,596 crore, will be shared by the Central Government, the State Governments and CCS based on origin of losses and existing commitments.
Revival of Short-term Co-operative Credit Structure (STCCS) - Status
4.165 Seventeen States and one Union Territory have communicated their ‘in principle’ acceptance
Box IV.5: Initiatives by NABARD to Boost Credit to the Rural Sector
During 2006-07, NABARD initiated the following measures to boost credit to the rural sector.
Krishak Saathi Scheme (KSS): Farming community in the country faces several hindrances, the major one being lack of institutional credit. Most of the farmers still do not have access to institutional credit, which is forcing them to borrow money from non-institutional sources, mainly money lenders. In order to help such farmers, some of the banks have come out with niche products such as debt refinance product, which enables the farmers to redeem their outstanding dues to the money lenders, thereby leading to ‘financial inclusion’. To supplement the efforts of banks in this direction, NABARD has made such lendings eligible for its refinance assistance.
Village Development Plan: Most of the villages in the country still face various constraints such as lack of access to safe drinking water, power and roads and other infrastructural facilities. Keeping these in view and also with a view to bringing about holistic and integrated development of villages, NABARD has decided to implement Village Development Programme (VDP), covering five villages in each of the Pilot Project for integrated development (PPID) districts and one village in each of the district development manager (DDM) districts. The focus of the Programme would be on financial inclusion and livelihood security to the village populace. NABARD has also requested the public sector banks to adopt 2-3 villages on similar lines.
Watershed Projects in 31 Distressed Districts: Pursuant to the Prime Minister’s visit to the distressed districts in Vidarbha region of Maharashtra on July 1, 2006 and his announcement of several ameliorative measures, NABARD decided to launch an integrated watershed development intervention combined with livelihood support measures in six affected districts in the Vidarbha region of Maharashtra. The watershed development measures would be taken up in about 15,000 hectares in each of the six distressed districts as a participatory programme for micro level infrastructure development with regard to sustainable management of soil and water resources. Subsequently, it was decided to implement similar programme in 25 distressed districts (16 in Andhra Pradesh, 6 in Karnataka and 3 in Kerala). In all, about 465 micro watersheds, preferably in clusters aggregating 4,65,000 hectares would be developed. The entire fund requirement of about Rs. 300 crore will be provided as grant from the Watershed Development Fund (WDF), maintained by NABARD.
The watershed development interventions would be simultaneously complemented by appropriate agronomic intervention and supplemented with compatible family level livelihood support activities such as agro-horti-silviculture development (Wadi development), animal husbandry, non-farm sector activates, micro finance, especially bank linkage of farmers’ SHGs. Special intervention for landless and women headed families and need based community health and sanitation measures also have been envisaged in the programme.
Projects have already been identified and are under implementation in all the six districts of Maharashtra. Projects aggregating about 80,000 hectares have been identified and are in different stages of implementation in Andhra Pradesh. Almost 75 per cent of the watersheds/ clusters have been identified in Karnataka. Watersheds aggregating about 15,000 hectares have also been identified in Kerala.
To sum up, latest by November 2007, watershed for the targeted area will be identified and implemented. Simultaneously in all the 31 distressed districts, the implementation of the entire programme is expected to be completed within a period of 3-4 years.
These projects are generally implemented in remote villages and on completion, will ensure financial inclusion, a reasonable standard of living for the community in a sustained manner. It is expected that the credit offtake (on an average of Rs. 100 lakh per project), i.e., Rs.465 crore will be effected in all the 465 watershed project villages over a period of 2-3 years, immediately following the project implementation period. to the package, of which thirteen States, viz., Andhra Pradesh, Arunachal Pradesh, Bihar, Chhattisgarh Gujarat, Haryana, Madhya Pradesh, Maharashtra, Rajasthan, Orissa, Uttarakhand, Uttar Pradesh and West Bengal have executed the MoUs with the Central Government and NABARD to implement the package. A National Level Implementing and Monitoring Committee under the chairmanship of Secretary (FS), Ministry of Finance, Government of India was constituted to guide and monitor the implementation of the Revival Package. State Level and DCCB Level Implementing and Monitoring Committees (SLICs and DLICs) have also been set up for the purpose in the implementing States.
4.166 NABARD as the implementing agency devised field tested formats for special audit of PACS to arrive at the exact extent of accumulated losses. It also trained over 800 master trainers who, in turn, trained departmental auditors in the conduct of special audit. Special audit of PACS has been conducted in eleven States, viz., Andhra Pradesh, Bihar, Rajasthan, Maharashtra, Uttar Pradesh, Gujarat, Haryana, Uttarakhand, Orissa, West Bengal and Madhya Pradesh. Recapitalisation assistance has been released to PACS affiliated to 3 DCCBs in Haryana. In conformity with the reform measures envisaged under the Revival Package, the State Governments of Andhra Pradesh and Haryana have brought in amendments to their respective Co-operative Societies Acts. Several other State Governments are in the process of effecting similar amendments. As regards capacity building of staff and board members of PACS, NABARD has developed training materials/trainers guides and has created a pool of 40 State level master trainers who have already started training of grass root trainers for imparting training to PACS staff / office bearers. NABARD has developed and provided guidelines for ‘common accounting system’ for PACS. A Technical Committee under the Chairmanship of Managing Director, NABARD is finalising the technical parameters for developing a software based accounting and monitoring system along with computerisation of PACS.
4.167 Once the package is implemented, it would have several benefits such as (i) financial strengthening, including cleansing of balance sheets of co-operatives; (ii) professionalised boards and management; (iii) autonomy to take business related decisions; (iv) ability to access resources through deposit mobilisation and from institutions outside the co-operative fold; (v) autonomy in matters of personnel policy, staffing, recruitment, posting and compensation to staff; (vi) timely elections and conduct of audit; and (vii) computerised operations with a common accounting system, MIS and better internal checks and controls resulting in operational efficiency.
Task Force on Revival of Long-Term Rural Cooperative Credit Structure
4.168 The Task Force appointed under the Chairmanship of Prof. A.Vaidyanathan, for the revival of Long-Term Co-operative Credit Structure submitted its report to the Government of India in August 2006. The Government is formulating a package of measures in consultation with the State Governments. |