Today, the Reserve Bank released the results of March 2024 round of its bi-monthly consumer confidence survey (CCS)1. The survey collects current perceptions (vis-à-vis a year ago) and one year ahead expectations of households on general economic situation, employment scenario, overall price situation, own income and spending across 19 major cities. The latest round of the survey was conducted during March 2-11, 2024, covering 6,083 respondents. Female respondents accounted for 50.8 per cent of this sample. Highlights: -
Consumer confidence for the current period has been on a path of sustained recovery; respondents assessed improvement in all survey parameters; the current situation index (CSI)2 rose by 3.4 points to 98.5 – its highest level since mid-2019 (Chart 1; Tables 1, 2, 3, 5 and 6). -
Consumer confidence for the year ahead improved further on the back of higher optimism in all CCS parameters; higher optimism resulted in the future expectations index (FEI) rising further by 2.1 points to 125.2 – also its highest level since mid-2019 (Chart 1; Tables 1, 2, 3, 5 and 6). -
Households’ sentiments on general economic situation and employment prospects recorded notable improvements for both the current period as well as the upcoming year; in synchrony, their outlook on discretionary spending improved (Tables 1, 2 and 8). -
Respondents assessed better income situation compared to a year ago and expected further rise in income in the year ahead (Table 5). 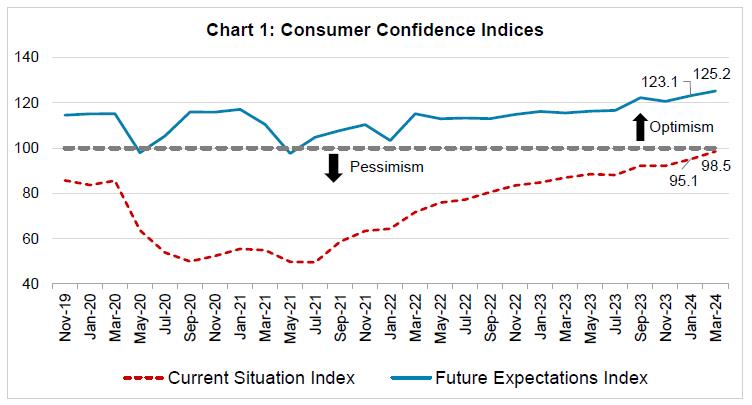 Note: Please see the excel file for time series data.3
| Table 1: Perceptions and Expectations on the General Economic Situation | | (Percentage responses) | | Survey Round | Current Perception | One year ahead Expectation | | Increased | Remained Same | Decreased | Net Response | Will Increase | Will Remain Same | Will Decrease | Net Response | | Mar-23 | 31.4 | 16.9 | 51.7 | -20.4 | 49.9 | 15.1 | 35.0 | 15.0 | | May-23 | 32.1 | 19.0 | 48.9 | -16.8 | 51.0 | 15.8 | 33.2 | 17.8 | | Jul-23 | 30.4 | 18.5 | 51.1 | -20.7 | 51.1 | 15.1 | 33.8 | 17.2 | | Sep-23 | 36.1 | 19.9 | 44.0 | -7.9 | 56.8 | 15.1 | 28.1 | 28.6 | | Nov-23 | 33.1 | 22.5 | 44.4 | -11.3 | 54.3 | 17.2 | 28.5 | 25.7 | | Jan-24 | 37.5 | 22.3 | 40.2 | -2.7 | 59.2 | 15.3 | 25.5 | 33.7 | | Mar-24 | 41.2 | 23.1 | 35.8 | 5.4 | 60.7 | 15.8 | 23.4 | 37.3 |
| Table 2: Perceptions and Expectations on Employment | | (Percentage responses) | | Survey Round | Current Perception | One year ahead Expectation | | Increased | Remained Same | Decreased | Net Response | Will Increase | Will Remain Same | Will Decrease | Net Response | | Mar-23 | 32.2 | 19.9 | 47.9 | -15.7 | 52.9 | 17.1 | 30.1 | 22.8 | | May-23 | 32.1 | 20.2 | 47.7 | -15.6 | 52.1 | 18.7 | 29.2 | 22.9 | | Jul-23 | 30.8 | 21.0 | 48.2 | -17.5 | 51.4 | 18.3 | 30.3 | 21.1 | | Sep-23 | 34.0 | 21.8 | 44.2 | -10.2 | 55.8 | 18.1 | 26.2 | 29.6 | | Nov-23 | 32.3 | 23.0 | 44.7 | -12.4 | 53.6 | 19.7 | 26.8 | 26.9 | | Jan-24 | 35.3 | 23.4 | 41.3 | -6.0 | 58.7 | 17.4 | 24.0 | 34.7 | | Mar-24 | 38.1 | 23.8 | 38.1 | 0.0 | 60.0 | 17.4 | 22.6 | 37.4 |
| Table 3: Perceptions and Expectations on Price Level | | (Percentage responses) | | Survey Round | Current Perception | One year ahead Expectation | | Increased | Remained Same | Decreased | Net Response | Will Increase | Will Remain Same | Will Decrease | Net Response | | Mar-23 | 93.8 | 5.2 | 1.0 | -92.9 | 84.3 | 9.0 | 6.7 | -77.5 | | May-23 | 92.2 | 6.4 | 1.4 | -90.8 | 82.7 | 10.0 | 7.3 | -75.4 | | Jul-23 | 92.7 | 6.0 | 1.3 | -91.4 | 80.9 | 10.2 | 8.9 | -72.0 | | Sep-23 | 91.8 | 6.4 | 1.8 | -90.0 | 78.4 | 9.9 | 11.7 | -66.8 | | Nov-23 | 91.3 | 7.3 | 1.4 | -89.9 | 81.0 | 10.2 | 8.8 | -72.3 | | Jan-24 | 90.8 | 7.2 | 2.0 | -88.9 | 80.5 | 10.4 | 9.1 | -71.4 | | Mar-24 | 89.2 | 9.3 | 1.4 | -87.8 | 78.2 | 12.5 | 9.4 | -68.8 |
| Table 4: Perceptions and Expectations on Rate of Change in Price Level (Inflation)* | | (Percentage responses) | | Survey Round | Current Perception | One year ahead Expectation | | Increased | Remained Same | Decreased | Net Response | Will Increase | Will Remain Same | Will Decrease | Net Response | | Mar-23 | 86.5 | 10.0 | 3.5 | -82.9 | 81.4 | 14.0 | 4.6 | -76.8 | | May-23 | 84.0 | 12.5 | 3.4 | -80.6 | 81.8 | 14.1 | 4.1 | -77.8 | | Jul-23 | 84.5 | 11.8 | 3.7 | -80.8 | 80.8 | 14.8 | 4.4 | -76.4 | | Sep-23 | 82.5 | 13.4 | 4.2 | -78.3 | 79.4 | 15.8 | 4.8 | -74.6 | | Nov-23 | 81.8 | 13.6 | 4.6 | -77.2 | 80.1 | 14.7 | 5.2 | -75.0 | | Jan-24 | 79.5 | 15.7 | 4.8 | -74.7 | 77.2 | 17.8 | 5.0 | -72.2 | | Mar-24 | 77.0 | 17.6 | 5.4 | -71.6 | 76.7 | 18.3 | 5.0 | -71.7 | | *Applicable only for those respondents who felt price has increased/price will increase. |
| Table 5: Perceptions and Expectations on Income | | (Percentage responses) | | Survey Round | Current Perception | One year ahead Expectation | | Increased | Remained Same | Decreased | Net Response | Will Increase | Will Remain Same | Will Decrease | Net Response | | Mar-23 | 22.2 | 49.7 | 28.1 | -5.9 | 54.1 | 38.4 | 7.5 | 46.7 | | May-23 | 23.9 | 49.7 | 26.3 | -2.4 | 53.8 | 39.4 | 6.9 | 46.9 | | Jul-23 | 25.4 | 49.9 | 24.8 | 0.6 | 54.7 | 38.6 | 6.7 | 48.0 | | Sep-23 | 25.0 | 49.8 | 25.2 | -0.3 | 55.7 | 37.8 | 6.5 | 49.2 | | Nov-23 | 27.2 | 50.1 | 22.7 | 4.5 | 57.9 | 36.0 | 6.1 | 51.8 | | Jan-24 | 26.4 | 51.5 | 22.1 | 4.2 | 56.3 | 36.9 | 6.8 | 49.4 | | Mar-24 | 27.7 | 50.6 | 21.7 | 6.0 | 56.7 | 37.2 | 6.1 | 50.5 |
| Table 6: Perceptions and Expectations on Spending | | (Percentage responses) | | Survey Round | Current Perception | One year ahead Expectation | | Increased | Remained Same | Decreased | Net Response | Will Increase | Will Remain Same | Will Decrease | Net Response | | Mar-23 | 75.0 | 19.6 | 5.4 | 69.6 | 75.4 | 19.9 | 4.6 | 70.8 | | May-23 | 73.4 | 21.3 | 5.3 | 68.1 | 73.8 | 21.7 | 4.6 | 69.2 | | Jul-23 | 74.5 | 20.5 | 5.0 | 69.6 | 73.8 | 21.3 | 4.8 | 69.0 | | Sep-23 | 74.6 | 20.2 | 5.2 | 69.4 | 75.2 | 20.3 | 4.6 | 70.6 | | Nov-23 | 74.8 | 20.6 | 4.6 | 70.1 | 75.0 | 21.0 | 4.1 | 70.9 | | Jan-24 | 73.2 | 22.3 | 4.5 | 68.6 | 74.2 | 20.9 | 5.0 | 69.2 | | Mar-24 | 73.1 | 23.1 | 3.8 | 69.2 | 73.9 | 21.7 | 4.3 | 69.6 |
| Table 7: Perceptions and Expectations on Spending- Essential Items | | (Percentage responses) | | Survey Round | Current Perception | One year ahead Expectation | | Increased | Remained Same | Decreased | Net Response | Will Increase | Will Remain Same | Will Decrease | Net Response | | Mar-23 | 85.3 | 11.5 | 3.2 | 82.1 | 81.7 | 14.8 | 3.5 | 78.2 | | May-23 | 84.0 | 12.8 | 3.2 | 80.8 | 81.3 | 15.2 | 3.5 | 77.8 | | Jul-23 | 85.3 | 11.8 | 3.0 | 82.3 | 81.0 | 15.5 | 3.5 | 77.5 | | Sep-23 | 84.9 | 11.9 | 3.2 | 81.7 | 82.0 | 14.4 | 3.6 | 78.4 | | Nov-23 | 85.7 | 11.4 | 2.9 | 82.7 | 82.3 | 14.4 | 3.4 | 78.9 | | Jan-24 | 84.1 | 12.9 | 3.0 | 81.1 | 81.8 | 14.6 | 3.6 | 78.2 | | Mar-24 | 84.5 | 13.0 | 2.5 | 82.0 | 82.5 | 14.5 | 3.0 | 79.5 |
| Table 8: Perceptions and Expectations on Spending- Non-Essential Items | | (Percentage responses) | | Survey Round | Current Perception | One year ahead Expectation | | Increased | Remained Same | Decreased | Net Response | Will Increase | Will Remain Same | Will Decrease | Net Response | | Mar-23 | 25.2 | 34.8 | 40.0 | -14.8 | 34.5 | 36.8 | 28.8 | 5.7 | | May-23 | 25.8 | 38.2 | 36.1 | -10.3 | 35.3 | 37.5 | 27.2 | 8.2 | | Jul-23 | 26.6 | 36.9 | 36.5 | -10.0 | 34.8 | 37.6 | 27.6 | 7.3 | | Sep-23 | 23.4 | 38.5 | 38.2 | -14.8 | 33.0 | 38.2 | 28.8 | 4.2 | | Nov-23 | 25.2 | 36.6 | 38.2 | -13.0 | 34.1 | 36.8 | 29.0 | 5.1 | | Jan-24 | 27.2 | 36.2 | 36.6 | -9.4 | 34.6 | 36.4 | 29.0 | 5.5 | | Mar-24 | 29.2 | 37.6 | 33.2 | -4.1 | 35.7 | 37.6 | 26.7 | 9.0 |
|