1. Introduction 2.1 The Panchayati Raj Institutions (PRIs) are entrusted with planning and implementing various essential services and developmental activities in rural areas. An analysis of their fiscal situation is, however, constrained by the non-availability of consolidated data. This chapter attempts to address this concern by analysing Panchayat finances across 26 States/UTs for 2020-21, 2021-22 and 2022-23. The rest of this chapter is structured into three sections. Section 2 examines fiscal outcomes for the period of reference. Section 3 discusses the financing of Panchayats through grants. Section 4 summarises the key findings. 2. The State of Panchayat Finances 2.2 The Panchayats are constituted in a three-tier structure, i.e., village, intermediate and district level. At the village level, there is a Gram Sabha, consisting of persons registered in the electoral rolls in a village within the Panchayat. The village directly elects the Chairperson of the Panchayat. Currently, there are more than 2.55 lakh village Panchayats in the country (Table II.1). 2.3 In consultation with stakeholders, the Ministry of Panchayati Raj (MoPR) has formulated a simplified format of accounts for PRIs to exercise better accountability and transparency. In this system, the functions of the Panchayats, as enumerated in the 11th Schedule of the Constitution, are represented through a four-digit major code classification (Annex) and a second three-digit minor head classification. | Table II.1: Number of Panchayats | | Sr. No | Units | Number
(As of Dec. 31, 2022) | | 1. | Number of Village Panchayats | 2,55,623 | | 2. | Number of Intermediate Panchayats | 6,697 | | 3. | Number of District Panchayats | 665 | | Source: Annual Report 2022-23, Ministry of Panchayati Raj (MoPR). | 2.4 Panchayats’ information on receipts and payments is provided to the MoPR in this format, and it is accessible to the public through the eGramSwaraj portal. The coverage of the number of village Panchayats reporting the data has improved over time - the number of Panchayats reporting data on the portal during the last three years has averaged 2.43 lakh and 2.36 lakh for revenue receipts and expenditure, respectively, covering more than 90 per cent of total village Panchayats in the country. The number for revenue expenditure is lower due to non-reporting of data by some Panchayats, and the gap has narrowed in recent years. The number of Panchayats reporting data for capital receipts and capital expenditure is less. Hence, the analysis in this Report is mainly restricted to revenue receipts and revenue expenditure. Furthermore, the reporting of data is not consistent across the years, with instances of Panchayats reporting data for only two of the three years or not reporting data for some account heads for all three years. The data were cleaned for such reporting issues, and a balanced panel has been used for the analysis with the same number of village Panchayats across the three years. The data in the balanced panel cover 80.8 per cent and 69.1 per cent of total Panchayats for revenue receipts and expenditure, respectively (Table II.2). | Table II.2: State-wise Number of Village Panchayats in the Balanced Panel | | State/UT | Total No. of Village Panchayats | Revenue Receipts | Revenue Expenditure | | No. of Panchayats | Coverage (%) | No. of Panchayats | Coverage (%) | | Andhra Pradesh | 13325 | 3575 | 26.8 | 3384 | 25.4 | | Assam | 2662 | 1515 | 56.9 | 892 | 33.5 | | Bihar | 8181 | 2613 | 31.9 | 39 | 0.5 | | Chhattisgarh | 11654 | 10886 | 93.4 | 10518 | 90.3 | | Goa | 191 | 102 | 53.4 | 65 | 34.0 | | Gujarat | 14620 | 13474 | 92.2 | 1246 | 8.5 | | Haryana | 6223 | 4252 | 68.3 | 2029 | 32.6 | | Himachal Pradesh | 3615 | 3060 | 84.6 | 2921 | 80.8 | | Jammu And Kashmir | 4291 | 253 | 5.9 | 4142 | 96.5 | | Jharkhand | 4345 | 4243 | 97.7 | 4097 | 94.3 | | Karnataka | 5953 | 4173 | 70.1 | 4165 | 70.0 | | Kerala | 941 | 373 | 39.6 | 705 | 74.9 | | Ladakh | 193 | - | - | 24 | 12.4 | | Madhya Pradesh | 23012 | 21922 | 95.3 | 17868 | 77.6 | | Maharashtra | 27901 | 24679 | 88.5 | 24815 | 88.9 | | Manipur | 3812 | 152 | 4.0 | 135 | 3.5 | | Mizoram | 842 | 361 | 42.9 | - | - | | Odisha | 6794 | 5728 | 84.3 | 5918 | 87.1 | | Punjab | 13241 | 11513 | 86.9 | 5701 | 43.1 | | Rajasthan | 11253 | 8989 | 79.9 | 5508 | 48.9 | | Sikkim | 199 | 165 | 82.9 | 154 | 77.4 | | Tamil Nadu | 12525 | 9159 | 73.1 | 10371 | 82.8 | | Telangana | 12769 | 12280 | 96.2 | 11848 | 92.8 | | Tripura | 1176 | 1172 | 99.7 | 1160 | 98.6 | | Uttar Pradesh | 57709 | 55274 | 95.8 | 52953 | 91.8 | | Uttarakhand | 7795 | 7003 | 89.8 | 6751 | 86.6 | | West Bengal | 3339 | 1932 | 57.9 | 1163 | 34.8 | | Total | 258561 | 208848 | 80.8 | 178572 | 69.1 | Note: -: Data are not available.
Source: MoPR. | 2.5 Depending upon the size and population of the State, the number of Panchayats varies considerably across the States in the dataset. For revenue receipts, the number of Panchayats varies from 102 in Goa to 55,274 in Uttar Pradesh. Furthermore, for a given State, there can be wide variations in the reporting between revenue receipts and revenue expenditure. To address such issues, the analysis and State-wise data presented in this Report pertain to averages per Panchayat level. 2.1 Receipts 2.6 The revenue receipts are dominated by grants-in-aid, with a share of more than 95 per cent of the total receipts (Table II.3). The Panchayats receive grants from both Central and State governments. These grants may be distributed under specific schemes or based on the Central Finance Commission’s (CFC) and State Finance Commissions’ (SFC) recommendations. | Table II.3: Revenue Receipts | | (₹ crore) | | | 2020-21 | 2021-22 | 2022-23 | | Revenue Receipts | 41,744 | 37,971 | 35,354 | | A. Own Tax Revenue | 703 | 786 | 737 | | B. Own Non-Tax Revenue | 1,365 | 1,415 | 1,494 | | C. Grants-in-aid | 39,675 | 35,770 | 33,123 | | (i) Grants from Central Government | 30,264 | 27,060 | 24,699 | | (ii) Grants from State Government | 9,138 | 8,412 | 8,148 | | Average Revenue per Panchayat | | (₹ thousand per Panchayat) | | Revenue Receipts | 2,117 | 2,320 | 2,123 | | A. Own Tax Revenue | 24 | 26 | 21 | | B. Own Non-Tax Revenue | 68 | 72 | 73 | | C. Grants-in-aid | 2,026 | 2,221 | 2,029 | | (i) Grants from Central Government | 1,640 | 1,846 | 1,694 | | (ii) Grants from State Government | 377 | 366 | 327 | Note: Grants-in-aid include grants from Centre, States, and other institutions.
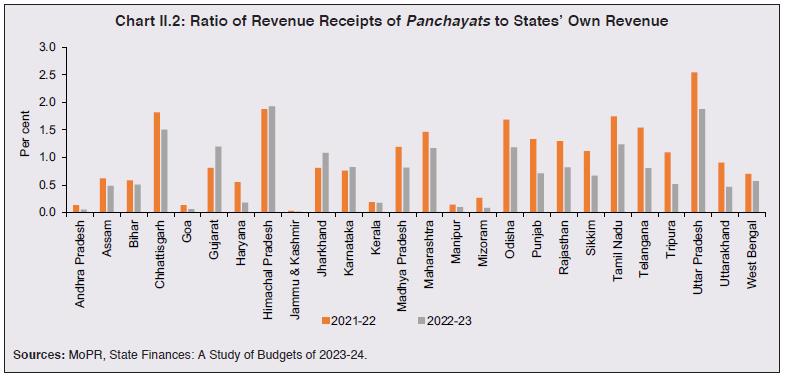
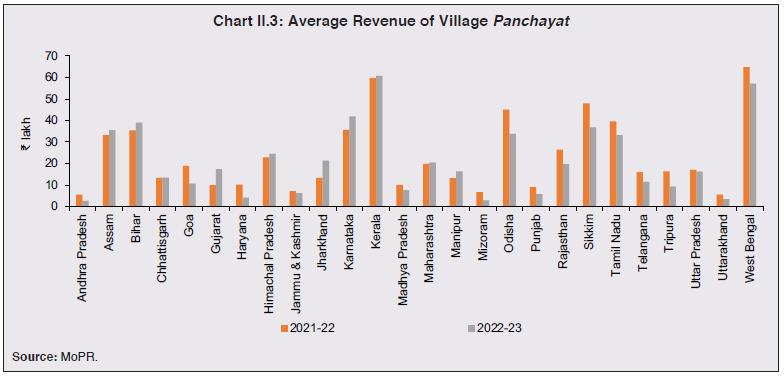
Source: MoPR. | 2.7 The average revenue per Panchayat from all sources - taxes, non-taxes and grants - was ₹21.2 lakh in 2020-21, ₹23.2 lakh in 2021-22 and ₹21.23 lakh in 2022-23. The decline in 2022-23 was owing to lesser devolution of grants. Aggregate revenue receipts appear to vary broadly in line with the States’ populations (Chart II.1). 2.8 The ratio of revenue receipts of the Panchayats to States’ own revenues ranges from 0.1 per cent in Andhra Pradesh to 2.5 per cent in Uttar Pradesh, indicating that their revenues are moderate relative to those of the States (Chart II.2). The average revenue per Panchayat varied from ₹2.7 lakh in Andhra Pradesh to ₹64 lakh in West Bengal (Chart II.3). 2.9 The own revenues of the Panchayats - generated by imposing local taxes, fees, and charges on various activities, including land revenue, professional and trade taxes, and miscellaneous fees – were only 1.1 per cent of their total revenue during the study period (Table II.4). Non-tax revenue - primarily from Panchayati Raj programmes and interest earnings – is also modest, with a share of only 3.3 per cent of their total revenue receipts. Panchayats in Tamil Nadu, Himachal Pradesh, Maharashtra, and Telangana reported higher non-tax revenue than other States (Chart II.4). Maharashtra’s high own non-tax revenue in 2022-23 is attributed to significant receipts under the Panchayati Raj programmes. 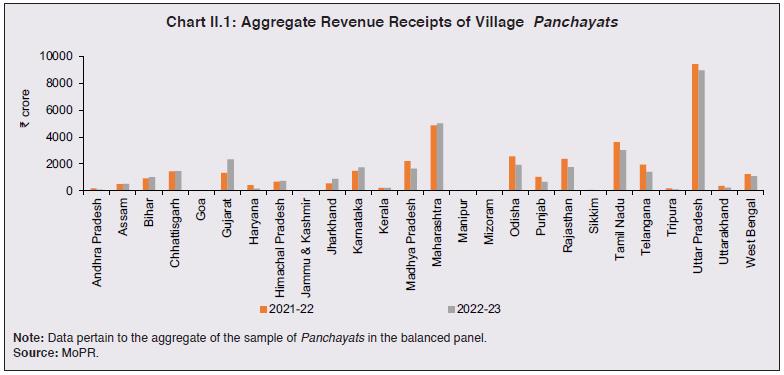
| Table II.4: Panchayat Finances - Key Ratios for 2020-23 | | (Per cent) | | | 2020-21 | 2021-22 | 2022-23 | | Own-Tax Revenue to Total Revenue Receipts | 1.1 | 1.1 | 1.0 | | States’ Grants to Total Revenue Receipts | 17.8 | 15.8 | 15.4 | | Central Government’s Grants to Total Revenue Receipts | 77.5 | 79.6 | 79.8 | | Combined (Centre plus States) Grants to Total Revenue Receipts | 95.7 | 95.7 | 95.5 | | Panchayat’s Revenue Receipts to GDP at Current Prices | 0.21 | 0.16 | 0.13 | | Ratio of Panchayat’s Expenditure to GDP at Current Prices | 0.13 | 0.10 | 0.08 | Note:
1. Ratios are calculated using per Panchayat average estimates.
2. Combined grants include grants from Central, State Governments and other institutions.
Source: MoPR. | 2.2 Expenditure 2.10 The average expenditure per Panchayat decreased from ₹17.3 lakh in 2020-21 to ₹12.5 lakh in 2022-23 (Table II.5) due to higher-than-normal spending in the pandemic year 2020-21. Goa, Karnataka, Odisha, Sikkim, Kerala, and Tamil Nadu recorded the highest average expenditure at the Panchayat level (Chart II.5 and Chart II.6). | Table II.5: Revenue Expenditure | | (₹ crore) | | | 2020-21 | 2021-22 | 2022-23 | | Revenue Expenditure | 24,600 | 21,248 | 20,712 | | Panchayati Raj Programmes | 18,377 | 13,737 | 13,137 | | | (75) | (65) | (63) | | Water Supply and Sanitation | 3,277 | 4,717 | 5,616 | | | (13) | (22) | (27) | | Average Revenue Expenditure | | (₹ thousand per Panchayat) | | Revenue Expenditure | 1,732 | 1,388 | 1,250 | | Panchayati Raj Programmes | 1,400 | 908 | 736 | | | (81) | (65) | (59) | | Water Supply and Sanitation | 168 | 324 | 396 | | | (10) | (23) | (32) | Note: Figures in parentheses indicate share in total revenue expenditure.
Source: MoPR. |
2.11 The ratio of revenue expenditure of Panchayats to nominal GSDP is less than 0.6 per cent for all the States, ranging from 0.001 per cent in Bihar to 0.56 per cent in Odisha (Chart II.7). 2.12 Regarding the composition of expenditure, there has been a consistent rise in spending on water and sanitation during the sample period, mirroring an increased emphasis on cleanliness and access to clean water supply; however, there exist inter-State differences (Chart II.8).
2.13 Investment in capital projects constituted 29.6 per cent of the total expenditure of Panchayats in 2022-23, on average, across States (Chart II.9). 2.14 A significant share of the capital expenditure by PRIs is allocated to Panchayati Raj Programmes, transportation, water supply and sanitation, rural electrification, and rural housing (Chart II.10).
2.15 The revenue to capital expenditure ratio averaged 3.2 in 2022-23, and the ratio varied between 0.1 in Bihar and 11.5 in Tripura (Chart II.11). 3. Grants 2.16 Grants from higher tiers of the government are an overwhelming funding source for the PRIs, empowering them to fulfil their mandated responsibilities and promote development at the grassroots level. Grants are disbursed by the Central Government, based on the recommendations of the Central Finance Commissions (Box II.1) and by the State Governments, based on the recommendations of the State Finance Commissions (Box II.2). They are also allocated through centrally sponsored schemes. The grants come in various forms: Box II.1: Central Finance Commission Grants to RLBs After the 73rd and 74th Constitutional Amendment Acts of 1992, six Central Finance Commissions (CFC-X to CFC-XV) have given their recommendations for devolution of grants to rural local bodies (RLBs) so far and these have continuously increased over time (Table II.1.1). Although the Terms of Reference (ToR) of the Tenth CFC (1995-2000) did not specifically require it to make recommendations for the local bodies, it recommended ad hoc grants of ₹100 per capita for the rural population, totalling ₹4,381 crore for the five-year period under its purview. Areas exempted from the purview of Part IX and IX A of the Indian Constitution1 were also provided these grants. The ToR of all the subsequent CFCs required recommendations for grants to the local bodies. The Eleventh CFC (2000-05) recommended total grants of ₹8,000 crore to the RLBs for the five-year period under its purview, to be distributed among the States based on population, area, distance from the highest per capita income, revenue effort and index of decentralisation. These grants also encompassed a portion designated for regions not covered by the 73rd Amendment Act. This portion was to be allocated to the respective States once they had successfully enacted the necessary legislation for extending the provisions of the Act to the excluded areas. The initial allocation of funds from the grants was to be dedicated to activities such as maintaining accounts and databases. Thereafter, the grants were to be utilised for the provision of core civic services. The Twelfth CFC (2005-10) recommended total grants of ₹20,000 crore to the RLBs for its award period. While continuing with the horizontal devolution criteria of the Eleventh CFC, it stressed on priority to expenditures on operation and maintenance costs of water supply and sanitation in its recommendations. It did not indicate separate grants for normal and excluded areas, leaving the allocation to the States. The grants recommended by the Thirteenth CFC (2010-15) were expressed as a proportion of the divisible pool. The grants had two components: (i) general basic grant of ₹41,226 crore available to all the RLBs for the five-year period; and (ii) general performance-based grants totalling ₹21,827 crore accessible only upon fulfilling the conditions related to establishing local body audit systems, budget databases and independent ombudsman systems at the local level. The Commission also recommended ₹1,357 crore as grants for areas excluded from the operation of 73rd Amendment Act. The Fourteenth CFC (2015-20) recommended total rural local grants of ₹2.0 lakh crore for the five-year period under its purview. 10 per cent of these grants were performance grants linked to (i) providing audited accounts and (ii) demonstration of an enhancement in self-generated revenues. No grants were recommended for the excluded areas. Further, the Commission gave recommendations for strengthening SFCs and augmenting resources at the State and local levels. The Fifteenth CFC (2021-26) recommended a fixed amount of ₹2.4 lakh crore for the RLBs for the five-year period under its purview. These grants were also meant for the areas outside the purview of the 73rd Amendment Act. 60 per cent of these grants were tied exclusively for water and sanitation-related areas. The Commission specified the online availability of audited accounts as a prerequisite to avail any grant. To ensure the timely transfer of funds to the local bodies, the Commission mandated the release of local body grants by the State governments within ten working days of the receipt of such grants from the Central Government, with a specific interest rate to be paid for any delay beyond the said period. The actual funds disbursed to the PRIs have been about 5-18 per cent lower than the amounts recommended by the CFCs (Table II.1.1). This was primarily due to the local bodies’ failure to meet the conditions attached to the performance grants. | Table II.1.1: Central Finance Commission Grants to RLBs | | Central Finance Commission | Quantum of Grants
(₹ crore) | Type of Disbursement | Conditions linked with Grants
(if any) | Gap in Disbursement
(Per cent) | | X (1995-2000) | 4,381 | Absolute | Grants should not be used for giving salaries and wages | 18.4 | | XI (2000-05) | 8,000 | Absolute | 1. Maintenance of accounts to be the first charge. | 17.5 | | | | | 2. Provision of civic services | | | XII (2005-10) | 20,000 | Absolute | Priority to water supply and sanitation | 5.4 | | XIII (2010-15) | 64,408 | Proportional of the divisible pool | Performance grants linked to maintaining accounts and audit systems | 9.3 | | XIV (2015-20) | 2,00,292 | Absolute | Performance grants linked to budget database and improvement in own revenues | 10.4 | | XV (2021-26) | 2,36,805 | Absolute | 1. Online availability of audited accounts as a precondition to avail grants | - | | | | | 2. 60 per cent grants tied to be spent on water and sanitation | | Notes: 1. Proportional grants are expressed as per cent of the divisible pool of taxes (over and above the share of the States); while absolute grants are expressed as fixed sum. For CFC-XIII: allocation recommended was based on actual divisible pool realised.
2. Gap in disbursement is calculated using figures on grants released as a percentage of recommended grants, from the XV CFC Report.
Source: Central Finance Commission Reports. | References: “Central Finance Commission Reports”, Central Finance Commissions. Ministry of Panchayati Raj (2020), “Utilisation and Impact Evaluation of 14th Finance Commission Grants to Gram Panchayats in Selected Indian States”.
_______________________________________ |
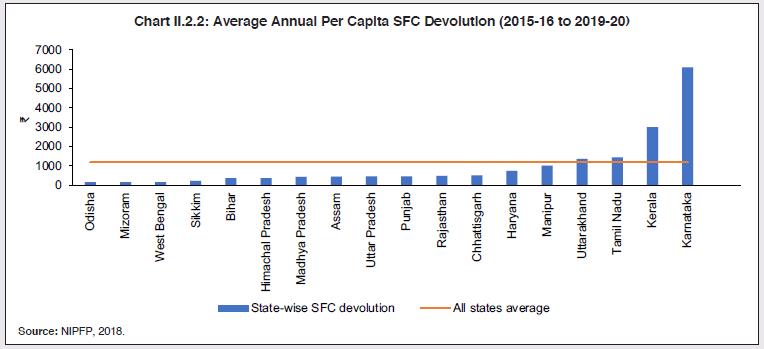
Box II.2: State Finance Commission Grants to Local Bodies Article 243-I of the Indian Constitution stipulates the establishment of State Finance Commissions (SFCs) for recommending tax sharing between the State and the Panchayats. The initial SFC was to be constituted within one year of the enactment of the Constitution (73rd Amendment) Act in 1992. Subsequently, new SFCs were to be formed every five years. While the setting up of the sixth SFC was scheduled for all the States in 2019-20, its constitution has not been uniform and timely across States (Chart II.2.1). As per the Fifteenth CFC Report, only 4 States, namely Assam, Bihar, Punjab and Rajasthan, had established their 6th SFCs, and another 11 States had constituted their 5th SFC till then. According to MoPR, only 9 States have constituted their 6th SFC by 2022. Keeping in view the importance of SFC grants for the local bodies, the Fifteenth CFC recommended that the compliance to constitutional provisions in respect of SFC will be a necessary condition for disbursement of grants to local bodies for 2024-25 and 2025-26. The composition of the divisible pool of resources for determining the vertical devolution of funds between the State and the local governments has varied across States and Commissions. Some SFCs have recommended grants as a portion of own tax revenues of the State, while others have devolved a share of own revenues (i.e., own tax and own non-tax revenues) to the local bodies. Additionally, some SFCs have recommended devolution based on the State’s total revenue, including the State’s share in Central transfers. The average annual per capita SFC grants for all the States taken together increased from ₹599 during 2010-14 to ₹1,180 during 2015-19. Bihar, Sikkim, Haryana, Assam, Kerala, Uttarakhand, and Himachal Pradesh accounted for the highest increase in SFC grants (Table II.2.1). 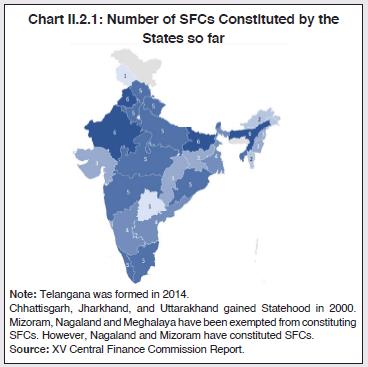 For the 2015-19 period, Odisha, West Bengal and Mizoram had the lowest average annual per capita SFC devolutions while they were above the national average for Kerala and Karnataka (Chart II.2.2). States define the composition of SFC grants differently, and some States include Central transfers in their grants. While SFC grants have co-moved with CFC grants (Chart II.2.3), the per capita grants recommended by the SFCs, averaged over the 22 States mentioned in Table II.2.1 have been consistently higher than the grants recommended by the CFCs (Chart II.2.4). Although CFC grants increased from 14.3 per cent of the SFC grants (of selected States) in 2010-11 to 44.2 per cent in 2019-20, SFC grants remain a vital source of funds for the local bodies. | Table II.2.1: Average Annual Per Capita SFC Grants | | (in ₹) | | State | 2010-14 | 2015-19 | Per cent change | | Odisha | 209.4 | 146.7 | -29.9 | | West Bengal | 111.5 | 152.3 | 36.5 | | Uttar Pradesh | 315.5 | 449.5 | 42.4 | | Manipur | 697.0 | 1,002.7 | 43.8 | | Tamil Nadu | 902.5 | 1,426.2 | 58.0 | | Punjab | 287.6 | 456.5 | 58.7 | | Rajasthan | 291.6 | 471.9 | 61.7 | | Chhattisgarh | 307.3 | 504.0 | 63.9 | | Karnataka | 3,212.2 | 6,090.0 | 89.5 | | Himachal Pradesh | 182.3 | 367.1 | 101.3 | | Uttarakhand | 644.7 | 1,361.2 | 111.1 | | Kerala | 1,405.4 | 2,999.7 | 113.4 | | Assam | 168.2 | 431.0 | 156.2 | | Haryana | 250.4 | 737.8 | 194.6 | | Sikkim | 47.5 | 212.4 | 347.2 | | Bihar | 61.6 | 356.7 | 478.5 | | Andhra Pradesh | 421.4 | NA | - | | Gujarat | 433.5 | NA | - | | Madhya Pradesh | NA | 421.5 | - | | Maharashtra | 1,087.9 | NA | - | | Mizoram | NA | 149.1 | - | | Tripura | 152.6 | NA | - | | All States Average | 599.0 | 1,179.6 | 96.9 | | Source: NIPFP, 2018. |
 Apart from the assignment of State taxes to local bodies, there has been a wide variety of grants recommended by the SFCs. They include grants for the maintenance of assets (recommended by the SFCs of Andhra Pradesh, Gujarat, Madhya Pradesh, Odisha, and Tamil Nadu). Some SFCs like in Assam, Chhattisgarh, Haryana and Gujarat have recommended lump sum grants, ad hoc grants, specific needs grants, one-time grants, and special purpose grants. SFCs in Karnataka and Rajasthan recommended untied grants. Performance grants were recommended by the SFCs of Chhattisgarh, Karnataka, Maharashtra, Odisha, Punjab, Rajasthan, and West Bengal in order to incentivise revenue collection by the local bodies.
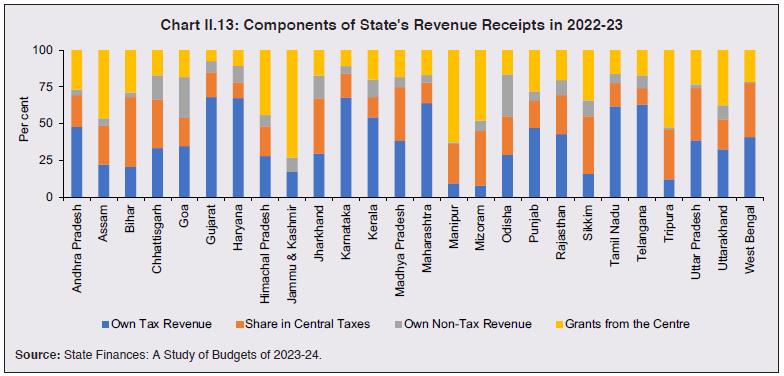
References: Chakraborty, P., Gupta, M., & Singh, R. K. (2018), Overview of State Finance Commission Reports, National Institute of Public Finance and Policy, New Delhi. 15th Central Finance Commission Report, 2020. | • Untied Grants: also known as general-purpose grants, these are provided without specific conditions or restrictions and they can be utilised by PRIs on the basis of local priorities and needs. • Tied Grants: earmarked for specific purposes or sectors, such as sanitation, education, healthcare, or infrastructure development, these grants ensure that funds are directed towards the targeted areas of development as determined by higher levels of government. • Performance-based Grants: based on the recommendations of some CFCs to link grants to specific performance criteria, PRIs that demonstrate effective governance, financial management, and successful implementation of development projects may receive additional funds as incentives for their performance. • Special Category Grants: these grants are designed to address unique challenges or particular needs of PRIs in specific regions or contexts and provide additional financial support to regions facing particular socio-economic or geographical constraints. 2.17 At the Panchayat level, grants are the principal revenue source, with a share of over 95 per cent on average across States (Chart II.12). This is in contrast with the composition of States’ revenue receipts - own tax and non-tax revenue comprise more than 50 per cent of the total revenue receipts for most States (Chart II.13). In a few States such as Andhra Pradesh, Haryana, Himachal Pradesh, Maharashtra, Tamil Nadu, and Telangana, Panchayats have managed to generate relatively higher own revenues. The grants help to reduce horizontal disparities among the Panchayats (Box II.3). 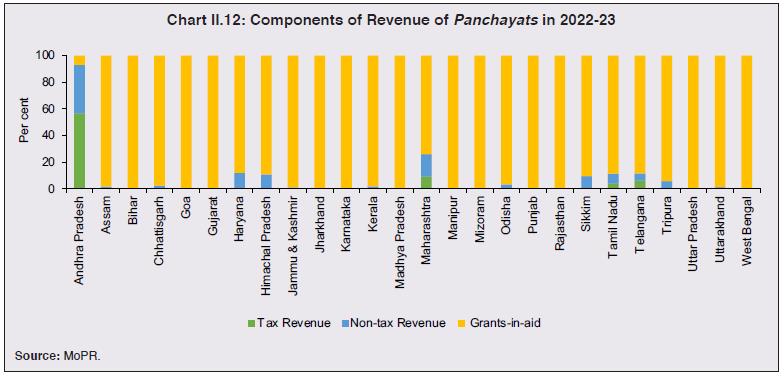
Box II.3: Grants-in-Aid and Horizontal Disparities There are notable differences in the distribution of grants-in-aid to PRIs across States and years (Charts II.3.1a and 1b). The intra-State disparity in the distribution of grants-in-aid is low in Kerala and West Bengal and high in Andhra Pradesh, Haryana, and Jammu and Kashmir. To assess the relationship between grants and horizontal disparities, the deviations of each Panchayat’s revenue (excluding grants) from the respective State-wise mean revenues (excluding grants) are divided into negative and positive deviations. A fixed effects regression is then estimated on grants-in-aid received by the PRI to the ‘deviation from mean’ variable as defined above. The regression results indicate that the Panchayats with lower own revenues than the mean revenue (i.e., Deviation<0) get more grants, on average. On the other hand, no significant association is found between the deviation from mean revenue and grants-in-aid if the revenues are higher than the mean revenue. These results suggest that grants-in-aid mitigate horizontal disparities among the Panchayats (Table II.3.1). | Table II.3.1: Grants-in-Aid and Panchayat Revenues | | | Grants | Grants | | | Deviation<0 | Deviation>0 | | Deviation from Mean | 0.632*** | 0.0349 | | | (3.820) | (0.820) | | Deviation Squared | -0.000*** | 0.000 | | | (-7.08) | (0.540) | | Constant | 1811027.1*** | 2792390.5*** | | | (62.84) | (111.13) | | N | 36798 | 16605 | | adj. R-sq | 0.628 | 0.899 | | Source: RBI staff estimates. |
| 4. Conclusion 2.18 An analysis of the financial situation of Panchayats for the period 2020-21 to 2022-23 reveals that nearly all of their revenues are through grants from higher levels of government, underscoring their heavy reliance on the Central and State governments for financial resources. On the expenditure side, there is a discernible upward shift in investment in water supply and sanitation, with the most allocations to the Panchayati Raj Programme. It would be prudent for the Panchayats to reduce their heavy dependence on grants by deploying the tax and non-tax instruments available to them to raise resources. This would help them to improve the quality of their services in rural areas and strengthen the rural economy.
Annex Data and Methodology In the streamlined classification system under the Model Accounting System, the initial four-digit categorisation pertains to the primary category denoting functions outlined in the 11th Schedule of the Constitution. The subsequent three-digit classification designates the sub-category indicative of the program or unit of expenditure. All the 29 functions listed in the Eleventh Schedule of the Constitution are subsumed under 23 distinct major heads. | Table A.1: Account Structure of Panchayats | | Sr. No. | Revenue Receipts | Major Code | Sr. No. | Revenue Expenditure | Major Code | | I. | Own Tax Revenue | | 1 | Agriculture including Agriculture Extension | 2435 | | 1 | Taxes on Profession Trades etc. | 0028 | 2 | Animal Husbandry Dairying Poultry and Fuel and Fodder | 2403 | | 2 | Land Revenue | 0029 | 3 | Art Culture and Libraries | 2205 | | 3 | Stamps and Registration Fees | 0030 | 4 | Education | 2202 | | 4 | Taxes on Property other than Agri. Land | 0035 | 5 | Fisheries | 2405 | | 5 | Taxes on Vehicles | 0041 | 6 | Forestry | 2406 | | 6 | Taxes on Goods and Passengers | 0042 | 7 | Health and Family Welfare | 2210 | | 7 | Service Tax | 0044 | 8 | Interest Payments | 2049 | | 8 | Taxes on Duties and Commodities | 0045 | 9 | Maintenance of Community Assets | 2059 | | II. | Own Non-Tax Revenue | | 10 | Market and Fairs | 2206 | | 1 | Interest Receipts | 0049 | 11 | Minor Irrigation | 2702 | | 2 | Maintenance of Community Assets | 0059 | 12 | Non-Conventional Sources of Energy | 2810 | | 3 | Education | 0202 | 13 | Panchayati Raj Programmes (i-iv) | 2515 | | 4 | Market and Fairs | 0206 | | (i) District Panchayat Programmes | 2515-101 | | 5 | Health and Family Welfare | 0210 | | (ii) Gram Panchayat Programmes | 2515-103 | | 6 | Water Supply and Sanitation | 0215 | | (iii) Other Expenditure | 2515-800 | | 7 | Rural Housing | 0216 | | (iv) Panchayat Samiti Programmes | 2515-102 | | 8 | Animal Husbandry Dairying Poultry and Fuel and Fodder | 0403 | 14 | Pension and Other Retirement Benefits | 2071 | | 9 | Fisheries | 0405 | 15 | Poverty Alleviation Programme | 2501 | | 10 | Forestry | 0406 | 16 | Public Distribution System | 2408 | | 11 | Agriculture including Agriculture Extension | 0435 | 17 | Rural Electrification | 2801 | | 11 | Panchayati Raj Programmes | 0515 | 18 | Rural Housing | 2216 | | 13 | Minor Irrigation | 0702 | 19 | Social Security and Welfare | 2235 | | 14 | Rural Electrification | 0801 | 20 | Soil and Water Conservation | 2402 | | 15 | Village and Small Scale Industries | 0851 | 21 | Technical Training and Vocational Education | 2203 | | III | Grants-in-aid | 1601 | 22 | Transportation | 3054 | | 1 | Grants from Central Government | 1601-101 | 23 | Village and Small Scale Industries | 2851 | | 2 | Grants from other Institutions | 1601-102 | 24 | Water Supply and Sanitation (i-vi) | 2215 | | 3 | Grants from State Government | 1601-103 | | (i) Maintenance and Repair of Tube-wells | 2215-102 | | | | | | (ii) Maintenance of Water Supply line | 2215-101 | | | | | | (iii) Other Expenditure | 2215-800 | | | | | | (iv) Sewage and Solid Waste Management | 2215-104 | | | | | | (v) Sewerage and Sanitation | 2215-103 | | | | | | (vi) Storm water drainage | 2215-105 | | | | | 25 | Welfare of Scheduled Castes, Scheduled Tribes and Other weaker sections | 2225 | | | | | 26 | Women and Child Welfare | 2211 | | Source: eGramSwaraj, MoPR. | Data Collection To ensure consistency and uniformity in the dataset, a structured data template was designed, based on the codified accounting structure for Panchayats (Table A.1). This template encompassed both Major and Minor Account Codes, effectively encapsulating the full breadth of financial transactions. The template was shared with the MoPR, and the data received (Table A.2) were subjected to consistency checks to arrive at a balanced panel. | Table A.2: Coverage of Village Panchayats | | | Revenue Receipts | Revenue Expenditure | Capital Receipts | Capital Expenditure | | 2020-21 | 240810 | 229936 | 3298 | 93244 | | 2021-22 | 249077 | 240710 | 2909 | 93482 | | 2022-23 | 240895 | 238039 | 2611 | 83194 | | Average | 243594 | 236228 | 2939 | 89973 | | Share (%) | 95.3 | 92.4 | 1.1 | 35.2 | | Source: MoPR. | |