Urban co-operative banks (UCBs) expanded their combined balance sheet in 2022-23, driven by loans and advances, along with a strengthening of asset quality. For state co-operative banks (StCBs) and district central co-operative banks (DCCBs), growth in loans and advances was accompanied by robust profitability and soundness indicators in 2021-22. 1. Introduction V.1 Co-operative banks play an important role in the Indian financial system, leveraging on their wide network, especially in rural areas. Concerted efforts by the government and the Reserve Bank led to improvements in the regulatory architecture and greater freedom to raise capital even as reforms in deposit insurance facilitated a restoration of depositor confidence in these banks. During the year under review, calibrated efforts were made to bring the regulation of the co-operative banking sector1 at par with other regulated entities (REs), including the prudential framework for stressed assets. REs within the co-operative banking sector were allowed to enter into outsourcing arrangements with lending service providers (LSPs) and digital lending platforms to imbue more flexibility into their business operations. V.2 Against this background, the rest of the chapter analyses the performance of urban and rural co-operative banks during 2022-23 and 2021-22, respectively2. Section 2 discusses the evolving structure of the co-operative banking sector. Section 3 evaluates the business and financial performance of UCBs in 2022-23, while Section 4 examines the financial performance of short-term and long-term rural co-operatives. Section 5 concludes the chapter with an overall assessment. 2. Structure of the Co-operative Banking Sector V.3 Credit co-operatives, comprising urban co-operative banks (UCBs) and rural co-operative credit institutions, trace their history to pre-independence India. They were formed to meet the developmental aspirations of the economy through extension of formal financial services to villages and small towns in India. UCBs are classified as scheduled or non-scheduled, based on whether they are included in the second schedule of the Reserve Bank of India Act, 19343, and their geographical outreach (single-state or multi-state). Rural credit co-operatives (RCCs) are classified into short-term and long-term institutions. As per latest data available, there were 1,502 UCBs and 1,05,268 RCCs. More than 97 per cent of RCCs are primary agricultural credit societies (PACS) (Chart V.1). V.4 The consolidated assets of the co-operative banking sector at end-March 2022 were ₹21.6 lakh crore, around 10 per cent of that of scheduled commercial banks (SCBs). Rural co-operatives comprise more than two-thirds of the sector (Chart V.2).
V.5 Grassroot lending has been the niche of the co-operative banking sector. Increasingly, however, as other financial institutions, including SCBs and non-banking financial institutions (NBFIs), leverage technology to serve the same clientele, RCCs face formidable competition. Their share in direct credit flow to agriculture has been declining over the years (Table V.1). | Table V.1: Share in Credit Flow to Agriculture | | (Per cent) | | | Rural Credit Co-operatives | Regional Rural Banks | Commercial Banks | | 1 | 2 | 3 | 4 | | 2016-17 | 13.4 | 11.6 | 75.0 | | 2017-18 | 12.9 | 12.1 | 74.9 | | 2018-19 | 12.1 | 11.9 | 76.0 | | 2019-20 | 11.3 | 11.9 | 76.8 | | 2020-21 | 12.1 | 12.1 | 75.8 | | 2021-22 | 13.0 | 11.0 | 76.0 | | 2022-23 | 11.0 | 11.2 | 77.8 | | Source: Data submitted by banks on ENSURE portal of NABARD. | 3. Urban Co-operative Banks V.6 The liberal licensing policy adopted in the 1990s resulted in the mushrooming of a large number of UCBs. Nearly a third of the newly licensed banks subsequently turned financially unsound4. Starting 2004-05, the Reserve Bank initiated a process of consolidation, including mergers of unviable UCBs with viable counterparts, cancelling licences of non-viable entities and suspension of new licence issuances. As a result, the number of UCBs declined steadily between March 2004 and March 2023 (Chart V.3). V.7 Cumulatively, the UCB sector has undergone 150 mergers since 2004-05, including 3 in 2022-23. Maharashtra and Gujarat accounted for 80 per cent of the total mergers (Chart V.4a). Licence cancellations have also been high during this period, with the total number of cancellations being 46 since 2015-16. Most of the mergers and cancellations took place in the non-scheduled category (Chart V.4b). 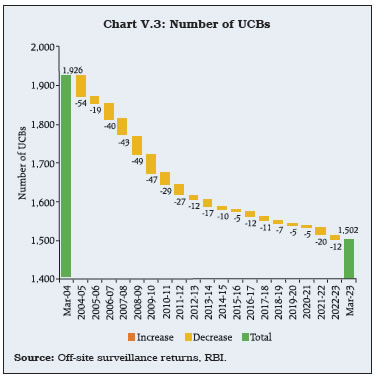 V.8 During 2022-23, the Reserve Bank adopted a four-tiered regulatory framework for UCBs in line with the recommendations of the Expert Committee on Urban Co-operative Banks (Chairman: Shri. N. S. Vishwanathan, August 2021). UCBs with deposits up to ₹100 crore have been classified as Tier 1; those with more than ₹100 crore and up to ₹1,000 crore as Tier 2; those with deposits more than ₹1,000 crore and up to ₹10,000 crore as Tier 3, and those above ₹10,000 crore are placed in Tier 4. At end-March 2023, an overwhelming majority of UCBs were in the Tier 1 category. Six UCBs residing in Tier 4 contributed more than a fifth of the sector’s deposits (Table V.2). 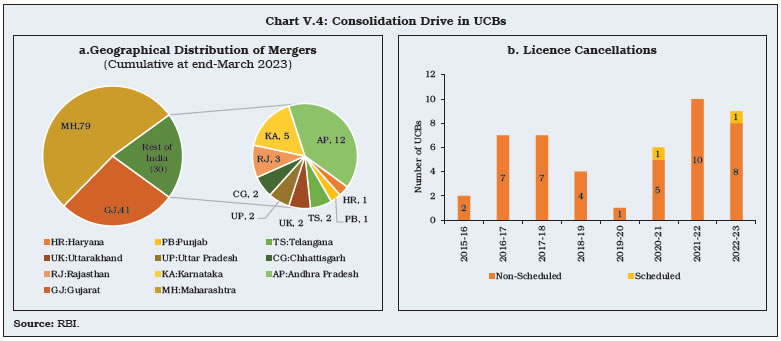
| Table V.2: Tier-wise Distribution of Urban Co-operative Banks | | (At end-March 2023) | | (Amount in ₹ crore) | | Tier Type | No. of Banks | Deposits | Advances | Total Assets | | Number | Percentage | Amount | Percentage | Amount | Percentage | Amount | Percentage | | 1 | 2 | 3 | 4 | 5 | 6 | 7 | 8 | 9 | | 1 | 898 | 59.8 | 67,130 | 12.6 | 42,652 | 12.9 | 89,579 | 13.2 | | 2 | 520 | 34.6 | 1,62,180 | 30.4 | 95,916 | 29.0 | 2,04,966 | 30.1 | | 3 | 78 | 5.2 | 1,86,761 | 35.0 | 1,12,853 | 34.2 | 2,35,356 | 34.6 | | 4 | 6 | 0.4 | 1,17,184 | 22.0 | 78,904 | 23.9 | 1,50,399 | 22.1 | | All UCBs | 1,502 | 100.0 | 5,33,255 | 100.0 | 3,30,325 | 100.0 | 6,80,301 | 100.0 | Notes: 1. Data are provisional.
2. The list of tier-wise UCBs is prepared based on the deposits of UCBs as on March 31, 2022, as per the “Revised Regulatory Framework for Categorisation of Urban Co-operative Banks'; dated December 1, 2022.
Source: Off-site surveillance returns, RBI. | 3.1. Balance Sheet V.9 Following the consolidation drive in 2004-05, UCBs’ assets registered double digit compound annual growth (CAGR) over the following decade. Since then, their growth has moderated, trailing that of SCBs. As a result, the balance sheet size of UCBs fell to a decadal low of 2.8 per cent of that of SCBs at end-March 2023. Within the sector, growth in assets of non-scheduled urban co-operative banks (NSUCBs) decelerated for the second consecutive year, while scheduled urban co-operative banks’ (SUCBs’) balance sheet expansion picked up (Chart V.5). V.10 The expansion in the consolidated balance sheet of all UCBs during 2022-23 was attributable to net worth (capital plus reserves) and deposits on the liabilities side, and loans and advances on the assets side. Higher profits during the year were ploughed back into reserves to comply with enhanced regulatory requirements for net worth. Cash and bank balances were drawn down to fund credit and investment expansion (Table V.3). V.11 Reversing the contraction in 2021-22, UCBs’ deposit growth – especially that of SUCBs – rebounded in 2022-23 (Chart V.6a). Although the revival was sustained during Q1:2023-24 with 1.8 per cent growth in their deposits, it was much slower than SCBs. The low deposit accretion over the years has altered the funding structure of UCBs, with the share of deposits falling from 82 per cent of their total liabilities at end-March 2017 to 78.4 per cent at end-March 2023. 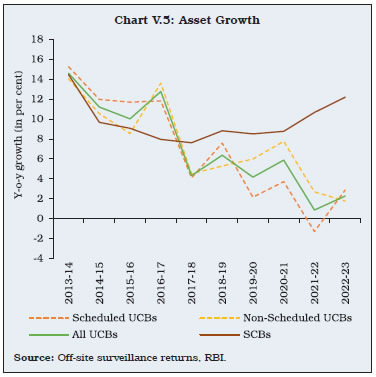
| Table V.3: Balance Sheet of Urban Co-operative Banks | | (At end-March) | | (Amount in ₹ crore) | | | Scheduled UCBs | Non-Scheduled UCBs | All UCBs | All UCBs Growth (%) | | 2022 | 2023 | 2022 | 2023 | 2022 | 2023 | 2021-22 | 2022-23 | | 1 | 2 | 3 | 4 | 5 | 6 | 7 | 8 | 9 | | Liabilities | | | | | | | | | | 1) Capital | 4,193 | 4,256 | 10,063 | 10,447 | 14,255 | 14,703 | -0.4 | 3.1 | | | (1.4) | (1.4) | (2.7) | (2.8) | (2.1) | (2.2) | | | | 2) Reserves and Surplus | 19,414 | 22,289 | 23,384 | 25,966 | 42,798 | 48,255 | 11.5 | 12.7 | | | (6.5) | (7.3) | (6.4) | (6.9) | (6.4) | (7.1) | | | | 3) Deposits | 2,34,080 | 2,39,982 | 2,91,270 | 2,93,273 | 5,25,351 | 5,33,255 | -0.7 | 1.5 | | | (78.5) | (78.3) | (79.3) | (78.5) | (79.0) | (78.4) | | | | 4) Borrowings | 5,418 | 5,776 | 243 | 464 | 5,661 | 6,240 | 11.2 | 10.2 | | | (1.8) | (1.9) | (0.1) | (0.1) | (0.9) | (0.9) | | | | 5) Other Liabilities and Provisions | 34,920 | 34,281 | 42,228 | 43,568 | 77,148 | 77,848 | 4.6 | 0.9 | | | (11.7) | (11.2) | (11.5) | (11.7) | (11.6) | (11.4) | | | | Assets | | | | | | | | | | 1) Cash in Hand | 1,855 | 1,660 | 4,429 | 4,222 | 6,284 | 5,882 | 6.4 | -6.4 | | | (0.6) | (0.5) | (1.2) | (1.1) | (0.9) | (0.9) | | | | 2) Balances with RBI | 12,414 | 12,770 | 4,018 | 3,593 | 16,432 | 16,363 | 13.2 | -0.4 | | | (4.2) | (4.2) | (1.1) | (1.0) | (2.5) | (2.4) | | | | 3) Balances with Banks | 23,137 | 21,011 | 47,021 | 45,591 | 70,157 | 66,603 | 0.1 | -5.1 | | | (7.8) | (6.9) | (12.8) | (12.2) | (10.5) | (9.8) | | | | 4) Money at Call and Short Notice | 3,505 | 2,554 | 1,486 | 1,064 | 4,991 | 3,618 | -28.7 | -27.5 | | | (1.2) | (0.8) | (0.4) | (0.3) | (0.8) | (0.5) | | | | 5) Investments | 81,151 | 83,254 | 1,06,460 | 1,07,373 | 1,87,610 | 1,90,627 | 3.6 | 1.6 | | | (27.2) | (27.2) | (29.0) | (28.7) | (28.2) | (28.0) | | | | 6) Loans and Advances | 1,42,625 | 1,51,663 | 1,72,047 | 1,78,662 | 3,14,673 | 3,30,325 | 0.2 | 5.0 | | | (47.9) | (49.5) | (46.9) | (47.8) | (47.3) | (48.6) | | | | 7) Other Assets | 33,339 | 33,670 | 31,727 | 33,213 | 65,066 | 66,884 | -4.7 | 2.8 | | | (11.2) | (11.0) | (8.6) | (8.9) | (9.8) | (9.8) | | | | Total Liabilities/ Assets | 2,98,025 | 3,06,583 | 3,67,188 | 3,73,718 | 6,65,213 | 6,80,301 | 0.7 | 2.3 | | | (100.0) | (100.0) | (100.0) | (100.0) | (100.0) | (100.0) | | | Notes: 1. Data for 2023 are provisional.
2. Figures in parentheses are proportions to total liabilities / assets (in per cent).
Source: Off-site surveillance returns, RBI. |
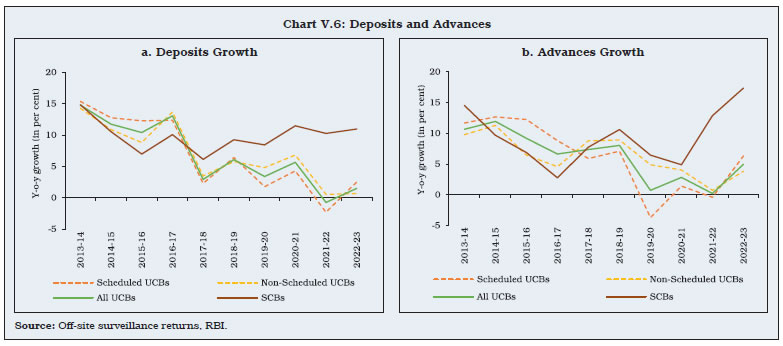
Box V.1: Deceleration in Co-operative Bank Credit Determinants of SUCBs’ credit growth are analysed in an autoregressive distributed lag (ARDL) regression framework for the period 2013 to 20225. Explanatory variables include bank specific factors such as the gross non-performing assets (GNPA) ratio and return on assets (RoA). Index of industrial production (IIP) growth has been included as a control variable. The results suggest that the deterioration in SUCBs’ asset quality, as indicated by the GNPA ratio, has an adverse impact on their credit growth (Eq. 1). Although profitability has a positive impact on credit growth, the role of this channel is subdued during the period under consideration. Overall, the credit deceleration in SUCBs in the recent decade appears to have been due to their own financial weaknesses. References Awdeh, A. (2017), “The Determinants of Credit Growth in Lebanon”, International Business Research, 10(2). Rabab’ah, M. (2015), “Factors Affecting the Bank Credit: An Empirical Study on the Jordanian Commerical Banks”, International Journal of Economics and Finance, 7(5). | V.12 The growth of advances of UCBs during 2022-23 was the highest in 4 years (Chart V.6b). During Q1:2023-24, it accelerated further to 5.9 per cent, but remained lower than that of SCBs. In the case of SUCBs, financial constraints such as elevated NPA ratios and low profitability may have led to this sustained deceleration over more than a decade (Box V.1). V.13 The credit-deposit (C-D) ratio of UCBs rose for the third consecutive year in 2022-23. It, however, remained below that of SCBs and the wedge has been widening (Chart V.7). V.14 The distribution of the number of UCBs in terms of assets and deposits has been shifting rightwards over the years. At end-March 2016, the modal class of deposits was ₹25 crore to ₹50 crore, which had moved upwards to ₹100 crore to ₹250 crore by end-March 2023. For advances, the distribution was bimodal at end-March 2022 with ₹10 to ₹25 crore and ₹25 to ₹50 crore buckets as modes. At end-March 2023, however, the advances’ modal class gravitated towards the ₹25 to ₹50 crore bucket. More than two-thirds of UCBs’ advances are concentrated in the smaller range of less than ₹100 crore (Table V.4). 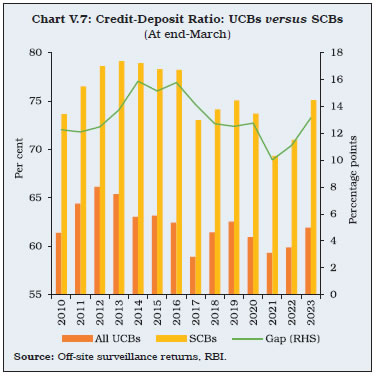
| Table V.4: Distribution of UCBs by Deposits, Advances and Assets | | (At end-March 2023) | | (Amount in ₹ crore) | | | Deposits | Advances | Assets | | No. of UCBs | Amount | No. of UCBs | Amount | No. of UCBs | Amount | | 1 | 2 | 3 | 4 | 5 | 6 | 7 | | 0 ≤ X < 10 | 85 | 494 | 203 | 1,153 | 45 | 263 | | 10 ≤ X < 25 | 183 | 3,138 | 271 | 4,676 | 143 | 2,515 | | 25 ≤ X < 50 | 264 | 9,893 | 283 | 10,021 | 211 | 7,866 | | 50 ≤ X < 100 | 288 | 20,863 | 267 | 19,284 | 316 | 22,957 | | 100 ≤ X < 250 | 323 | 51,917 | 236 | 36,952 | 355 | 58,598 | | 250 ≤ X < 500 | 159 | 56,557 | 133 | 46,628 | 187 | 66,660 | | 500 ≤ X < 1000 | 110 | 75,157 | 63 | 46,284 | 130 | 91,478 | | 1000 ≤ X | 90 | 3,15,237 | 46 | 1,65,327 | 115 | 4,29,964 | | Total | 1,502 | 5,33,255 | 1,502 | 3,30,325 | 1,502 | 6,80,301 | Notes: 1. Data are provisional.
2. ‘X’ indicates amount of deposits, advances, and assets.
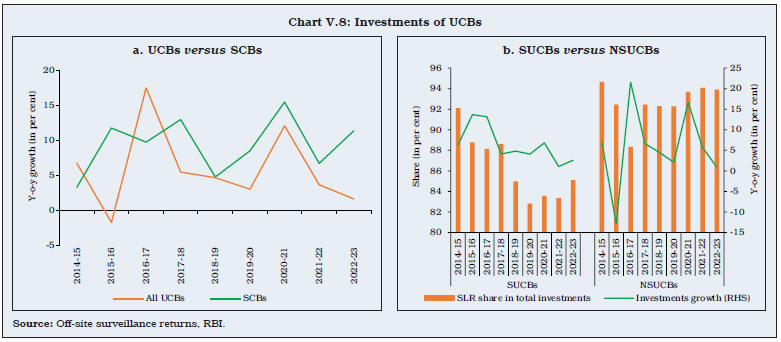
Source: Off-site surveillance returns, RBI. | V.15 During 2022-23, UCBs’ investments decelerated in sharp contrast to SCBs (Chart V.8a). Over time, the share of state government securities has increased in UCBs’ statutory liquidity ratio (SLR) investments (Table V.5). V.16 SUCBs have 85 per cent of their total investments in SLR, while the ratio is higher at 94 per cent for NSUCBs (Chart V.8b). 3.2. Financial Performance and Profitability V.17 Net profits of UCBs expanded for the third consecutive year in 2022-23, albeit at a slower pace than in previous years. Profitability (before as well as after taxes) of UCBs is yet to fully recuperate from the stress during 2019-20. The uptick in net profits during 2022-23 was due to a revival in total income and a contraction in total expenditure. A pick up in loans and advances led to higher interest income. On the other hand, interest expenses continued to decline. The decline in non-interest income of NSUCBs led to a reduction in non-interest income of the sector, whereas non-interest expenditure expanded for the second consecutive year (Table V.6). | Table V.5: Investments by UCBs | | (Amount in ₹ crore) | | | Amount outstanding (At end-March) | Variation (%) | | 2021 | 2022 | 2023 | 2021-22 | 2022-23 | | 1 | 2 | 3 | 4 | 5 | 6 | | Total Investments (A + B) | 1,81,025 | 1,87,610 | 1,90,627 | 3.6 | 1.6 | | | (100.0) | (100.0) | (100.0) | | | | A. SLR Investments (i to iii) | 1,61,477 | 1,67,800 | 1,71,690 | 3.9 | 2.3 | | | (89.2) | (89.4) | (90.1) | | | | (i) Central Govt. Securities | 1,02,033 | 1,04,764 | 1,06,736 | 2.7 | 1.9 | | | (56.4) | (55.8) | (56.0) | | | | (ii) State Govt. Securities | 58,951 | 62,609 | 64,649 | 6.2 | 3.3 | | | (32.6) | (33.4) | (33.9) | | | | (iii) Other approved Securities | 492 | 427 | 305 | -13.3 | -28.5 | | | (0.3) | (0.2) | (0.2) | | | | B. Non-SLR Investments | 19,549 | 19,810 | 18,937 | 1.3 | -4.4 | | | (10.8) | (10.6) | (9.9) | | | Notes: 1. Data for 2023 are provisional.
2. Figures in parentheses are proportions to total investments (in per cent).
Source: Off-site surveillance returns, RBI. |
| Table V.6: Financial Performance of Scheduled and Non-scheduled UCBs | | (Amount in ₹ crore) | | | Scheduled UCBs | Non-scheduled UCBs | All UCBs | All UCBs variation (%) | | 2021-22 | 2022-23 | 2021-22 | 2022-23 | 2021-22 | 2022-23 | 2022-23 | | 1 | 2 | 3 | 4 | 5 | 6 | 7 | 8 | | A. Total Income [i+ii] | 21,389 | 22,449 | 30,060 | 29,885 | 51,448 | 52,334 | 1.7 | | | (100.0) | (100.0) | (100.0) | (100.0) | (100.0) | (100.0) | | | i. Interest Income | 18,565 | 19,473 | 28,060 | 28,093 | 46,625 | 47,566 | 2.0 | | | (86.8) | (86.7) | (93.3) | (94.0) | (90.6) | (90.9) | | | ii. Non-interest Income | 2,824 | 2,976 | 2,000 | 1,792 | 4,823 | 4,768 | -1.1 | | | (13.2) | (13.3) | (6.7) | (6.0) | (9.4) | (9.1) | | | B. Total Expenditure [i+ii] | 17,586 | 17,817 | 25,033 | 24,568 | 42,619 | 42,384 | -0.6 | | | (100.0) | (100.0) | (100.0) | (100.0) | (100.0) | (100.0) | | | i. Interest Expenditure | 11,398 | 11,093 | 17,321 | 16,364 | 28,719 | 27,457 | -4.4 | | | (64.8) | (62.3) | (69.2) | (66.6) | (67.4) | (64.8) | | | ii. Non-interest Expenditure | 6,188 | 6,724 | 7,712 | 8,203 | 13,900 | 14,927 | 7.4 | | | (35.2) | (37.7) | (30.8) | (33.4) | (32.6) | (35.2) | | | of which: Staff Expenses | 2,879 | 2,954 | 4,143 | 4,255 | 7,021 | 7,208 | 2.7 | | C. Profits | | | | | | | | | i. Operating Profits | 3,803 | 4,632 | 5,027 | 5,318 | 8,829 | 9,950 | 12.7 | | ii. Provisions and Contingencies | 1,971 | 2,893 | 2,833 | 2,658 | 4,804 | 5,551 | 15.5 | | iii. Provision for taxes | 299 | 464 | 830 | 845 | 1,129 | 1,309 | 16.0 | | iv. Net Profit before Taxes | 1,832 | 1,739 | 2,193 | 2,659 | 4,025 | 4,399 | 9.3 | | v. Net Profit after Taxes | 1,533 | 1,275 | 1,364 | 1,815 | 2,896 | 3,090 | 6.7 | Notes: 1. Data for 2022-23 are provisional.
2. Figures in parentheses are proportions to total income/expenditure (in per cent).
Source: Off-site surveillance returns, RBI. |
| Table V.7: Select Profitability Indicators of UCBs | | (Per cent) | | Indicators | Scheduled UCBs | Non- Scheduled UCBs | All UCBs | | 2021-22 | 2022-23 | 2021-22 | 2022-23 | 2021-22 | 2022-23 | | 1 | 2 | 3 | 4 | 5 | 6 | 7 | | Return on Assets | 0.52 | 0.42 | 0.38 | 0.49 | 0.44 | 0.46 | | Return on Equity | 6.54 | 5.09 | 4.09 | 5.20 | 5.10 | 5.15 | | Net Interest Margin | 2.44 | 2.77 | 2.97 | 3.17 | 2.73 | 2.99 | Note: Data for 2022-23 are provisional.
Source: Off-site surveillance returns, RBI. | V.18 During 2022-23, the key indicators of profitability viz., return on assets (RoA), return on equity (RoE) and net interest margin (NIM), improved for UCBs, despite an increase in provisions and contingencies (Table V.7). During Q1:2023-24, UCBs’ profitability improved further. 3.3. Soundness V.19 The claims settled by the Deposit Insurance and Credit Guarantee Corporation (DICGC) during 2022-23 amounted to ₹752 crore and pertained entirely to co-operative banks placed under liquidation/ all-inclusive directions (AID). These included: (a) claims settled under Section 18(A) amounting to ₹646 crore pertaining to UCBs placed under AID, within the statutory timeline of 90 days after imposition of the directions; (b) supplementary claims in respect of 10 UCBs amounting to ₹46 crore under Section 17(1); and (c) an amount of ₹59 crore provided to Unity Small Finance Bank (USFB) for making payment to the depositors of erstwhile Punjab and Maharashtra Co-operative Bank Ltd. (PMCBL) pursuant to the latter’s merger with USFB with effect from January 25, 2022 under Section 16(2). | Table V.8: CRAR-wise Distribution of UCBs | | (At end-March 2023) | | (Number of banks) | | CRAR (in per cent) | Scheduled UCBs | Non-Scheduled UCBs | All UCBs | | 1 | 2 | 3 | 4 | | CRAR < 3 | 2 | 48 | 50 | | 3 <= CRAR < 6 | 0 | 8 | 8 | | 6 <= CRAR < 9 | 3 | 18 | 21 | | 9 <= CRAR < 12 | 1 | 101 | 102 | | 12 <= CRAR | 45 | 1,276 | 1,321 | | Total | 51 | 1,451 | 1,502 | Note: Data are provisional.
Source: Off-site surveillance returns, RBI. | 3.4. Capital Adequacy V.20 The revised regulatory framework introduced in July 2022 increased the minimum regulatory capital requirements for Tier 2 to Tier 4 UCBs to 12 per cent, while keeping it at 9 per cent for Tier 1 UCBs. At end-March 2023, while 40 per cent of UCBs belonged to the upper tiers (Tiers 2 to 4), 88 per cent maintained CRARs above 12 per cent (Table V.8).
| Table V.9: Component-wise Capital Adequacy of UCBs | | (At end-March) | | (Amount in ₹ crore) | | | Scheduled UCBs | Non-Scheduled UCBs | All UCBs | | 2022 | 2023 | 2022 | 2023 | 2022 | 2023 | | 1 | 2 | 3 | 4 | 5 | 6 | 7 | 8 | | 1 | Capital Funds | 20,908 | 23,038 | 27,902 | 30,422 | 48,811 | 53,461 | | | i) Tier I Capital | 14,956 | 17,667 | 24,005 | 26,454 | 38,960 | 44,120 | | | ii) Tier II Capital | 5,953 | 5,371 | 3,898 | 3,969 | 9,850 | 9,340 | | 2 | Risk-Weighted Assets | 1,46,900 | 1,51,128 | 1,67,050 | 1,71,383 | 3,13,950 | 3,22,511 | | 3 | CRAR (1 as % of 2) | 14.2 | 15.2 | 16.7 | 17.8 | 15.5 | 16.6 | | | Of which: | | | | | | | | | Tier I | 10.2 | 11.7 | 14.4 | 15.4 | 12.4 | 13.7 | | | Tier II | 4.1 | 3.6 | 2.3 | 2.3 | 3.1 | 2.9 | Note: Data for 2023 are provisional.
Source: Off-site surveillance returns, RBI. | V.21 In terms of the CRAR distribution of SUCBs, an improvement was observed in 2022-23, although 2 SUCBs recorded negative CRARs at end-March 2023 (Chart V.9). V.22 During 2022-23, the consolidated CRAR of all UCBs improved on the back of higher profit accretion and capital raised through long-term subordinated bonds. Moreover, the revaluation reserves, which were earlier reckoned in Tier II capital, have been allowed as Tier I capital from end-March 2023, subject to certain conditions. This helped strengthen their Tier I capital during the year (Table V.9). At end-June 2023, UCBs further shored up their CRAR on the back of lower provisioning and improving profitability. 3.5. Asset Quality V.23 UCBs’ asset quality improved further in 2022-23, partly reflecting lower slippages and stronger loan recovery. The GNPA ratio has declined from a peak in 2020-21, although an uptick was evident during Q1:2023-24. Among UCBs, while NSUCBs have higher GNPA ratios, improvement during 2022-23 was sharp. A significant decline in outstanding GNPAs led to an increase in their provision coverage ratio (PCR) (Table V.10 and Chart V.10a). Going forward, with the harmonisation of UCBs’ provisioning norms for standard advances, effective April 2023, their PCR is likely to rise further. | Table V.10: Non-Performing Assets of UCBs | | (At end-March) | | | Scheduled UCBs | Non-Scheduled UCBs | All UCBs | | 2022 | 2023 | 2022 | 2023 | 2022 | 2023 | | 1 | 2 | 3 | 4 | 5 | 6 | 7 | 8 | | 1 | Gross NPAs (₹ crore) | 10,686 | 10,014 | 21,621 | 19,196 | 32,307 | 29,210 | | 2 | Gross NPA Ratio (%) | 7.5 | 6.6 | 12.6 | 10.7 | 10.3 | 8.8 | | 3 | Net NPAs (₹ crore) | 3,542 | 2,197 | 5,719 | 4,891 | 9,261 | 7,088 | | 4 | Net NPA Ratio (%) | 2.5 | 1.4 | 3.3 | 2.7 | 2.9 | 2.1 | | 5 | Provisioning (₹ crore) | 7,144 | 7,817 | 15,902 | 14,305 | 23,046 | 22,122 | | 6 | Provision Coverage Ratio (%) | 66.9 | 78.1 | 73.5 | 74.5 | 71.3 | 75.7 | Note: Data for 2023 are provisional.
Source: Off-site surveillance returns, RBI. |
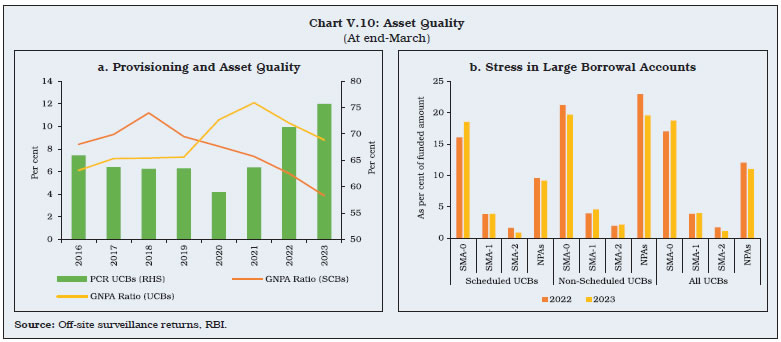 V.24 Large borrowal accounts, i.e., accounts with exposures of ₹5 crore and above, constituted 25 per cent of UCBs’ total lending and 31 per cent of their total GNPAs at end-March 2023. Among UCBs, a large disparity exists in exposure to these accounts, with 45 per cent of SUCBs’ total lending concentrated in large borrowers, as against NSUCBs’ 8 per cent. Although NSUCBs’ GNPA ratio stemming from large borrowal accounts is much higher than SUCBs, it declined during the year, leading to an overall reduction in UCBs’ GNPA from such accounts. For the sector as a whole, SMA-0 and SMA-1 ratios registered an uptick during the year, but the SMA-2 ratio declined (Chart V.10b). 3.6. Priority Sector Lending V.25 The revised priority sector lending norms for UCBs set higher targets for them to be achieved in a phased manner6. The priority sector lending of UCBs was 67 per cent at end-March 2023. The sector has, thus, already achieved the target set for end-March 2025 (Chart V.11). 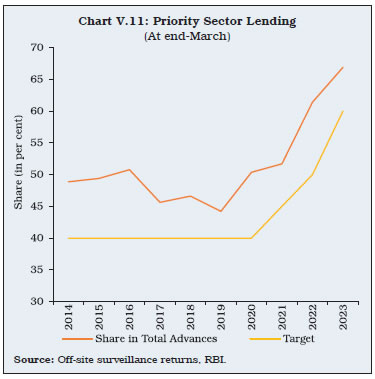 V.26 The increase in priority sector lending by UCBs during 2022-23 was led by credit to MSMEs — particularly micro enterprises — constituting 41 per cent of their total lending. Like SCBs, UCBs are required to lend a minimum of 7.5 per cent of their adjusted net bank credit (ANBC) / credit equivalent amount of off-balance sheet exposures (CEOBE) to micro enterprises. In addition, the target for UCBs for 2022-23 for lending to weaker sections was 11.5 per cent of their ANBC/CEOBE. UCBs met both these targets at end-March 2023 (Table V.11). Housing loans, which comprised close to 10 per cent of UCBs’ total lending at end-March 2023, contracted during the year despite increased housing lending limits (see Chapter III, para III.32). | Table V.11 : Composition of Credit to Priority Sectors by UCBs | | (At end-March) | | (Amount in ₹ crore) | | | 2022 | 2023 | | Amount | Share in Total Advances (%) | Amount | Share in Total Advances (%) | | 1 | 2 | 3 | 4 | 5 | | 1. Agriculture [(i)+(ii)+(iii)] | 13,259 | 4.2 | 16,550 | 5.0 | | (i) Farm Credit | 9,851 | 3.1 | 12,306 | 3.7 | | (ii) Agriculture Infrastructure | 660 | 0.2 | 971 | 0.3 | | (iii) Ancillary Activities | 2,755 | 0.9 | 3,273 | 1.0 | | 2. Micro and Small Enterprises [(i) + (ii) +(iii) + (iv)] | 1,08,958 | 34.6 | 1,34,320 | 40.7 | | (i) Micro Enterprises | 42,896 | 13.6 | 56,917 | 17.2 | | (ii) Small Enterprises | 44,740 | 14.2 | 52,710 | 16.0 | | (iii) Medium Enterprises | 20,832 | 6.6 | 24,018 | 7.3 | | (iv) Advances to KVI (Including 'Other Finance to MSMEs') | 490 | 0.2 | 674 | 0.2 | | 3. Export Credit | 245 | 0.1 | 345 | 0.1 | | 4. Education | 2,375 | 0.8 | 3,431 | 1.0 | | 5. Housing | 32,141 | 10.2 | 31,502 | 9.5 | | 6. Social Infrastructure | 1,374 | 0.4 | 1,242 | 0.4 | | 7. Renewable Energy | 694 | 0.2 | 1,050 | 0.3 | | 8. ‘Others’ category under Priority Sector | 34,183 | 10.9 | 32,492 | 9.8 | | 9. Total (1 to 8) | 1,93,229 | 61.4 | 2,20,932 | 66.9 | | of which, Loans to Weaker Sections under Priority Sector | 36,141 | 11.5 | 49,006 | 14.8 | Note: Data for 2023 are provisional.
Source: Off-site surveillance returns, RBI. | 4. Rural Co-operatives V.27 Rural credit co-operatives, with a history of more than a century in India, were set up to address the concerns of inadequate access to formal and affordable credit in rural areas. They have since carved out a niche for themselves in the rural credit delivery system, owing to their wide reach at the grassroots level. The sector, consisting of short-term and long-term institutions, expanded its operations further in 2021-22. Its share in the total assets of the co-operative sector increased to 69.2 per cent from a recent low of 65.2 per cent at end-March 2018 (Chart V.12). V.28 RCCs differ from their urban counterparts in terms of their geographical reach, balance sheet composition, profitability indicators as well as asset quality. Gauging by the metric of number of branches, RCCs have a larger geographic presence. However, their deposit pool is smaller, increasing their dependence on relatively costlier borrowings which, in turn, has an adverse impact on their profitability. 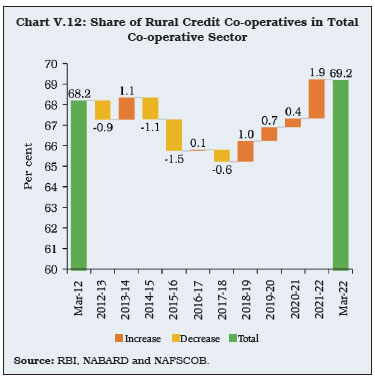 V.29 Within RCCs, the financial performance of short-term rural co-operatives has consistently been better than their long-term counterparts (Chart V.13). The latter provide term finance for capital formation and rural non-farm projects. Such longer maturity loans are exposed to the risk of a fast-evolving external environment. Repeated debt waivers have also created a moral hazard problem, impacting loan recovery. While the share of long-term rural co-operatives in total RCC assets is miniscule at 4 per cent, they have disproportionately higher NPAs, losses and lower recovery-to-demand ratios. V.30 The challenges faced by RCCs are primarily structural, emanating from a non-diversified lending portfolio focussed on agriculture, burgeoning NPAs, low recoveries and high operating costs. The increasing number of loss-making RCCs, particularly PCARDBs, remains a cause of concern (Chart V.14). Low profitability and high NPAs have contributed to capital shortfalls in many of these institutions (Table V.12).
4.1. Short-term Rural Credit Co-operatives V.31 Short-term RCCs have a three-tier structure viz., state co-operative banks (StCBs); district central co-operative banks (DCCBs); and primary agricultural credit societies (PACS). Apart from short-term crop loans to farmers, the scope of their operations has widened over time to cover the non-farm sector, with term lending to allied sectors, and microfinance. At end-March 2022, the short-term rural co-operative sector consisted of 34 StCBs7, 351 DCCBs8, and 1,04,266 PACS spread across 34 States/UTs. | Table V.12: A Profile of Rural Credit Co-operatives | | (At end-March 2022) | | (Amount in ₹ crore) | | | Short-term | Long-term | Rural Credit Co-operatives | | StCBs | DCCBs | PACS | SCARDBs (P) | PCARDBs (P) | | 1 | 2 | 3 | 4 | 5 | 6 | 7 | | A. Number of Co-operatives | 34 | 351 | 1,04,266 | 13 | 604 | 1,05,268 | | B. Balance Sheet Indicators | | | | | | | | i. Owned Funds (Capital + Reserves) | 27,234 | 50,946 | 42,754 | 6,315 | 8,211 | 1,35,460 | | ii. Deposits | 2,40,953 | 4,12,573 | 1,76,390 | 2,253 | 1,675 | 8,33,844 | | iii. Borrowings | 1,23,785 | 1,28,524 | 1,72,374 | 13,409 | 17,282 | 4,55,373 | | iv. Loans and Advances | 2,38,919 | 3,36,546 | 1,53,137 | 21,261 | 16,607 | 7,66,470 | | v. Total Liabilities/Assets | 4,17,233 | 6,49,546 | 3,69,896 + | 28,097 | 33,520 | 14,98,292 | | C. Financial Performance | | | | | | | | i. Institutions in Profits | | | | | | | | a. No. | 31 | 302 | 47,896 | 10 | 222 | 48,461 | | b. Amount of Profit | 2,338 | 2,354 | 1,810 | 151 | 102 | 6,754 | | ii. Institutions in Loss | | | | | | | | a. No. | 3 | 49 | 38,644 | 3 | 382 | 39,081 | | b. Amount of Loss | 50 | 996 | 3,747 | 72 | 641 | 5,506 | | iii. Overall Profits (+)/Loss (-) | 2,288 | 1,358 | -1,937 | 78 | -539 | 1,248 | | D. Non-performing Assets | | | | | | | | i. Amount | 14,332 | 36,330 | 51,363 ++ | 7,522 | 7,172 | 1,16,718 | | ii. As percentage of Loans Outstanding | 6.0 | 10.8 | 32.16 | 35.4 | 43.2 | - | | E. Recovery of Loans to Demand Ratio* (Per cent) | 91.7 | 75.6 | 71.2 | 43.5 | 39.8 | - | Notes: 1. StCBs: State Co-operative Banks, DCCBs: District Central Co-operative Banks, PACS: Primary Agricultural Credit Societies, SCARDBs: State Co-operative Agriculture and Rural Development Banks, PCARDBs: Primary Co-operative Agriculture and Rural Development Banks.
2. (P)- Data are provisional.
3. *: This ratio captures the share of outstanding NPAs that have been recovered at end-June 2021.
4. +: Working capital.
5. ++: Total overdues.
Source: NABARD and NAFSCOB (PACS data). | V.32 Among short-term RCCs, StCBs have consistently outperformed the other two, with lower NPA ratios, higher RoAs, and higher recovery-to-demand ratios (Chart V.15). PACS are the weakest link, with high dependency on borrowings and higher losses incurred during 2021-22. 4.1.1. State Co-operative Banks V.33 State co-operative banks (StCBs) operate in a two-tier/three-tier/mixed-tier structure. In a two-tier structure, mostly located in the north-eastern part of India, StCBs operate through their own branches, whereas in case of a three-tier structure, StCBs work as the apex bank for all DCCBs. At end-March 2022, StCBs had 2,089 branches, providing more than 45 per cent of their total credit towards agriculture. Balance Sheet Operations V.34 Owned funds of StCBs, which comprise share capital and reserves, grew by 11.5 per cent during 2021-22, and were 6.5 per cent of their total liabilities at end-March 2022. The growth in owned funds was driven by accretion to share capital and improvement in profitability. Although deposits accelerated in 2021-22, they were outpaced by growth in loans and advances (Table V.13). V.35 Credit growth of StCBs remained robust in 2022-23 and they liquidated their SLR investments to bridge the C-D gap due to contraction in deposits (Table V.14). Profitability V.36 Reflecting the accommodative monetary policy stance and the reduction in deposit and lending rates, growth in the interest income of StCBs decelerated in 2021-22 while there was a contraction in interest expended. On balance, net interest income rose by 30.3 per cent, faster than 13.9 per cent in the previous year, which led to higher profits. However, the contraction in non-interest income adversely affected their profitability (Table V.15). | Table V.13: Liabilities and Assets of State Co-operative Banks | | (Amount in ₹ crore) | | | At end-March | Variation (%) | | 2021 | 2022 | 2020-21 | 2021-22 | | 1 | 2 | 3 | 4 | 5 | | Liabilities | | | | | | 1. Capital | 8,577 | 9,263 | 15.0 | 8.0 | | | (2.3) | (2.2) | | | | 2. Reserves | 15,848 | 17,971 | 9.7 | 13.4 | | | (4.2) | (4.3) | | | | 3. Deposits | 2,23,057 | 2,40,953 | 6.0 | 8.0 | | | (59.1) | (57.8) | | | | 4. Borrowings | 1,07,207 | 1,23,785 | 25.1 | 15.5 | | | (28.4) | (29.7) | | | | 5. Other Liabilities | 22,648 | 25,260 | 1.6 | 11.5 | | | (6.0) | (6.1) | | | | Assets | | | | | | 1. Cash and Bank Balances | 14,360 | 18,864 | 40.4 | 31.4 | | | (3.8) | (4.5) | | | | 2. Investments | 1,29,329 | 1,40,966 | 14.6 | 9.0 | | | (34.3) | (33.8) | | | | 3. Loans and Advances | 2,11,794 | 2,38,919 | 5.9 | 12.8 | | | (56.1) | (57.3) | | | | 4. Accumulated Losses | 1,405 | 1,353 | 14.0 | -3.7 | | | (0.4) | (0.3) | | | | 5. Other Assets | 20,451 | 17,130 | 27.5 | -16.2 | | | (5.4) | (4.1) | | | | Total Liabilities/Assets | 3,77,338 | 4,17,233 | 10.9 | 10.6 | | | (100.00) | (100.00) | | | Note: Figures in parentheses are proportions to total liabilities/assets (in per cent).
Source: NABARD. |
| Table V.14: Select Balance Sheet Indicators of Scheduled State Co-operative Banks | | (At end-March) | | (Amount in ₹ crore) | | | 2019 | 2020 | 2021 | 2022 | 2023 | | 1 | 2 | 3 | 4 | 5 | 6 | | Deposits | 1,10,559 | 1,87,456 | 1,97,751 | 2,11,784 | 2,04,432 | | | (11.9) | (69.6) | (5.5) | (7.1) | (-3.5) | | Credit | 1,31,399 | 1,94,310 | 2,06,322 | 2,28,194 | 2,55,750 | | | (11.4) | (47.9) | (6.2) | (10.6) | (12.1) | | SLR Investments | 33,130 | 54,181 | 67,788 | 77,677 | 74,721 | | | -(0.8) | (63.5) | (25.1) | (14.6) | (-3.8) | | Credit plus SLR Investments | 1,64,529 | 2,48,492 | 2,74,110 | 3,05,871 | 3,30,471 | | | (8.7) | (51.0) | (10.3) | (11.6) | (8.0) | Notes: 1.Data pertain to last reporting Friday of March of the corresponding year.
2. Figures in parentheses are growth rates in per cent over previous year.
Source: Form B under Section 42 of RBI Act. |
| Table V.15: Financial Performance of State Co-operative Banks | | (Amount in ₹ crore) | | | | Percentage Variation | | 2020-21 | 2021-22 | 2020-21 | 2021-22 | | 1 | 2 | 3 | 4 | 5 | | A. Income (i+ii) | 24,318 | 24,954 | 10.9 | 2.6 | | | (100.00) | (100.00) | | | | i. Interest Income | 23,177 | 24,171 | 15.8 | 4.3 | | | (95.3) | (96.9) | | | | ii. Other Income | 1,141 | 784 | -40.2 | -31.3 | | | (4.7) | (3.1) | | | | B. Expenditure (i+ii+iii) | 22,916 | 22,666 | 13.5 | -1.1 | | | (100.00) | (100.00) | | | | i. Interest Expended | 17,318 | 16,538 | 16.5 | -4.5 | | | (75.6) | (73) | | | | ii. Provisions and Contingencies | 2,181 | 2,378 | -17.6 | 9.0 | | | (9.5) | (10.5) | | | | iii. Operating Expenses | 3,418 | 3,751 | 27.5 | 9.7 | | | (14.9) | (16.5) | | | | Of which, | | | | | | Wage Bill | 1,926 | 2,064 | 29.1 | 7.2 | | | (8.4) | (9.1) | | | | C. Profits | | | | | | i. Operating Profits | 2,947 | 4,476 | -0.9 | 51.9 | | ii. Net Profits | 1,402 | 2,288 | -18.7 | 63.2 | Note: Figures in parentheses are proportions to total income/ expenditure (in per cent).
Source: NABARD. | V.37 The western region, especially Maharashtra, contributes the major share in StCBs’ net profits. 31 StCBs posted a profit of ₹2,338 crore while 3 StCBs (viz. Arunachal Pradesh, Puducherry and Jammu and Kashmir StCB) incurred losses of ₹50 crore (Appendix Table V.3). Asset Quality V.38 Asset quality of StCBs improved during 2021-22 on lower slippages. Within NPAs, sub-standard and loss category loans contracted (Table V.16). However, the doubtful category — which constitutes nearly half of the outstanding NPAs — grew for the fifth consecutive year. While a majority of the 34 StCBs reported lower GNPA ratios at end-March 2022 than a year ago, two StCBs reported GNPA ratios greater than 50 per cent. The improvement in GNPA ratios and recovery-to-demand ratios was led by southern and western states (Appendix Table V.3). | Table V.16: Soundness Indicators of State Co-operative Banks | | (Amount in ₹ crore) | | | At end-March | Percentage Variation | | 2021 | 2022 | 2020-21 | 2021-22 | | 1 | 2 | 3 | 4 | 5 | | A. Total NPAs (i+ii+iii) | 14,113 | 14,332 | 4.7 | 1.5 | | i. Sub-standard | 7,379 | 5,387 | -6.4 | -27.0 | | | (52.3) | (37.6) | | | | ii. Doubtful | 5,294 | 7,541 | 20.3 | 42.4 | | | (37.5) | (52.6) | | | | iii. Loss | 1,440 | 1,404 | 20.5 | -2.5 | | | (10.2) | (9.8) | | | | B. NPAs to Loans Ratio (%) | 6.7 | 6.0 | - | - | | C. Recovery to Demand Ratio (%) | 90.5 | 91.7 | - | - | Notes: 1. Figures in parentheses are shares in total NPA (in per cent).
2. Recovery-to-demand ratio captures the share of outstanding NPAs that have been recovered at end-June 2020 and 2021 for 2020-21 and 2021-22, respectively.
Source: NABARD. | 4.1.2. District Central Co-operative Banks V.39 DCCBs constitute the second tier in the short-term rural co-operative structure and operated with a network of 13,670 branches at end-March 2022. 20 States/UTs have one or more DCCBs (having either a three-tier or a mix of three-tier and two-tier structure). In 14 States/UTs, there are no DCCBs and only a two-tier structure exists. They have a larger presence in the central region. Deposits form the major source of funding for DCCBs, followed by borrowings from StCBs and refinance from NABARD. More than 50 per cent of DCCBs’ total lending is directed towards agriculture and more than 75 per cent of their total lending is conducted through PACS. DCCBs function with lower C-D ratios than StCBs, owing to their higher deposit base. Balance Sheet Operations V.40 The acceleration in the consolidated balance sheet of DCCBs during 2021-22 was led by borrowings on the liabilities side, which offset the deceleration in deposits. On the assets side, their loan growth accelerated, while investments decelerated (Table V.17). Profitability V.41 DCCBs’ total expenditure rose during 2021-22, driven by operational expenses and higher provisions and contingencies even as interest expenditure declined. With expenditure growth exceeding income growth, net profits contracted during 2021-22 (Table V.18). | Table V.17: Liabilities and Assets of District Central Co-operative Banks | | (Amount in ₹ crore) | | | At end-March | Percentage Variation | | 2021 | 2022 | 2020-21 | 2021-22 | | 1 | 2 | 3 | 4 | 5 | | Liabilities | | | | | | 1. Capital | 22,391 | 24,472 | 7.1 | 9.3 | | | (3.8) | (3.8) | | | | 2. Reserves | 24,381 | 26,474 | 9.2 | 8.6 | | | (4.1) | (4.1) | | | | 3. Deposits | 3,81,825 | 4,12,573 | 10.5 | 8.1 | | | (64.8) | (63.5) | | | | 4. Borrowings | 1,08,077 | 1,28,524 | 10.9 | 18.9 | | | (18.4) | (19.8) | | | | 5. Other Liabilities | 52,239 | 57,504 | 5.3 | 10.1 | | | (8.9) | (8.9) | | | | Assets | | | | | | 1. Cash and Bank Balances | 26,973 | 32,107 | 15.2 | 19.0 | | | (4.6) | (4.9) | | | | 2. Investments | 2,11,380 | 2,35,913 | 13.2 | 11.6 | | | (35.9) | (36.3) | | | | 3. Loans and Advances | 3,04,990 | 3,36,546 | 9.2 | 10.3 | | | (51.8) | (51.8) | | | | 4. Accumulated Losses | 7,046 | 7,753 | 4.8 | 10.0 | | | (1.2) | (1.2) | | | | 5. Other Assets | 38,525 | 37,226 | -3.3 | -3.4 | | | (6.5) | (5.7) | | | | Total Liabilities/Assets | 5,88,914 | 6,49,546 | 9.9 | 10.3 | | | (100.00) | (100.00) | | | Note: Figures in parentheses are proportions to total liabilities/assets (in per cent).
Source: NABARD. |
| Table V.18: Financial Performance of District Central Co-operative Banks | | (Amount in ₹ crore) | | | | Percentage Variation | | 2020-21 | 2021-22 | 2020-21 | 2021-22 | | 1 | 2 | 3 | 4 | 5 | | A. Income (i+ii) | 39,982 | 41,685 | 4.1 | 4.3 | | | (100.00) | (100.00) | | | | i. Interest Income | 38,089 | 39,698 | 4.4 | 4.2 | | | (95.3) | (95.2) | | | | ii. Other Income | 1,893 | 1,986 | -1.6 | 4.9 | | | (4.7) | (4.8) | | | | B. Expenditure (i+ii+iii) | 38,560 | 40,327 | 2.7 | 4.6 | | | (100.00) | (100.00) | | | | i. Interest Expended | 25,480 | 25,408 | 2.6 | -0.3 | | | (66.1) | (63) | | | | ii. Provisions and Contingencies | 3,720 | 4,889 | -4.3 | 31.4 | | | (9.6) | (12.1) | | | | iii. Operating Expenses | 9,361 | 10,030 | 5.9 | 7.1 | | | (24.3) | (24.9) | | | | Of which, Wage Bill | 5,864 | 6,329 | 3.6 | 7.9 | | | (15.2) | (15.7) | | | | C. Profits | | | | | | i. Operating Profits | 4,723 | 5,897 | 11.7 | 24.8 | | ii. Net Profits | 1,422 | 1,358 | 68.1 | -4.5 | Note: Figures in parentheses are proportions to total liabilities/assets (in per cent).
Source: NABARD. | V.42 The number of loss-making DCCBs and their losses increased during the year. The western and southern states contributed the most towards DCCBs’ profits, while the central region added the highest to losses (Appendix Table V.4). Asset Quality V.43 The GNPA ratio of DCCBs moderated during 2021-22 but remains elevated. Although the accretion to NPAs was higher during the year, the GNPA ratio declined on the back of robust credit growth (Table V.19). Their GNPA ratios declined in 16 of 20 states during 2021-22. The central and southern states — particularly, Kerala, Madhya Pradesh, and Tamil Nadu — experienced an increase in their GNPA ratios. The southern region continued to have the lowest NPA ratio and the highest recovery-to-demand ratio across regions (Appendix Table V.4). | Table V.19: Soundness Indicators of District Central Co-operative Banks | | (Amount in ₹ crore) | | | At end-March | Percentage Variation | | 2021 | 2022 | 2020-21 | 2021-22 | | 1 | 2 | 3 | 4 | 5 | | A. Total NPAs (i+ ii + iii) | 34,761 | 36,330 | -1.5 | 4.5 | | i) Sub-standard | 13,940 | 13,418 | -12.2 | -3.7 | | | (40.1) | (36.9) | | | | ii) Doubtful | 18,367 | 20,292 | 8.1 | 10.5 | | | (52.8) | (55.9) | | | | iii) Loss | 2,455 | 2,620 | 1.3 | 6.7 | | | (7.1) | (7.2) | | | | B. NPAs to Loans Ratio (%) | 11.4 | 10.8 | - | - | | C. Recovery to Demand Ratio (%) | 74.9 | 75.6 | - | - | Notes: 1. Figures in parentheses are proportions to total NPAs (in per cent).
2. Recovery-to-demand ratio captures the share of outstanding NPAs that have been recovered at end-June 2020 and 2021 for 2020-21 and 2021-22, respectively.
Source: NABARD. | 4.1.3. Primary Agricultural Credit Societies V.44 Primary agricultural credit societies (PACS) form the lowest tier in the rural co-operative ladder and have individuals — mostly farmers — as member shareholders, with 80 per cent of PACS’ total lending going towards agriculture. Apart from extending short-term and medium-term agricultural finance, they play a role in the supply of agricultural inputs, distribution of consumer articles, and marketing of their members’ produce. In some states, PACS have their own branch network. V.45 To strengthen and promote the co-operative ecosystem, the Ministry of Co-operation, Government of India has undertaken several initiatives in recent years. These include, inter alia, computerisation of PACS, preparation of model by-laws to enable them to undertake business activities like dairy and fishery, setting up of godowns, and rationalisation of taxes on them. Furthermore, a plan has been approved by the Government to set up 2 lakh new multi-purpose PACS, and dairy and fisheries co-operatives covering every Panchayat/village in the next five years. V.46 At end-March 2022, PACS served 16.9 crore members and 4.8 crore borrowers, with a dominating presence in the western region. However, in terms of business, i.e., deposits, working capital and loans and advances, the southern region dominated. The borrower-to-member ratio – a metric to gauge credit penetration of PACS – declined in 2021-22 to 28.6 per cent from 39.1 per cent in 2020-21, due to an increase in the number of members and a large decline in the number of borrowers. During the year, small farmers replaced others and marginal farmers as the largest category of borrowers (Appendix Table V.5). V.47 The growth in the total resources of PACS accelerated during 2021-22, led by borrowings. However, a sharp reduction in their short-term lending activities resulted in a contraction in outstanding loans and advances (Appendix Table V.6). V.48 46 per cent of total PACS are profit making, although their consolidated profits contracted by 65.8 per cent in 2021-22. The consolidated losses of 38,644 PACS fell by 13.3 per cent. For the sector as a whole, the consolidated losses were nearly double the profits. The western region was the sole region posting net profits. In aggregate terms, the highest amounts of profits as well as losses originated from the southern region (Appendix Table V.7). 4.2. Long-term Rural Credit Co-operatives V.49 Long-term RCCs were set up with the objective of providing term finance for capital formation and to finance rural non-farm projects. Their structure differs across states, with state co-operative agriculture and rural development banks (SCARDBs) operating at the state level and primary co-operative agriculture and rural development banks (PCARDBs) functioning at the district/block level. Currently, five states/ UTs viz., Gujarat, Jammu and Kashmir, Uttar Pradesh, Tripura and Puducherry follow a unitary structure, i.e., they function directly out of their own branches without separate PCARDBs. Six states (Haryana, Karnataka, Kerala, Punjab, Rajasthan and Tamil Nadu) have a federal structure, i.e., they lend through PCARDBs. Two states viz., Himachal Pradesh and West Bengal, operate through their own branches as well as through PCARDBs. V.50 The southern region has the largest network of long-term RCCs. The business models of both categories of long-term RCCs are borrowings-based, where SCARDBs borrow primarily from NABARD, and PCARDBs get requisite financial assistance from SCARDBs. 4.2.1. State Co-operative Agriculture and Rural Development Banks (SCARDBs) V.51 SCARDBs act as the apex institution in the long-term rural co-operative sector, both for providing finance and for co-ordinating the functions of PCARDBs and their branches. At end-March 2022, SCARDBs operated in 13 states with 794 branches. Their consolidated balance sheet expanded for the second year in a row during 2021-22, led by loans and advances. On the liabilities side, borrowings rebounded even as deposits contracted (Appendix Table V.8). V.52 With the expansion in expenditure outpacing that in income, net profits contracted during 2021-22 (Appendix Table V.9). The asset quality of SCARDBs worsened, with rising NPA ratios as well as declining recovery-to-demand ratios. The central region outperformed the other regions with a significant decrease in the NPA ratio as well as increased recovery-to-demand ratio. All states in the southern region recorded profits (Appendix Tables V.10 and V.11). 4.2.2. Primary Co-operative Agriculture and Rural Development Banks (PCARDBs) V.53 At end-March 2022, there were 604 PCARDBs across 8 states. Their consolidated balance sheet growth decelerated during 2021-22, led by a slowdown in borrowings on the liabilities side and a reduction in investments on the assets side (Appendix Table V.12). V.54 During 2021-22, both income and expenditure of PCARDBs contracted, with steeper fall in the former leading to net losses. Although interest expenses and provisioning requirements reduced, operating expenses — particularly, the wage bill — pulled up total expenditure (Appendix Table V.13). The NPA ratio deteriorated, driven by the doubtful assets category (Appendix Table V.14). The highest NPA ratios and the lowest recovery-to-demand ratios were observed in the northern region (Appendix Table V.15). 5. Overall Assessment V.55 The health of UCBs improved further in 2022-23, which was reflected in stronger capital buffers and higher profitability. While there has been a sustained reduction in their GNPA ratio, it remains elevated. A further strengthening of the quality of governance, based on the three pillars of compliance, risk management, and internal audit, warrants priority. The introduction of the four-tiered regulatory framework is a step forward in this direction. The flexibility allowed to financially sound and well managed UCBs in opening branches will open new vistas of growth. The establishment of the National Urban Co-operative Finance and Development Corporation (NUCFDC) as an umbrella organisation is also expected to further support the UCB sector, inter alia, by extending loans, refinance facilities and liquidity support to UCBs. Among rural credit co-operatives, StCBs reported better performance during 2021-22 on improved asset quality and profitability. The financial health of other segments of the rural credit co-operatives, however, needs improvement. Going forward, robust internal governance practices and continuous technological upgradation and innovations will help co-operative banks to expand their operations and improve their financial health.
|