1. Introduction 3.1 As India gains pace and stature as a major engine of the global economic order, sustained and large-scale public investments in human and physical capital will become critical. While India is making good progress in investment in physical infrastructure, the pace of investments in human capacity, especially, education, research and development (R&D) and skill development needs acceleration (Ghani, 2023). Such investments are contingent upon a commensurate jump in government revenues. Since State governments in India contribute to over 60 per cent of general government expenditure, it is crucial that they augment their capacity to generate revenues for the required investment drive. 3.2 Against this backdrop, this chapter assesses the fiscal capacity of Indian States. Section 2 examines their revenue mobilisation capacities and tax efforts. The dynamics of States’ own-tax revenues and own non-tax revenues are analysed against the backdrop of reforms initiated by them. Section 3 discusses the role of inter-governmental transfers in supplementing States’ own revenue while highlighting the challenges posed by the proliferation of cesses and surcharges. Section 4 concludes with some policy perspectives. 2. Revenue Mobilisation Efforts and Current Fiscal Capacity of States 3.3 Revenues receipts of the States can be classified into tax and non-tax categories. Taxes comprise their own tax revenues and share in Central taxes, while non-tax revenues include States’ own non-tax sources and grants from the Centre. 2.1 Own Tax Revenue 3.4 States’ own tax revenue (SOTR) has increased from 5.7 per cent of GDP in 2003-04 to 6.9 per cent of GDP in 2022-23 (Chart III.1).
3.5 Till 2016-17, sales tax/VAT was the largest component of own tax revenue. From 2017-18, however, State Goods and Services Tax (SGST) has emerged as the most important source, followed by sales tax/VAT, excise duty, stamp duty and registration fees and taxes on vehicles (Chart III.2). 3.6 There is a large spatial variation in SOTR, ranging from more than 70 per cent of total tax revenue in Haryana, Maharashtra, Telangana, Tamil Nadu, Gujarat, Karnataka, Kerala and Punjab to less than 50 per cent in Bihar and Jharkhand (Table III.1). In the post-GST period, there has been a general increase in the share of SOTR, which has helped the States to reduce their dependence on devolution from the Centre. 3.7 States’ tax buoyancy1 has improved in the recent period (Chart II.3a). SGST collection has picked up since 2021-22 with a buoyancy above one, benefitting from the revival in economic activity and increased compliance due to improved tax administration, especially among the larger States (Chart II.3b).
3.8 A stochastic frontier approach suggests reasonably high tax efforts though still below potential (Box III.1), which is broadly in line with existing evidence (Kawadia and Suryawanshi, 2021). Tax reforms and building a strong and innovative tax administration can generate large revenues, as observed in the cross-country experience. For instance, tax administration reforms in Hungary led to an increase of 40 per cent in tax revenue collections between 1996-1999 (IMF, 2002). Similarly, reforms in Tanzania raised tax revenues by 47 per cent between 1998 to 2003 (UNDP, 2011). Box III.1:
Tax Capacity of Indian States Tax capacity or fiscal capacity refers to the maximum/ potential tax revenue that a government can generate given its economic, social, administrative, demographic and other characteristics (Garg et al., 2016). It is distinct from the actual tax collection, which depends on the ability of the government to exploit its tax capacity (Mikesell, 2007). The estimation of tax capacity is important because the deviation of actual revenue from its potential can reflect inefficiencies and policy issues in taxation (Fenechietto and Pessino, 2013). Further, differences in tax capacities across States can be used to determine Central transfers, with greater assistance to those States that have lesser means to raise taxes from their own sources (The U.S. Advisory Commission on Intergovernmental Relations, 1986). Among various factors, higher levels of income and socio-economic development are associated with higher tax capacity. States with higher share of agriculture in gross value added are expected to have lower tax capacity as agricultural products and agricultural income are often exempted from taxation (Fenechietto and Pessino, 2013). Other relevant factors include education and awareness regarding tax policies and the extent of formalisation in the economy (Liu, 2023). Accordingly, five potential determinants are considered to estimate tax capacity at the State-level using a Stochastic Frontier Analysis (SFA) model, viz., (i) real per capita gross state domestic product (GSDP); (ii) share of agriculture in GSDP; (iii) literacy rate; (iv) road density; and (v) bank credit to GSDP ratio. While road density is included as a proxy for infrastructural development, bank credit reflects the degree of formalisation. The study is based on 16 major States covering the period 2001-02 to 2021-22. The stochastic frontier model is an extension of the familiar regression model. It is based on the theoretical premise that a production function represents the maximum output (level of tax revenue) that a country can achieve given a set of inputs:
Based on the estimated coefficients, the tax effort of individual States is computed as the ratio between actual tax revenue and the corresponding stochastic tax frontier (tax capacity) (Table III.1.1). The tax effort of States ranges between 0.71 to 0.99 during the estimation period, with an average tax effort of 0.81. Capital outlay and development expenditure are found to be positively associated with the tax effort, suggesting that an optimum use of the tax base can create the fiscal space to enhance productive expenditures (Chart III.1.1). | Table III.1.1: Results from SFA | | Explanatory Variable | Dependent Variable: Ln Per capita Real Own Tax Revenue2 | | Coefficient | Z-value | | Ln per capita real GSDP | 2.2*** | 23.7 | | Ln bank credit share of GSDP | 0.4*** | 4.9 | | Ln agricultural share in GSDP | -0.2*** | -2.0 | | Ln literacy rate | 2.6*** | 10.6 | | Ln road density | 0.1*** | 2.6 | | Constant | -25.6*** | -21.0 | | γ* | 3.5*** | 7.9 | | No. of observations | 272 | Notes: (i) *** indicates significance at 1 per cent level;
(ii) γ* refers to the inverse logit of γ.
Source: RBI staff estimates. | References: Advisory Commission on Intergovernmental Relations. (1986). “Measuring State Fiscal Capacity: Alternative Methods and Their Uses”. An Information Report. Washington DC. Aigner, D., Lovell, C. A. K., and Schmidt, P. (1977). “Formulation and estimation of stochastic frontier production function models”. Journal of Econometrics, 6(1), 21-37. Fenochietto, R., and Pessino, C. (2010). “Determining countries’ tax effort”. Revista de Economía Pública, 195-(4/2010), 65-87. Fenochietto, R., and Pessino, C. (2013). “Understanding countries’ tax effort”. International Monetary Fund Working Paper, WP/13/244. Garg, S., Goyal, A., and Pal, R. (2016). “Why Tax Effort Falls Short of Tax Capacity in Indian States: A Stochastic Frontier Approach”. Public Finance Review, 45(2), 232-259. Liu. Y. (2023). “Tall Trees Catch Much Wind? The Effects of Formalization on Fiscal Capacity”. Social Science Research Network. Mikesell, J. (2007). “Changing State Fiscal Capacity and Tax Effort in an Era of Devolving Government, 1981–2003”. Publius: The Journal of Federalism, 37(4), 532-550. | Tax Administration, Tax Compliance, Coverage and Rate Structure of States: Some Issues 3.9 In India, collection of different State taxes, viz., stamp duty and registration fees, sales tax/ VAT, excise duty on alcoholic beverages and motor vehicles tax suffer from a high degree of technical inefficiency (Karnik and Raju, 2015). This is mostly related to the rate structure - stamp duty rates range between 5-8 per cent across States as against the international average of less than 5 per cent. High tax rates lead to high transaction costs, tax evasion and destabilisation of urban land markets (Nayudu, 2019). The current rate structure of GST consisting of four tax slabs – 5 per cent, 12 per cent, 18 per cent, and 28 per cent – also adds to complexity (Debroy, 2022). The motor vehicle tax structure in India lacks uniformity due to different bases for computation and different rates across, leading to varying incidence of taxes per vehicle in different States. Inter-state variations result from the application of ‘lifetime’ and annual tax rates to vehicle categories; use of specific and ad valorem rates; and multiplicity of rates (Purohit and Purohit, 2010). A substantial proportion of the arrears in revenue remains outstanding in courts and other appellate authorities depriving States of potential revenues.3 Tax Reforms by States 3.10 States have undertaken taxation reforms to augment their own tax capacity (Annex II.1). Several States have reset stamp duty rates, revised fair value of land parcels, and introduced e-stamping/ digital stamping of various non-registerable documents. Some States have revised the excise duty on liquor, increased license fees, introduced social security cess on liquor consumption and facilitated digital modes of payment at liquor outlets to boost collections. The most common reforms in motor vehicle taxation include revision of the life tax on vehicles, introduction of green tax/green cess, and implementation of strict enforcement practices by punishing vehicle tax defaulters with hefty penalties. The structure of motor vehicle taxes can be further improvised by the States, taking cues from cross-country practices (Box III.2). For addressing concerns in GST collections and plugging leakages, the reforms undertaken by States include use of artificial intelligence and machine learning (AI-ML) technology and data analytics, creation of tax intelligence / research units, e-governance and, making e-invoicing mandatory for certain taxpayers. 2.2 Own Non-Tax Revenue 3.11 States’ Own Non-Tax Revenue (SONTR) consists of six components viz., general services, social services, economic services, fiscal services, interest receipts, and ‘dividends and profits’. The share of SONTR in total revenue has declined steadily in the last decade, remaining below 10 per cent since 2010-11 (1.3 per cent of GDP in 2022-23) (Chart III.4). Box III.2:
Harnessing Tax Capacity: Cross-Country Evidence National and sub-national governments across countries have undertaken different tax reform measures like tax policy adjustments, technology integration and new environment-based levies to improve tax administration and enhance fiscal capacity. Stamp Duty and Property Registration Fees Stamp duties on property transactions constitute an important source of direct tax revenue for subnational governments in India. Additionally, States levy a registration charge over and above the stamp duty which again varies across States. Cross-country evidence reveals that stamp duty rates in provincial governments in Australia and UAE (Dubai) lie in the range of 3-4 per cent. Canada imposes taxes on property holders rather than levying a one-off stamp duty. Singapore has tiered rates - for permanent residents the rates are 5 per cent for the first purchase, 25 per cent for the second, and 30 per cent for any subsequent ones. Countries like Singapore and Hong Kong have implemented e-stamping processes to streamline the entire procedure from payment to e-certificate issuance, benefiting both revenue authorities and property buyers while fostering taxpayer compliance and creating a business-friendly environment. In India, 19 States/UTs have also incorporated e-stamping processes into their tax systems. Vehicle and Road Taxes Vehicle taxes generally include the duty/taxes applied at the time of purchase of the vehicle and those linked to the actual usage and ownership of the vehicle. Vehicle tax in India mainly comprises Road/VAHAN tax levied by State governments and GST, along with an additional cess levied at the time of purchase and registration of vehicles. Vehicle taxes vary from State to State and are determined by various factors such as nature of the vehicle (private/ company registered), type of fuel consumption (petrol/ diesel), and the price of the vehicle. There is wide variation in vehicle taxes levied by the OECD countries (Table III.2.1). In addition to vehicle taxes, some OECD countries also levy green taxes, based on type, age, fuel efficiency, value of the vehicle, engine power, cylinder capacity and emissions beyond a certain threshold. For instance, Malus tax or Malus fee is levied by Belgium, Canada, France, Italy, and Sweden. Among the Indian States, green taxes are levied by Karnataka (on petrol and diesel vehicles), Maharashtra (older vehicles), Tamil Nadu (vehicles more than 15 years old), Telangana (cars and bikes over 15 years old) and Assam (older vehicles) to protect the environment from pollution. | Table III.2.1: Taxes on Vehicle Purchase and Usage | | I. Taxes/Duties on Purchase and Registration | | Registration Fee/ Taxes | Weight of the vehicle (Australia), size of the engine (New Zealand), type of vehicle (Australia, Colombia, Greece, Ireland, Netherlands), emissions generated (Austria, Ireland, Lithuania, Norway, Spain), age of vehicle (Ireland), value of the vehicle (Costa Rica, Czech Republic, Denmark, Greece), cylinder capacity (Czech Republic, Hungary), engine type (Hungary) and engine power (Italy). | | Luxury car tax | Value of the vehicle (Australia). | | Stamp duty | Weight of the vehicle (Australia) and value of the vehicle (Australia, Costa Rica). | | VAT /GST and Acquisition tax | VAT rates vary from 10 per cent in Japan and Korea to 25 per cent in Denmark. New Zealand levies GST of 15 per cent. Flat rate of 2-7 per cent acquisition tax is levied in Korea. | | Permit fee | Type of vehicle (Czech Republic). | | Transfer of vehicles | Engine capacity (Hungary), value of the vehicle (Costa Rica). | | II. Taxes on Ownership and Usage | | Annual tax on usage | Type of the vehicle (Chile, Colombia), value of the vehicle (Colombia), weight of the vehicle (Japan, Netherlands, Switzerland), emissions and cylinder capacity (Germany), engine capacity (Hungary), fuel type (Netherlands). | | Annual registration fee | Weight of the vehicle (Australia, Canada), purpose of usage, viz., Commercial/Private (Australia, Canada, Mexico), value of the vehicle (Mexico). | | Heavy goods vehicle tax | Weight of the vehicle (Estonia, France). | | Passenger vehicles usage | Emissions and age of the vehicle (France). | | Automobile tax | Cylinder capacity and type of the vehicle (Japan). | | Circulation tax | Emissions (Luxembourg, Sweden), vehicle category and registration period (Slovenia). | | Source: OECD, 2022. | Large Taxpayer Unit Robust tax administration also plays a pivotal role in augmenting a country’s fiscal capacity. Since the 1990s, many emerging market economies (EMEs) have overhauled their tax administration by establishing Large Taxpayer Units (LTUs). The advantages of LTUs include optimizing on staff-to-taxpayer ratios, reducing litigation risks, simplifying processes, and encouraging voluntary tax compliance. LTUs now operate in over 100 developing nations, resulting in significant increase in the tax-to-GDP ratio, starting at 0.5 per cent in the initial year of reform and peaking at 3.6 per cent over nearly two decades (IMF, 2023). Among Indian States, Punjab and Delhi have proposed to set up Tax Intelligence Unit and Tax Policy and Revenue Augmentation Unit (TPRAU), respectively. Technology Driven Solutions Countries worldwide are effectively boosting tax revenue and combating tax evasion through technology-driven methods. For instance, Japan employs Internet Crawlers to gather data on suspected online businesses and cross-reference it with taxpayer information to detect income-reporting discrepancies. Belgium uses web scraping and forensic toolkits for data analysis and employs e-discovery solutions for uncovering evasion patterns. Sweden and Hungary use electronic cash registers equipped with fiscal control units to prevent sales suppression. Likewise, Quebec (Canada) has developed the Sales Recording Module (SRM) to identify sales suppression and tax evasion. Australia and Finland leverage third-party data to uncover potential evasion. Using third-party data, Australia tracks funds in unregistered business activities and Finland monitors e-payments and remote sellers to ensure income reporting compliance. Drawing upon the international experience, the sub-national governments in India can further improvise their tax structure and modernize their tax administration to boost their tax capacity and tax efforts. References: IMF (2023). “Fiscal Monitor”. April 2023. OECD (2017). “Technology Tools to Tackle Tax Evasion and Tax Fraud”. OECD (2022). “Consumption Tax Trends 2022: VAT/GST and Excise, Core Design Features and Trends”. OECD Publishing, Paris, https://doi.org/10.1787/6525a942-en. Global Mortgage Group: https://www.gmg.asia/contact-us/ | 3.12 Economic services are the major source of non-tax revenue for States and their share in SONTR has increased to around 60 per cent in 2021-22 and 2022-23 (Chart III.5). General services, social services and interest receipts4 are the other important components of SONTR. In most of the States, the contributions from fiscal services and receipts from dividend and profit remain insignificant. 3.13 States’ revenue from economic services is mainly generated from industries, power, petroleum, major and minor irrigation projects and forestry and wildlife (Chart III.6). While revenues from industries have increased significantly over the years, the shares of forestry and wildlife have declined.
3.14 Major heads of revenue from social services are medical and public health, education, and urban development (Chart III.7). The shares of revenues from education, sports, art and culture are on the decline. 3.15 There is a wide variation in own non-tax revenue collection across States (Table III.2). Mineral rich States like Odisha, Chhattisgarh, and Jharkhand have a significantly higher share of non-tax revenue than other States, with over 60 per cent of their non-tax revenue coming from mining royalties and premium paid by mines. In Goa, electricity distribution is a departmental activity and electricity charges collected from consumers are a part of government non-tax revenue. In contrast, in most other States, electricity distribution is undertaken by power distribution companies (DISCOMs).
Non-tax Revenue Measures of States and Suggested Reforms 3.16 Growing demand for public expenditures, limitations in expanding tax capacity and limited scope to deviate from common harmonized indirect tax system under the GST regime have induced States to look for opportunities to expand revenue mobilisation from non-tax sources. A major source is user charges on goods and services provided by them. To augment revenues from non-tax sources, reform measures undertaken by State governments include, inter alia, e-auction of mining leases, royalty revision across different segments of mining minerals, revision of the penal rates to curb secret mining and related activities, land monetisation, revision of water rates for industrial use, and improved financial management of the State public sector enterprises (Annex II.2). With the upward revision of electricity tariffs by various States, the under-recovery has come down from ₹0.69/kWh in 2020-21 to ₹0.22/kWh in 2021-22 (GoI, 2022). Smart and pre-paid metering in power distribution may help in further improving billing and collection efficiency, with a commensurate impact on lowering Aggregate Technical and Commercial (AT&C) losses (Box III.3). Box III.3:
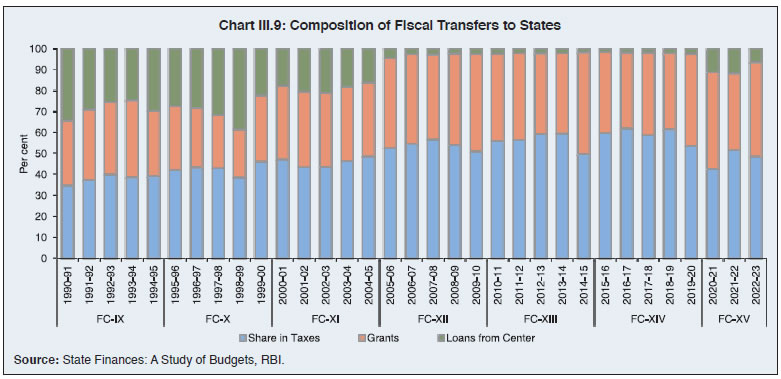
Power Distribution Reforms – The Current Status and Way Forward Power distribution has strained State finances due to persistent operational inefficiencies and significant under-recoveries. Receipts from the power sector constitute less than a tenth of the corresponding revenue expenditure incurred by the States (Chart III.3.1a). In addition, States collect taxes and duties on electricity. Adding the latter to power sector revenues improves the ratios, although they still remain sub-optimal for majority of the States (Chart III.3.1b). 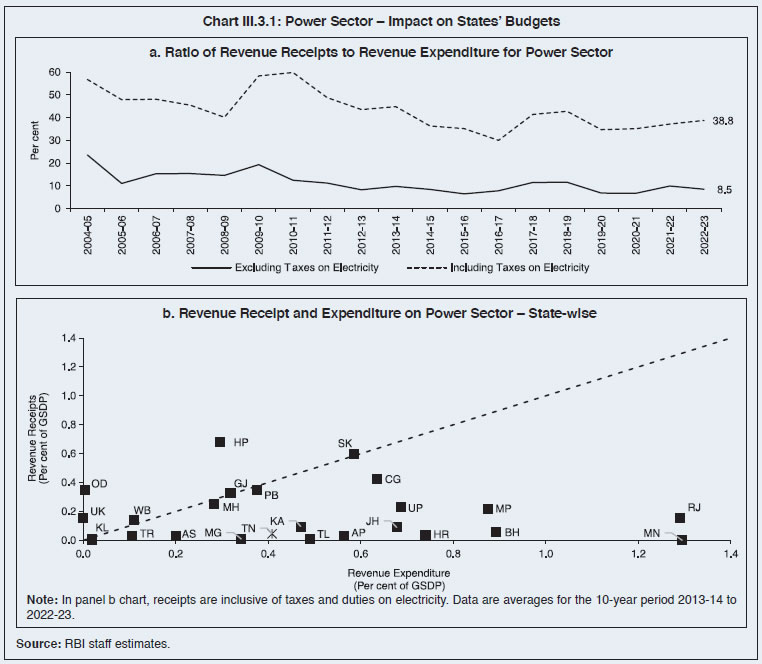 Power Distribution Companies (DISCOMs) in India grapple with several challenges, including low tariff rates, high procurement costs of power, cross-subsidisation, and the dominance of State authorities which limits decision-making autonomy. In recent years, the Centre has initiated several reform measures to address these issues, including the Revamped Distribution Sector Scheme (RDSS), the Late Payment Surcharge Rules of 2022, Additional Prudential Norms for lending by financial institutions, the National Smart Grid Mission, and mandatory energy accounting and auditing. As a result, the aggregate technical and commercial (AT&C) losses, which comprise energy losses due to technical factors, theft, inefficient billings and ‘commercial losses’ resulting from payment defaults and inefficiencies in the collection of user charges, have declined substantially (Chart III.3.2a). Despite this progress, AT&C losses in India still exceed international benchmarks for most of the States (Chart III.3.2.b and c). 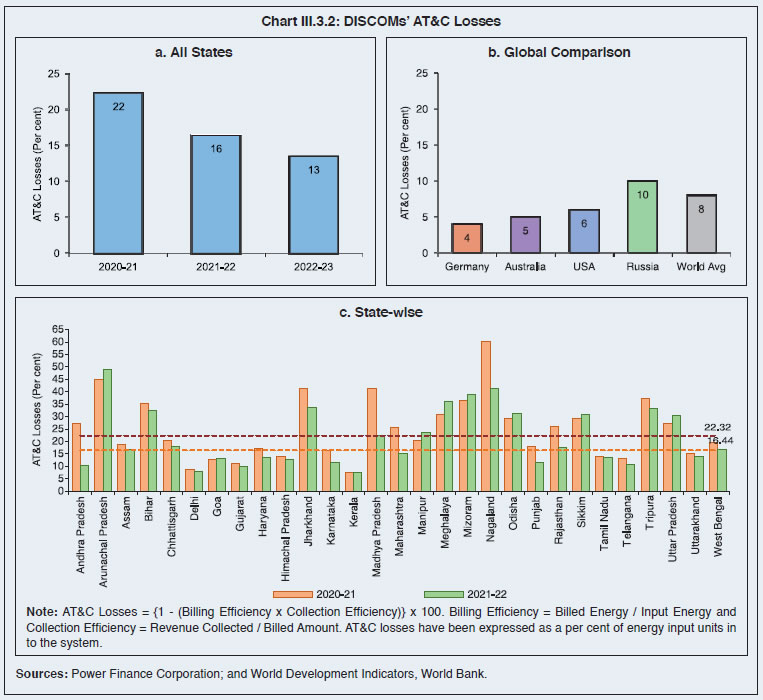 The international experience shows that successful public DISCOMs generally enjoy financial and regulatory independence for setting tariffs, often with active involvement from the local community (Prasanth and Rakesh, 2021). Latin American countries encourage private sector participation, whereas Asian countries like Bangladesh, Sri Lanka, South Korea and Vietnam have implemented progressive tariff structures, typically resulting in higher rates for the wealthy relative to the less affluent (GoI, 2016). In the USA and Germany, the success of power utilities has been attributed to decentralised models where municipal governments oversee and operate the DISCOMs. Reforms drawing from such global best practices would help DISCOMs to further strengthen their financial and physical performance. References: GoI (2023). “National Level AT&C Losses in Power Network down from 22.3% in 2020-21 to 16.4% in 2021-22”. Ministry of Power, PIB. GoI (2016). “Economic Survey 2015-16”. Ministry of Finance. Kala, R.R. (2023). “AT&C losses decline to 13.5% in FY23”. The Hindu Business Line, June 22. Regy, P., Sarwal, R., Stranger, Fitzgerald, C.G., Ningthoujam, J., Gupta, A., Singh, N. (2021). “Turning Around the Power Distribution Sector - Learnings and Best Practices from Reforms”. NITI Aayog. August 2021. | 3.17 In the case of social services such as education and health which are merit in nature, full cost recovery may not always be possible or desirable. In such cases, user charges should at least recover the operation and maintenance (O&M) costs of infrastructure assets deployed for social services. Proper pricing of water has also assumed importance in view of the fast depletion of groundwater levels and excessive usage/ wastage of water in many States. An appropriate pricing of water – for example, volumetric water charges instead of charging a flat rate - would help in economising the use of water and promote environmental sustainability (TERI, 2010). 3. Inter-Governmental Transfers 3.18 In a federal set up like India, resource collection powers typically reside with the Central government due to economies of scale and the need for uniformity in taxation. While lower-level governments are better suited to address local needs and excel in project execution, they typically have more expenditure responsibilities and fewer revenue-raising capacities. For instance, in India, the Union government has the power to levy major taxes such as income tax, corporation tax and excise duties while States can levy taxes such as stamp duty, registration fees, VAT/sales tax on petroleum products and excise duty on liquor. By contrast, States have major expenditure responsibilities, especially economic and social services such as health, education, law and order leading to vertical fiscal gap, a common feature in many federal countries (Kurian, 2008; Panda, 2019). Vertical fiscal imbalance in India is higher than in countries like Brazil and Canada with Indian States collecting 37 per cent of general government taxes while spending 64 per cent of total expenditure (Chart III.8). Furthermore, within a country, regional disparities due to structural, fiscal, historical, or governance factors can lead to differences in fiscal capacities and financing needs among sub-national governments, resulting in varying fiscal gaps, or horizontal fiscal imbalances. Inter-governmental transfers are designed to mitigate these vertical and horizontal inequities across different levels of government. 3.19 Under Article 280 of the Indian Constitution, the Finance Commission recommends transfer of resources from the Centre to the States to address vertical and horizontal fiscal imbalances. The transfer of resources from the Centre to States in India takes place through three primary channels viz., (i) tax devolution recommended by the Finance Commission under Article 270; (ii) grants recommended by the Finance Commission under Article 275 (e.g., post devolution revenue deficit grants and grants for local bodies); and (iii) grants and loans from Centre to States outside the recommendations of the Finance Commission under Articles 282 and 293, respectively (e.g., support for centrally sponsored schemes and interest free loans to States for capital expenditure). Composition-wise, tax devolution has the largest share in the total transfers, even though the share of grants (under Articles 275 and 282) has increased over time with the increase in centrally sponsored schemes. Following the recommendations of the Twelfth Finance Commission, the Union government refrained from acting as an intermediary for borrowing of the States, which has resulted in a decline in the share of loans in total transfers. However, with back-to-back loan in lieu of GST compensation for the years 2020-21 and 2021-22 and introduction of the ‘Scheme for Special Assistance to States for Capital Investment’ in 2020-21, the share of loans in total transfers has increased again (Chart III.9). 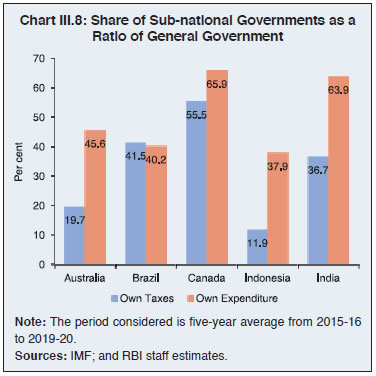
 3.20 States’ dependence on fiscal transfers, reflected in the share of transfers in total expenditure, increased sharply during the pandemic-period of 2020-21 and 2021-22 but it has moderated to 40 per cent in 2022-23 (Chart III.10). Even though the transfers help the State governments to undertake higher expenditures, they could adversely impact their tax effort and collection of own tax revenues (Jha et al. 2000; Kim 2007; Liu and Zhao 2011; Garg et. al., 2016). 3.1 Tax Devolution 3.21 The tax devolution from the Centre to the States under various Finance Commissions can be divided into two main phases. In the first phase, the period up to the Tenth Finance Commission (1952 to 2000), the Constitution provided for mandatory sharing of net proceeds of only two types of taxes, income tax and Union excise duties (Table III.3). Thereafter, with the 80th Amendment of the Constitution in 2000, the divisible pool of taxes was considerably widened and all taxes in the Union List (except the duties and taxes referred to in Articles 268, 269 and 269-A, surcharges and any cess levied for a specific purpose under an Act of Parliament) became shareable with States from the Eleventh Finance Commission (FC-XI) onwards (Reddy and Reddy, 2019). 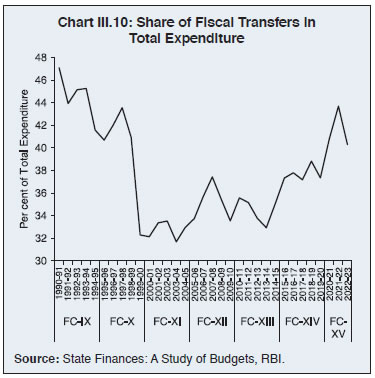
| Table III.3: States’ Share in the Divisible Pool of Central Taxes Recommended by Finance Commissions | | Finance Commission | States' Share in the Net Proceeds of Income Tax (per cent) | States' Share in the Net Proceeds of Union Excise Duties (per cent) | States' Share in All Shareable Union Taxes (per cent) | | First | 55.0 | 40.0 (3 commodities) | | | Second | 60.0 | 25.0 (8 commodities) | | | Third | 66.7 | 20.01 (35 commodities) | | | Fourth | 75.0 | 20.0 (all commodities) | | | Fifth | 75.0 | 20.0 (all commodities) | | | Sixth | 80.0 | 20.0 (all commodities) | | | Seventh | 85.0 | 40.0 (all commodities) | | | Eighth | 85.0 | 45.02 (all commodities) | | | Ninth | 85.0 | 45.0 (all commodities) | | | Tenth | 77.5 | 47.53 (all commodities) | | | Eleventh | | | 29.54 | | Twelfth | | | 30.5 | | Thirteenth | | | 32.0 | | Fourteenth | | | 42.0 | | Fifteenth | | | 41.0 | Notes:
1 20 per cent of the net proceeds of excise duties on motor spirits was earmarked as a special-purpose grant for the maintenance and improvement of communications.
2 Of this, 5 per cent was earmarked for post-devolution deficit States.
3 7.5 per cent was earmarked for deficit States.
4 Of this, 1.5 per cent is on account of additional excise duties in lieu of sales tax on sugar, textiles and tobacco.
Sources: Various Finance Commission Reports; and Reddy and Reddy (2019). | 3.22 The FC-XI (2000-01 to 2004-05) recommended States’ share in the divisible pool of taxes at 29.5 per cent. Since then, successive Finance Commissions have made increments in the devolution ratio, with FC-XIV making a radical departure by recommending a significantly higher share in view of the abolition of the Planning Commission and cessation of plan grants, thus making tax devolution the primary vehicle for federal transfers (RBI, 2021). Nevertheless, the actual tax devolution to States has trailed the recommended share due to cesses and surcharges that are excluded from the divisible pool of Union taxes (Chart III.11). 3.23 The Constitution requires the Finance Commission to make recommendations for the distribution of net proceeds of taxes between Union and States (vertical devolution) as well as the allocation among the States of such proceeds (horizontal devolution). Over the years, altogether twelve criteria have been adopted by Finance Commissions for determining horizontal devolution across States (Reddy and Reddy, 2019). Population has been used as a criterion by all Finance Commissions because the larger the population of a State, the greater would be its expenditure needs. The area of a State was introduced as a criterion by FC-X as it was felt that the cost of providing basic administrative infrastructure and services is higher in States which have a larger area and lower density of population (Table III.4). Forest cover was introduced by FC-XIV as a measure of fiscal disability because even though forests provide ecological benefits, there is an opportunity cost associated with them in terms of area not available for other economic activities. 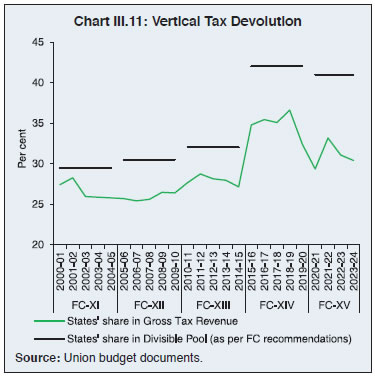
| Table III.4: Weights for Horizontal Devolution Prescribed by Various Finance Commissions | | (Per cent) | | Criteria | Principle | FC-X | FC-XI | FC-XII | FC-XIII | FC-XIV | FC-XV | | Population | Need | 20.0 | 10.0 | 25.0 | 25.0 | 17.5 | 15.0 | | Demographic Change | - | - | - | - | 10.0 | 12.5 | | Area | 5.0 | 7.5 | 10.0 | 10.0 | 15.0 | 15.0 | | Forest Cover | Fiscal Disability | - | - | - | - | 7.5 | 10.0 | | Income Distance | Equity | 60.0 | 62.5 | 50.0 | 47.5 | 50.0 | 45.0 | | Index of Infrastructure | Efficiency | 5.0 | 7.5 | - | - | - | - | | Tax Effort | 10.0 | 5.0 | 7.5 | - | - | 2.5 | | Fiscal Discipline | | 7.5 | 7.5 | 17.5 | - | - | | Sources: Finance Commission Reports; and Reddy and Reddy, 2019. | 3.24 Income distance, defined as the distance of State’s per capita GSDP from the State with the highest per capita GSDP, remains the dominant criterion for determining horizontal devolution based on equity considerations. The index of infrastructure, introduced by FC-X to help States with poor infrastructure, was discontinued from FC-XII. FC-X introduced tax effort as a criterion for horizontal devolution to reward States with higher tax collections. Additionally, FC-XI introduced fiscal discipline as a criterion to motivate the States for undertaking fiscal consolidation. However, these efficiency criteria were removed by FC-XIV, while FC-XV assigned a weight of only 2.5 per cent to tax effort. Overall, from FC-X to FC-XV, there has been an increase in the share of need-based parameters while both equity- and efficiency-based parameters have seen a decline in their weights (Chart III.12). Impact of Cess and Surcharge 3.25 A cess is a special kind of tax levied by the Government to raise funds for a pre-determined earmarked purpose. This earmarking protects certain categories of expenditures from the vagaries of the political process by linking them to a particular revenue source (McCleary, 1989). On the other hand, in case of surcharge - a tax on tax - there is no requirement to stipulate the purpose or end use at the time of levy. In India, surcharges have typically been levied on the highest income tax rate slabs to ensure that a greater share of the tax burden rests on the relatively well-off taxpayers. While cess and surcharge are fundamentally distinct concepts, under Article 270 of the Indian Constitution, the revenue collected from both cess and surcharge are at the exclusive disposal of the Union government, i.e., these taxes are not required to be shared with the State governments. The revenue collected by the Union government from cesses increased from 6.4 per cent of its gross tax revenue in 2011-12 to 17.7 per cent in 2021-22 (Chart III.13). 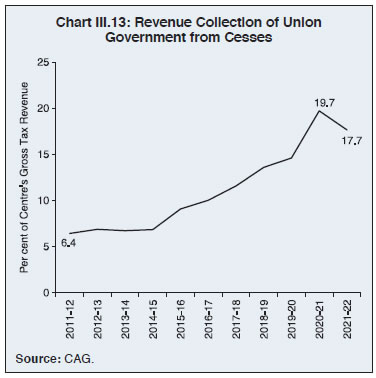 3.26 Major cesses currently in place include health and education cess levied at the rate of 4 per cent on income tax and corporation tax with an aim to improve the healthcare and educational facilities in rural and semi-urban areas; cess at the rate of 20 per cent on domestic production of crude oil and natural gas to meet the objectives set out in the Oil Industry (Development) Act, 1974; road and infrastructure cess levied as an additional duty of excise for the purpose of financing infrastructure projects; agriculture infrastructure and development cess levied as an additional duty of excise for the purpose of financing agricultural infrastructure and other development expenditure; and GST compensation cess on the supply of select goods, mostly belonging to luxury and demerit categories, for providing compensation to the States for the loss of revenue arising on account of implementation of the goods and services tax as per the provisions laid down in the Goods and Services Tax (Compensation to States) Act, 2017 (Table III.5). 3.27 Major surcharges levied by the Union government include surcharge on personal income tax for those with taxable income more than ₹50 lakh and surcharge on corporate income tax for those companies whose net income exceeds ₹1 crore. Due to increase in cesses and surcharges, the divisible pool has shrunk from 88.6 per cent of gross tax revenue in 2011-12 to 78.9 per cent in 2021-22 despite the 10 percentage point increase in tax devolution recommended by FC-XIV (Chart III.14a). The actual tax devolution to States hovered in the range of 3-4 per cent of GDP during the award period of FC-XIV and FC-XV as compared with around 2.7 per cent during the previous three finance commissions (Chart III.14b). Since the actual tax devolution hinges critically on the cesses and surcharges levied by the Centre, the States need to augment their own fiscal capacity and reduce dependence on transfers. 3.2 Grants from the Centre 3.28 States also receive funds by way of grants from the Centre, most important among them being the Centrally Sponsored Schemes (CSSs) and the Finance Commission grants. CSSs are special purpose grants extended by the Central Government to encourage and motivate the State governments to plan and implement programs that help attain national goals and objectives. The Finance Commission grants primarily function as general purpose grants, aimed at bridging the gap between a State’s assessed expenditure and projected revenue. Over time, however, the nature and purpose of these grants have evolved to address other specific issues such as modernisation of administration, relief from natural calamities and other public purposes. Total grants from the Centre to the States have increased considerably during the last two decades (Chart III.15a). The CSSs, which have received a major push from the Centre in the post-COVID period, now account for around two-thirds of the total grants (Chart III.15b). On the other hand, the Finance Commission grants constitute only around a quarter of the total grants from the Centre. | Table III.5: Collections from Major Cesses Levied by the Union Government | | (₹ crore) | | Year | Health and Education Cess | Cess on Crude Oil | Road and Infrastructure Cess | GST Compensation Cess | Agriculture Infrastructure and Development Cess | Others | Total | | 2017-18 | 31,656 | 13,579 | 84,038 | 62,612 | - | 30,423 | 2,22,308 | | 2018-19 | 41,310 | 17,814 | 1,10,854 | 95,081 | - | 17,904 | 2,82,963 | | 2019-20 | 39,241 | 14,062 | 1,22,440 | 95,553 | - | 22,659 | 2,93,955 | | 2020-21 | 35,895 | 10,894 | 2,35,783 | 85,192 | - | 32,185 | 3,99,949 | | 2021-22 | 52,750 | 19,354 | 1,95,987 | 1,04,769 | 76,951 | 28,869 | 4,78,680 | Note: Others include social welfare surcharge and universal service obligation.
Source: CAG. |
3.29 The FC-XV recommended grants-in-aid amounting to ₹10.3 lakh crore for the five-year period 2021-26. Of this, 42.3 per cent were earmarked for local governments, while 29 per cent were revenue deficit grants. The actual transfers during the first two years of FC-XV are marginally lower than the recommended amount (Chart III.16). 3.30 At a disaggregated level, hilly and north-eastern States are more dependent on Central transfers due to limited sources of own revenue. For many of these States, the Central grants account for more than 30 per cent of total revenue receipts. Among the larger States, Assam, Punjab, Andhra Pradesh, West Bengal, Madhya Pradesh, Bihar and Kerala are most reliant on the Central transfer, with a fifth of their revenue coming in the form of grants (Chart III.17). 4. Concluding Observations 3.31 Growing public expenditure of States makes it an imperative to step up their revenue mobilisation efforts. The implementation of GST has been beneficial in this regard in view of increased tax buoyancy. The overall tax efforts of States in India are found to be fairly high. Nonetheless, they need to invest in augmenting fiscal/tax capacity by undertaking tax reforms and building a strong and innovative tax administration. Furthermore, there is considerable scope for increasing States’ non-tax revenue by periodic revisions of user charges on electricity and water and other public services, royalties and premia from mining and improved financial management of State PSUs. From a longer-term policy perspective, States would benefit from augmenting their own fiscal capacity while reducing dependence on transfers.
| Annex II.1: Recent Tax Reforms by States | | Tax Category | State | Reform Measures | | Stamp Duty and Land Registration Fees | Andhra Pradesh | • Revision of market values on registration of land parcels ranging from 5 per cent to 75 per cent. | | Telangana | • Setting up of DHARANI portal for speedy disposal of cases.
• Revision of stamp duty rates on certain transactions like exchange of property, gifts to members of family, construction agreements, partition and settlement cases and various sale agreements. | | Karnataka | • Budget proposal to develop a scientific and rational guidance value system using Karnataka Geographic Information System (K-GIS) to ensure online availability of guidance value for each property for citizens.
• Budget proposal to make E-stamping/digital stamping of various non-registerable documents like agreements, bank guarantees, share certificates and bank documents compulsory. | | Kerala | • Budget proposal to increase stamp duty rates from 5 per cent to 7 per cent and increase the existing fair value of land by 20 per cent. | | Goa | • Budget proposal to make e-stamping mandatory for all transactions above ₹ 9,999 involving non-judicial stamp paper. | | Excise Duty | Andhra Pradesh | • Establishing digital mode of payment at all liquor outlets based on New Excise Policy, 2022-23.
• The sale of bar licenses through e-auctions after fixing a reserve price for each outlet. | | Sikkim | • ‘E-Abkari’ project for facilitating online application and renewal of excise licenses, online registration of labels and online permits. | | Tamil Nadu | • Revision of excise duty on Indian made foreign spirit brands and beer brands.
• Revision of license fee, application fee, privilege fee in several areas of liquor industry. | | Karnataka | • Increase in additional excise duty on Indian Made Liquor (IML) by 20 per cent on all 18 slabs. | | Kerala | • Levy of social security cess at the rate of ₹ 20 for each bottle of Indian made foreign liquor having maximum retail price (MRP) of ₹500-₹999. | | Motor Vehicle Tax | Karnataka | • Simplification of Karnataka Motor Vehicle Tax Act.
• Introduction of a simplified software for accurate verification of motor vehicle tax.
• Revision of current tax on certain categories of vehicles. | | Kerala | • Increase in one-time tax on newly purchased motor cars and private service vehicle for personal use. | | Goa | • Levy of Green cess for non-Goan Vehicles entering Goa. | | Telangana | • Increase in life tax on different categories of vehicles.
• Strict enforcement by punishing vehicle tax defaulters with hefty penalties going up to 200 per cent. | | Andhra Pradesh | • Budget proposal to enhance the quarterly tax by 20-25 per cent on transport vehicles like taxis, trucks and buses along with increasing the life tax and green tax on two- and four-wheelers. | | GST | Delhi | • Created centralized GST registration cell ‘Sewa Kendra’ to improve the registration process, combat tax evasion and boost revenue.
• Made e-invoicing mandatory for taxpayers, who have an aggregate turnover exceeding ₹10 crores.
• Established a cell to collect information about fake firms.
• Monitor monthly performance in tax collections using GST Analytics and Intelligence Network (GAIN)/ Business Intelligence and Fraud Analytics (BIFA).
• Budget proposal to set up a dedicated Tax Policy and Revenue Augmentation Unit (TPRAU) to identify revenue growth opportunities, detect leakages, and help in policy formulation. | | Telangana | • Created a separate tax research unit to analyse sector wise variance, effective parameter for investigation/audit and tax evasion methodologies adopted by taxpayers.
• Introduced ‘My Bill- My Rights’ scheme to raise awareness among public to ask for bill for purchase of goods and services. | | Karnataka | • Created new Divisions and uses Artificial Intelligence and Machine Learning for data analytics. | | | West Bengal | • Adopted e-governance initiatives like e-registration, e-filing of returns and e-payment of taxes to simplify procedures and reduce compliance costs.
• Introduced intelligence-based data analysis to plug revenue leakages. | | Punjab | • Budget proposal to set up Tax Intelligence Unit to develop systemic tools for detection and recovery of tax evasions and non-compliances by the obligated taxpayers.
• Budget proposal “Bill Leyao Inaam Pao” Scheme in FY 2023-24 to formalize financial transactions and incentivize customers along with educating them. | Source: State governments. |
| Annex II.2: Recent Non-Tax Revenue Reforms by States | | State | Reform Measures | | Andhra Pradesh | • Transparency in mining leases.
• E-auction in mining.
• Land monetization. | | Haryana | • Improved financial management of State public sector enterprises. | | Kerala | • Royalty revision across all segments of minor minerals.
• Price differential system for granite (building stone) and dimension stones (granite) based on the type and size of rocks.
• Combine the operational charges and royalty to a single rate and link it to the value of the minerals.
• Revise the penal rates to curb the clandestine mining and related activities.
• Royalty payment based on actual usage and not based on the tonnage or carrying capacity of the vehicle.
• The lease rent of the government land to be a function of the fair value of the land.
• Discontinuation of compounding system and introduction of quantity-based royalty system. | | Odisha | • Creation of a separate Directorate of Minor Minerals under Revenue & Disaster Management Department for scientific and sustainable management of minor minerals.
• Use of electronic auction and new premium policy to augment mining revenue.
• Suitable amendments of Odisha Irrigation Rules, 2016 to enhance Industrial Water Rate (License and special water rate) automatically by 10 per cent annually. | | Telangana | • E-auction of large parcels of land. | | Source: State governments. |
|