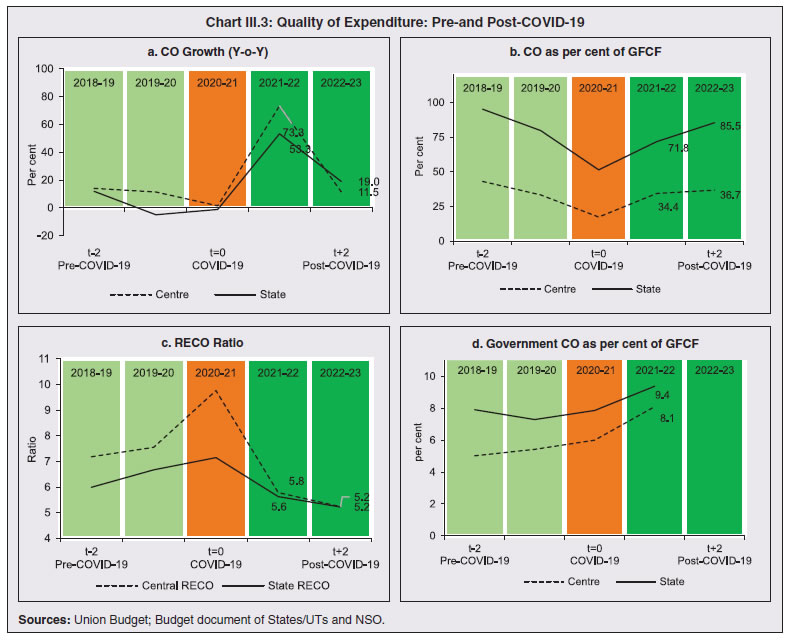
1. Introduction 3.1 Capital formation refers to the process by which resources are invested in assets like plants, equipment, machinery, transportation assets, electricity and other physical assets as well as in human capital through education, health, skill development, scientific advancement, and research. These investments increase the economy’s productive capacity, ensure fuller absorption of unutilized labour and other natural resources, and promote efficiency-raising innovation. Endogenous growth theory holds that investment in human capital, innovation and knowledge is a key contributor to economic growth. Empirical evidence reveals that an increase in physical capital affects the stock of human capital and vice versa (Amir et al., 2017). 3.2 As government institutions play an essential role in catalysing investment in education, skill development, healthcare, infrastructural capacity, and research and development (R&D), this Chapter examines the role played by State governments in India in shaping capital formation. Section 2 delves into trends in capital expenditure by States and presents stylized facts relating to the expenditure quality of the States. A composite index of States’ quality of expenditure helps in this assessment. The impact of States’ capex on social services and infrastructure on sectoral productivity growth is analysed in Section 3, while Section 4 probes into physical capital formation by States. Policy incentives and governance reforms to attract private and foreign capital are discussed in Section 5. Horizontal spillovers of each State’s capex on other’s are explored in Section 6. Section 7 concludes with key findings. 2. Capital Expenditure by States 3.3 India has one of the highest investment rates in the world (World Indicator Database of the World Bank). India’s capital investment/GDP ratio of 31.2 per cent in 2021 is higher than other BRICS nations (Chart III.1a). 3.4 Sectoral decomposition of investment reveals that the households and private corporations together accounted for more than 70 per cent of gross capital formation in India, whereas the share of general government, i.e., the Central and the State governments taken together remained in the range of 10-12 per cent during the period 2016-17 to 2019-20 (Chart III.1b). Public sector enterprises accounted for around 10 per cent of total capital formation in the economy. During the last three years, there has been a distinct shift in the compositional pattern of government expenditure in India in favour of capex. As against the 30-year average of States’ capital outlays (CO) at 1.9 per cent of GDP (as against 1.4 per cent for the Centre), Central and State capital outlays reached 2.3 per cent and 2.7 per cent of GDP, respectively, in 2021-22 (RE) (Chart III.2). Adjusting for the Centre’s capital outlay towards defence, the States’ share in general government capital outlay has averaged at around 70 per cent. Empirical evidence points to higher multipliers of State capex relative to that of the Centre (Jain and Kumar, 2013). 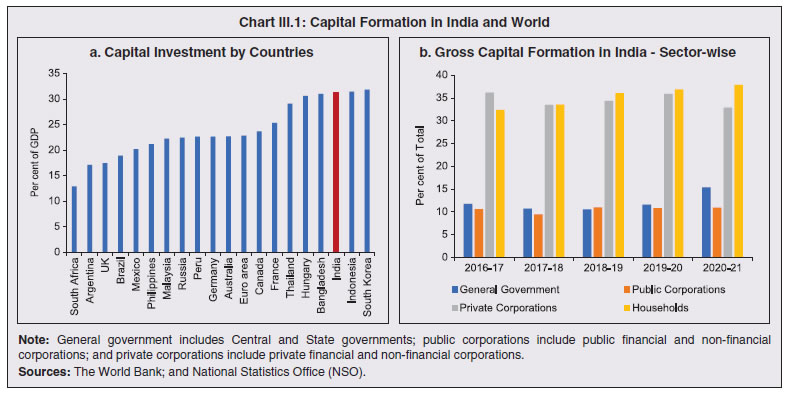 3.5 It has also been observed that it is capital spending which has a stronger impact on medium to long-term growth (RBI, 2019). The sharp rise in capex growth during 2021-22 and 2022-23 (BE) has raised the share of capital outlay in States’ gross fiscal deficit (GFD), which reflects an improvement in the quality of expenditure (Chart III.3a and III.3b; Box III.1). This has brought down the revenue expenditure to capital outlay (RECO) ratio for the States to a multi-year low in 2022-23 (BE) (Chart III.3c). With such an aggressive capex boost, the general government’s relative share in total gross fixed capital formation (GFCF) has also gone up since 2020-21 (Chart III.3d). 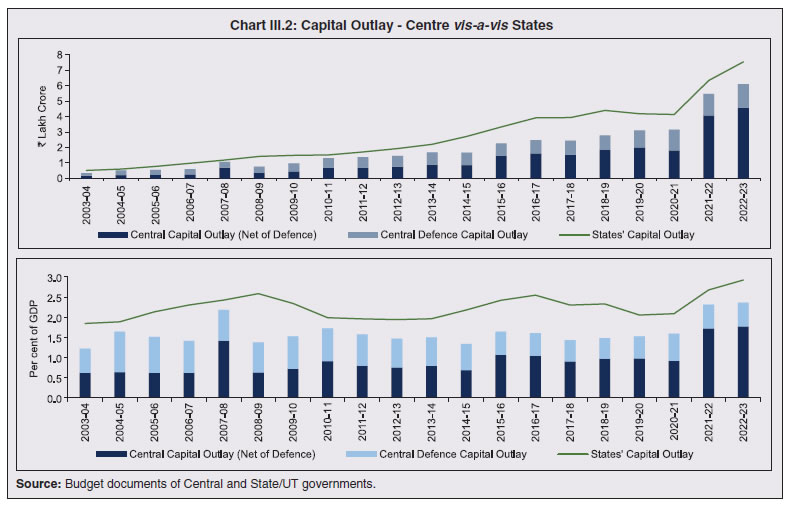
Box III.1:
A Composite Index of Quality of Expenditure of States An improvement in the quality of public spending pursued through higher share of productive expenditure is key to supporting medium-term growth, maintaining fiscal sustainability and containing inflationary pressures (Gupta et al., 2005; Cabezon et al., 2020; and Misra et al., 2021). While capital spending can induce high multiplier benefits, crowd-in private investment and ease critical supply constraints, expenditure on health, education, research and development can boost productivity and increase potential growth (European Commission, 2012; Bose and Bhanumurthy, 2013; and Cordes et al., 2015). Accordingly, the relative shares of capital/developmental spending, expressed in terms of various ratios such as (i) capital outlay to total expenditure; (ii) capital outlay to GDP; (iii) development expenditure to GDP; and (iv) revenue expenditure to capital outlay (RECO) are commonly used in the literature to assess the quality of public spending. The ratio of revenue deficit to the gross fiscal deficit (RD-GFD) is also used as an indicator of the quality of expenditure as it indicates the proportion of borrowed resources exhausted on revenue expenditure rather than on growth-oriented investment (GoI, 2021). All these variables have been chosen to represent the quality of government spending in a summary measure (Chart 1). Using a dynamic factor model (DFM)1,2, a common factor is extracted from these five indicators to obtain a composite index that can capture the quality of spending (Stock and Watson, 1989; 1991). The unobserved factor in the model is estimated by using the following specification: 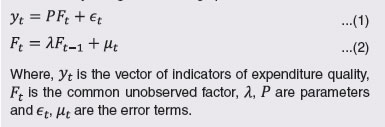 The composite index of the quality of public expenditure or the QPE Index shows an improvement from 2003-04 to 2007-08, suggesting that the fiscal responsibility legislations (FRL)-led fiscal adjustments did not compromise on the quality of spending. In fact, fiscal correction was aided by higher growth and the resultant increase in tax revenue buoyancy (RBI, 2011). The quality of spending improved during 2008-11, even with fiscal policy turning expansionary to counter the impact of the global financial crisis on the economy. The QPE Index deteriorated in 2011-12 as post-crisis consolidation led to a reduction in productive spending and this was arrested only after 2014-15. The quality of expenditure improved from 2015-16 to 2017-18 but again started deteriorating from 2018-19, as the economic slowdown led to lower tax mobilisation during 2019-2021, prompting a retrenchment in productive expenditures to meet fiscal targets (RBI, 2021). During 2021-22, the States have improved their quality of expenditure, supported by buoyant growth in tax revenues, higher tax devolution from the Centre, and long-term interest-free loans extended by the Centre for capex (Chart 2). Pair-wise cross-correlations of the QPE index and real GDP show that the two series tend to co-move (Chart 3).
QPE leads GDP, as reflected in the positive and statistically significant correlation coefficients across lags (up to two years). The positive impact of quality of spending on GDP becomes insignificant after two years. The overall association in the two series is reflected by a statistically significant contemporaneous correlation coefficient of 0.58, highlighting the need to prioritise productive expenditures to build a sustainable growth trajectory. Given that the States account for around 60 per cent of total capital expenditure as well as overall development spending, an improvement in the quality of expenditure of State governments could crowd in private investment, spur economic growth and raise living standards. References Bose, S. and Bhanumurthy, N.R. (2013). “Fiscal Multipliers for India”. National Institute of Public Finance and Policy Working Paper No. 2013-125, September. Cabezon, E., Tumbarello, P., and Wu, Y. (2020). “Strengthening fiscal frameworks and improving the spending mix in small states”. In Handbook of Governance in Small States (pp. 301-328). Routledge. Cordes, T., Kinda, T., Muthoora, P. and Weber, A. (2015). “Expenditure Rules: Effective Tools for Sound Fiscal Policy?”. Working Paper 15/29, International Monetary Fund. European Commission (2012). “The Quality of Public Expenditures in the EU”. Occasional Paper, 125, December. GoI (2021). Fifteenth Finance Commission Report, Government of India. Gupta, S., Clements, B., Baldacci, E. and Mulas-Granados, C. (2005). “Fiscal policy, expenditure composition, and growth in low-income countries”. Journal of International Money and Finance, 24(3), 441-463. Misra, S., Behera, S. R., Seth, B. and Sood, S. (2021). “Fiscal Framework and Quality of Expenditure in India”. RBI Bulletin, June. RBI (2011). “State Finances: A Study of Budgets of 2010-11”. Reserve Bank of India, March. RBI (2021). “State Finances: A Study of Budgets of 2021-22”. Reserve Bank of India, November. Stock, J. H., and Watson, M. W. (1989). “New indexes of coincident and leading economic indicators”. NBER macroeconomics annual, 4, 351-394. Stock, J. H., and Watson, M. W. (1991). “A probability model of the coincident economic indicators”. In Leading Economic Indicators: New Approaches and Forecasting Records, ed. K. Lahiri and G. H. Moore, 63–89. Cambridge: Cambridge University Press. | 3.6 Generally, the actual capital outlay of States during a year is considerably lower than the budget estimates made at the beginning of the year (Chart III.4a). In 2020-21, States were able to execute only 69 per cent of their budgeted capital outlays. The deviation from budgetary targets is comparably much smaller for revenue expenditure, which is mostly committed in nature (Chart III.4b). State governments in India often sacrifice capital outlays during business cycle downturns to contain overall spending for achieving their deficit targets (Mukherjee, 2013). 3.7 Fiscal marksmanship relating to capital outlay varies significantly across States. While the average capex cut vis-à-vis budget estimates for the 3-year period from 2017-18 to 2019-20 was 21.3 per cent (cumulatively for all States), States and UTs like Jammu and Kashmir, Goa, Tripura, Punjab, Andhra Pradesh and Delhi have cut their budgeted capex by more than 40 per cent (Chart III.5). 3.8 The highly skewed monthly distribution of capital outlay by States poses another cause for concern (Chart III.6). During the last five years, on average, States were able to spend only a third of their full year spending during H1, with more than a quarter of the total spending being undertaken in the last month i.e., March. This suggests a residual approach to spending.
3.9 At a disaggregated level, Uttar Pradesh, Maharashtra, Madhya Pradesh, Karnataka and Tamil Nadu together account for more than 40 per cent of the combined capital outlay undertaken by all States (Chart III.7a). States like Uttar Pradesh, Odisha, Assam and Jharkhand have a relatively higher share of capital outlays in comparison to the size of their economies (Chart III.7b). Furthermore, States’ quality of expenditure, measured in terms of RECO ratio, appears to be inversely related to their level of indebtedness (Chart III.7c). 3. Human Capital Formation: Spending on Education and Health 3.10 Education and health play a critical role in building human capital, with a positive impact on economic growth through an increase in labour productivity (Hosoya, 2012) (Box III.2). In India, both the government and the private sectors are involved in providing health and education services to the people. Divergences in economic growth among Indian States are found to be related to the differences in spending on education and health as well as the creation of physical infrastructure that promote growth (Nauriyal and Sahoo, 2010; World Bank, 2006). Box III.2:
Capex and Productivity Growth – A State-level and Sectoral Analysis States’ capital outlay can play an important role in boosting labour productivity through two important channels – creation of capital (both physical and human capital) and raising the total factor productivity (TFP). Average capital outlay of the States as per cent of their total expenditure has, however, declined between 2005-10 and 2015-20 (Chart 1). Capital outlay can be sub-divided into development and non-development components. The former constitutes more than 90 per cent and comprises outlays on social and economic services (Table 1). Developmental capital outlay can be divided into the following categories: a) social services; b) agriculture and allied activities, rural development, special area programmes, major and medium irrigation, and flood control; c) industry and minerals; d) research and development – science, technology and environment; e) infrastructure – energy, transport and communication; and f) other economic services. 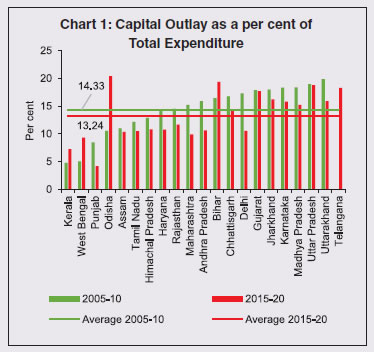
| Table 1: Sector-wise Developmental Capital Outlay | | Social Services (1 to 9) | Economic Services (1 to 10) | | 1. Education, Sports, Art and Culture | 1. Agriculture and Allied Activities | 5. Energy | | 2. Medical and Public Health | i) Crop Husbandry | 6. Industry and Minerals | | 3. Family Welfare | ii) Soil and Water Conservation | i) Village and Small Industries | | 4. Water Supply and Sanitation | iii) Animal Husbandry | ii) Iron and Steel Industries | | 5. Housing | iv) Dairy Development | iii) Metallurgical Industries | | 6. Urban Development | v) Fisheries | iv) Others | | 7. Welfare of Scheduled Castes, Scheduled Tribes and Other Backward Classes | vi) Forestry and Wildlife | 7. Transport | | 8. Social Security and Welfare | vii) Plantations | i) Roads and Bridges | | 9. Others | viii) Food Storage and Warehousing | ii) Others | | | ix) Agricultural Research and Education | 8. Communications | | | x) Co-operation | 9. Science, Technology and Environment | | | xi) Others | 10. General Economic Services | | | 2. Rural Development | i) Tourism | | | 3. Special Area Programmes | ii) Others | | | 4. Major and Medium Irrigation and Flood Control | | Agriculture, social services and infrastructure sectors account for the lion’s share of States’ development capital outlay (Chart 2). While the share of capital outlay in agriculture has declined in the last decade in almost all the States except in Jharkhand, Madhya Pradesh, Uttarakhand and West Bengal, the shares of social services and infrastructure have generally increased. On the other hand, capital outlay in industry, research and development and other economic services is minimal. A panel data regression with sectoral labour productivity as the dependent variable3 and sectoral development capital outlay, States’ development level in terms of road density (road length per unit geographical area), per capita availability of electricity and infant mortality (an indicator of human development) as independent variables, and with time and State-level fixed effects shows that availability of electricity plays a vital role in boosting both agricultural and industrial labour productivity. Services sector labour productivity responds positively to developmental capital outlay on social services. Availability of road infrastructure also adds to the labour productivity in industry and services sector (Table 2). These empirical findings suggest that States should allocate capital outlay towards social services and development of electricity and road infrastructure to provide a stronger boost to labour productivity. | Table 2: Panel Data Regression Results | | | (1) | (2) | (3) | | | Agriculture Labour Productivity | Industry Labour Productivity | Services Labour Productivity | | lag_Social Services | -0.002 | 0.010 | 0.027* | | | (-0.860) | (0.450) | (2.200) | | lag_Agriculture | 0.002 | -0.011 | 0.002 | | | (1.170) | (-0.980) | (0.400) | | lag_Industries | 0.005 | 0.040 | -0.042 | | | (0.310) | (0.340) | (-0.640) | | lag_R&D | -0.122 | 6.047 | -3.061 | | | (-0.250) | (1.600) | (-1.450) | | lag_Infrastructure | -0.0003 | 0.016* | -0.001 | | | (-0.320) | (2.270) | (-0.200) | | Per Capita Electricity | 0.060*** | 0.413** | 0.112 | | | (3.440) | (3.100) | (1.510) | | Road Density | 6.566 | 95.300* | 75.380** | | | (1.060) | (2.000) | (2.830) | | Infant Mortality | -0.0998 | -1.491 | -2.929 | | | (-0.180) | (-0.340) | (-1.200) | | Constant | 19.45 | 68.04 | 512.1** | | | (0.550) | (0.250) | (3.380) | | State-level Fixed Effects | Yes | Yes | Yes | | Time Fixed Effects | Yes | Yes | Yes | | Observations | 114 | 114 | 114 | | Adjusted R-squared | 0.819 | 0.889 | 0.594 | t statistics in parentheses
* p<0.05 ** p<0.01 *** p<0.001 | | 3.11 Education was a subject under the State list4 at the time of framing of the Indian Constitution before it was shifted to the Concurrent list5 by a constitutional amendment in 1976. Currently, the provision of elementary education to children, promotion and safeguarding of cultural interest of minorities, and development of higher education are the joint responsibilities of the Union and State governments, with funds provided by both for their own educational institutions as well as institutions set up by the private individuals or societies in the form of grants-in-aid (Verghese and Tilak, 1991). 3.12 Under the Indian Constitution, health is a subject categorised under the State list6 (public health, sanitation, hospitals and dispensaries are covered in this list). On the other hand, the Central government is entrusted in the Union list7 with subjects such as port quarantine, including hospitals connected therewith, marine hospitals and union agencies for professional training and research. Additionally, various items related to health having wider ramifications at the national level are included in the concurrent list such as family welfare, population control, medical education, prevention of food adulteration and quality control in the manufacture of drugs. The methods adopted by the governments to deliver these services include framing of policies, execution of legislation and implementation of programmes (Kishore, 2012). 3.13 Of the total capital outlay, States spend 94 per cent on developmental expenditure (Chart III.8a), with a third for provisioning of social services like health, education, housing and urban development, and social security and the rest on economic services. Health and education together constitute around 63 per cent of the total capital outlay for social services, with the former receiving special attention since the COVID-19 period. After contracting in 2019-20, the capital outlay for health grew by 34 per cent in 2020-21. States have continued with the capex push in favour of health, with y-o-y growth of 79 per cent in 2021-22, and 23 per cent budgeted for 2022-23 (Chart III.8b).
3.14 The pattern of capital investment in health and education varies across States. For healthcare, the north-eastern and hilly States stand out with the highest capital spending. Delhi, Andhra Pradesh and Punjab have the highest share of education in their total capital outlay (Chart III.9). 4. Investment in Infrastructure 3.15 Growth in infrastructure capacity is directly correlated with real positive economic output (Ilori, 2004). Apart from positively influencing economic growth, investment in infrastructure can also improve the quality of life of the people, create higher job opportunities, and encourage efficient use of financial resources (Dhir, 2018). Public spending on infrastructure can also crowd in private sector investment. This assumes significance because physical infrastructural projects involve large lump sum expenditures as well as protracted gestational time, which may deter private investment. 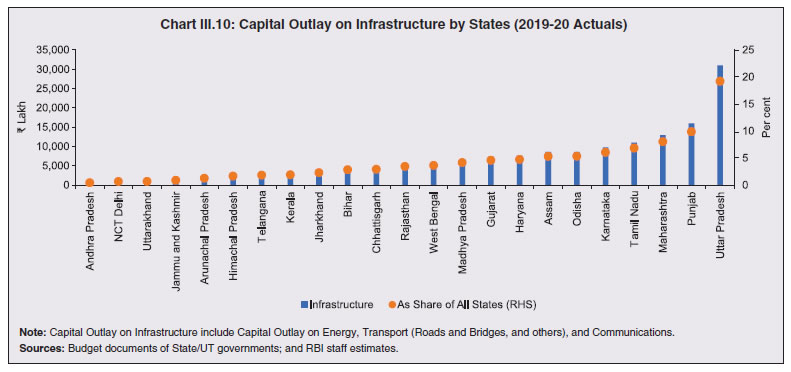 3.16 In an emerging economy like India with a federal set up, both the Central and State governments have a significant role to play in the development of physical infrastructure such as power, transportation, communication, and logistics (Chart III.10). Public private partnership (PPP) has emerged as a preferred arrangement wherein the private sector gets its normal financial rates of return while the public sector partner provides concessional funding, based on the long term direct and indirect benefits to the economy. The government has also introduced innovative financial instruments such as viability gap funding (VGF) through special purpose vehicles (SPV) for funding mega infrastructure projects. In October 2021 the Union government launched Gatishakti – National Master Plan for Multi-modal Connectivity programme. It would integrate the infrastructure schemes of various ministries and State governments like Bharatmala, Sagarmala, inland waterways, dry/land ports and UDAN (GoI, 2022). 3.17 In order to mitigate the adverse impact of climate change on human life, more than 70 countries have set net zero targets, covering about 76 per cent of global emissions. The Indian government has also committed toward reaching net zero emissions by 2070 and reducing cumulative emissions by 1 billion tonne by 2030. In order to make this transition feasible, the State governments in India need to step up investment in these areas and create a conducive policy environment for the private sector to invest in renewable and green energy sources. 5. Policy Incentives and Governance Reforms by States 3.18 States have a central role in designing the institutional environment which determines the incentive structure, regulatory barriers, entry-exit costs, operational and production costs, and level of entrepreneurship and skills. Typically, States offer a bouquet of incentives to the private sector such as financial assistance in the form of interest subvention schemes, one-time financial grants, credit-linked capital subsidies, partial/full reimbursement of registration fees/ stamp duty on sale/lease deeds of land, reimbursement of State Goods and Service Tax (SGST), operational assistance like reimbursement of electricity duty, subsidy on power tariff, water tariff, transportation subsidy and the like to encourage private investments for industrial development. Other incentives can include employment generation subsidy, reimbursement of employer’s contribution to Employee Provident Funds (EPF) and Employees’ State Insurance (ESI) Scheme, and subsidy on training of employees. The States may also allow certain investors some relaxation on adherence of various labour and industrial laws to ease their compliance costs and burden. Many States have set up Investment Promotion Boards to advice, guide and facilitate investment in infrastructure. Some States have developed dedicated industrial parks with plug and play infrastructure which includes road connectivity, transport and logistic facilities, assured water and power supply, common facilities such as warehousing, information and communication technology (ICT), and waste handling. 3.19 In recent times, several States have taken initiatives to encourage investments in sunrise sectors. For instance, States such as Chhattisgarh, Goa, Haryana, Maharashtra, Kerala, Punjab, and Rajasthan are providing a wide range of incentives for hand-holding start-ups to promote the manufacturing of Electric Vehicles (EVs). Bihar, Goa, Karnataka, Uttar Pradesh and Delhi have also policies in place to nurture a start-up environment, including common infrastructural facilities, co-working spaces, research and development and testing labs, incubators and accelerator programmes and financial assistance such as one-time seed funding support, grants for repayment of interest on loans, and reimbursement of patent fees (Table III.1). Haryana and Uttar Pradesh have formulated policies to encourage the establishment of their data centre industry by providing various forms of incentives to subsidise capital, reduce operational costs and stimulate employment generation. 3.20 Gujarat has the Atmanirbhar Gujarat Policy for assistance to mega industries in sectors such as green energy ecosystem, mobility, capital equipment, metal and minerals, and gems and jewellery. Other sectors which have received special policy attention include manufacturing of electronics (Andhra Pradesh, Jharkhand, Madhya Pradesh, Odisha and Uttar Pradesh), manufacturing of semi-conductors (Chhattisgarh and Gujarat), development of the aerospace sector (Karnataka, Maharashtra, and Tamil Nadu), and development of the animation, visual effects, gaming and comics (AVGC) sector (Karnataka, and Telangana). 3.21 Such policies can also play an important role in attracting foreign direct investment (FDI) flows to States. Currently, the lion’s share of FDI flows go to Maharashtra, Karnataka, and Delhi (Chart III.11a). Sector-wise, computer hardware and software, automobile industry and the services sector are drawing most of the FDI flows (Chart III.11b). While it is common for States to offer incentives to Information Technology/ Information Technology Enabled Services (IT/ ITeS), biotechnology, tourism and the micro, small and medium enterprise (MSME) sectors, special incentives are also being offered to industries such as textile, food, fisheries, film, healthcare and electricity generation. Most of the sector-specific incentives for FDI in India take the form of exemption from stamp duty, registration fee, electricity duty and various types of taxes. Exemption of entertainment taxes is common for the tourism sector (Mukherjee, 2011). | Table III.1: Some Recent Innovative Policy Initiatives Undertaken by the States | | S.No. | Policy | Incentive | | 1. | Andhra Pradesh | | | | IT Policy, 2021-24 | A one-time incentive up to ₹20,000 per employee to encourage IT firms to facilitate their employees to work from home by covering expenses related to remote working hardware, software, bandwidth costs etc. Developing an exchange platform for Andhra Pradesh based freelance workers to boost the gig economy. | | 2. | Bihar | | | | Start-Up Policy, 2022 | Designing of a rating system for the Start-ups with the help of a third party to recommend the seed funding/ matching grants for financial assistance under the policy. | | 3. | Delhi | | | | Startup Policy of NCT of Delhi, 2019 | Setting-up of 5 fabrication labs by 2025 for recognised Start-ups where industrial users can build working prototypes of their products using specialised fabrication tools and electronic equipment, both manual and computer-aided. | | 4. | Goa | | | | Start-up Policy | Establishing a technology fellowship programme to identify technical educators in the State and further their expertise in various areas such as AI, ML, Big Data analytics etc. by providing them training in Centres of Excellence within and outside the country. | | 5. | Kerala | | | | Electric Vehicle Policy, 2019 | Updation of curriculum of technical schools in accordance with the latest technologies in EVs and Autonomous Vehicle (AVs). | | 6. | Odisha | | | | IT Policy, 2022 | Reimbursement of costs incurred for adoption of cleaner/greener production measures. | | 7. | Rajasthan | | | | Rajasthan Investment Promotion Scheme, 2022 | Provision of incentives such as capital subsidy, fee waivers, exemption of certain taxes etc. for green measures relating to air pollution control, water conservation, and energy efficiency. | | 8. | Tamil Nadu | | | | FinTech Policy, 2021 | First 5 big Fintech Firms will be eligible for a relocation incentive of 50 per cent of the cost of relocation to the State. | | | R&D Policy, 2022 | Establishing Technology Transfer Offices in technical colleges and universities to help in translating the new and innovative research into commercially viable products or services.
Creating a framework for monitoring and tracking R&D activities in the States - spending, number of innovations, patent filing, and publications by Start-ups/MSMEs/private businesses/non-profit and research institutions. | Note: This table is not an exhaustive list of pro-growth policy changes being introduced/contemplated by the States. It only highlights some of the major initiatives at the State level to harness emerging new opportunities for growth and development.
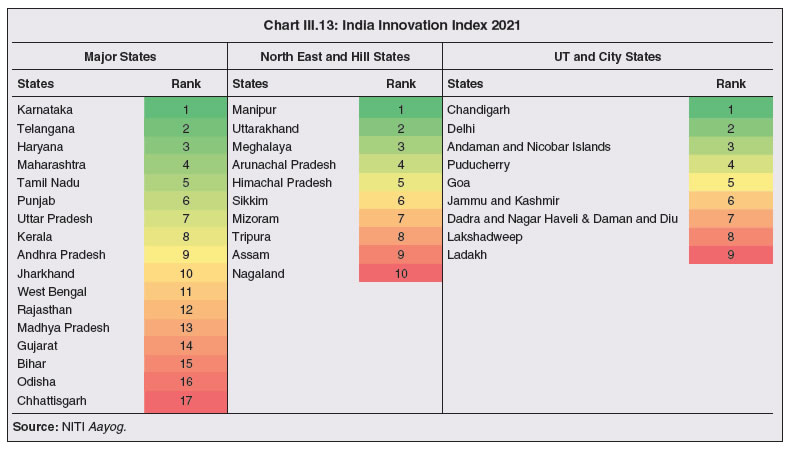
Source: State/UT governments. | 3.22 Policies for facilitating investment in infrastructure should be supplemented by administrative and governance reform (Lall and Mengistae, 2005). The Department for Promotion of Industry and Internal Trade has been developing business reform action plans (BRAP) for States. These action plans bring to the centre-stage ‘measurability’ and ‘comparability’ as far as ease of doing business in different States is concerned. It is notable that within a short span of two years, the majority of States have drastically improved their ease of doing business scores (Chart III.12). Much of this progress is on account of a multitude of State-level administrative reforms. 3.23 The India Innovation Index, a comprehensive tool for the evaluation and development of the country’s innovation ecosystem, ranks States and Union Territories on their innovation performance. In 2021, Karnataka, Manipur and Chandigarh occupied top positions (Chart III.13). 3.24 The Logistics Ease Across Different States (LEADS), 2022 survey assesses the logistics infrastructure across States through an indigenous data-driven index. States’ infrastructure, service delivery and regulatory environment determine the broad contours of their logistics ecosystem. Based on the survey outcomes, the States are graded into three categories. The “Achievers” are States which have shown exemplary logistics ecosystems with exceptional infrastructure and transparent regulatory processes. The “Fast Movers” are States which are moving towards becoming “Achievers” by notifying progressive policy and legislatives initiatives along with new infrastructure projects. Finally, the “Aspirers” are States which have initiated their journey towards logistics ease and excellence by adopting national best practices to further improve their contribution towards India’s emerging position as a global manufacturing and logistics hub (Chart III.14). 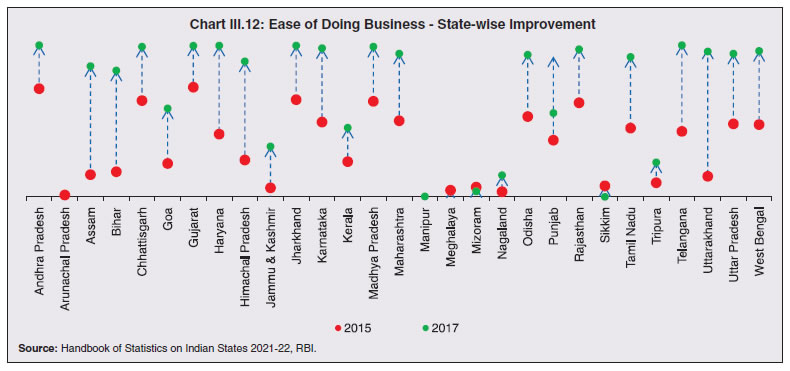
 3.25 Unlike actual developmental spending, a vast majority of governance/administrative/legal reforms do not pose significant fiscal costs and can be undertaken over a relatively short period of time.
6. Spillover Effects of State Capex 3.26 In the presence of economic interconnections among States in India, the positive impact of capital outlay of one State can also spill over to other States through various demand and supply channels. Per capita real capital outlay of other States is found to have a positive correlation with the per capita real GSDP of each individual State. These positive spillovers have increased in the post-GST period (Chart III.15). 3.27 In an empirical exercise, a panel vector autoregression (PVAR) is used with three variables: real per capita GSDP; per capita own real capital outlay; and per capita real capital outlay of other States8. The impulse response function (IRF) plot generated from the PVAR shows that a positive shock on per capita own real capital outlay leads to increased real per capita GSDP. Own real capital outlay has a persistent positive impact on future per capita GSDP. The positive impact of own capital outlay on per capita GSDP tends to persist for at least four years (Chart III.16a). At the same time, per capita capital outlay by other States also has a positive impact on the State’s own per capita GSDP. The positive impact on GSDP persists for at least two years. In the long run, the cumulative impact of the capital outlay on GSDP tends to be higher (Chart III.16b). Further, the impact of own capital outlay on GSDP is found to be more persistent than the impact of capital outlay by the other States. The magnitude of spillover may vary across States depending on the relative size of the capex, location of the State in the value chain, interstate trade flows, interstate migrations and interstate financial flows. Thus, a State may benefit from positive spillovers from capex by other States, but impact of its own capex dominates. 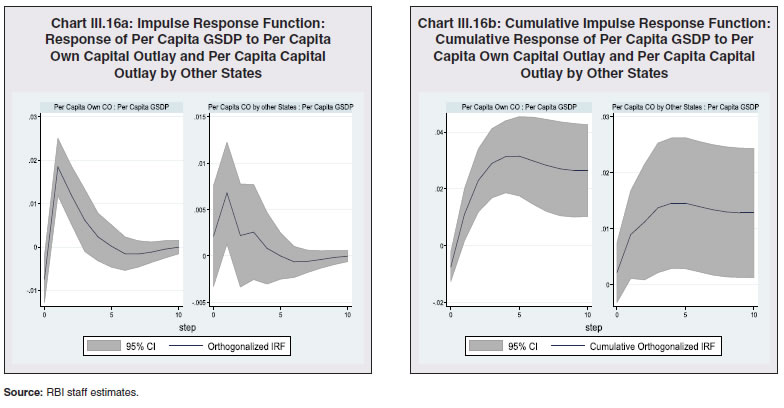 7. Conclusions 3.28 Over the years, considerable progress has been made in terms of creation of infrastructure, both physical and social, through several government initiatives. In particular, the post-pandemic economic recovery in India has been supported by enhanced public capex by both the Central and State governments. As a result, fiscal stimulus by design emphasized sustainable and non-inflationary normalization of economic activity. Since capital expenditure by sub-national governments in India is more than two thirds of the total capital expenditure incurred by the general government, it is imperative for all the States to continue with the current capex push, to sustain the quality of expenditure and maintain capital assets so that their longevity improves. In addition, States should also step up capex in areas like research and development and green energy. States can also realize the full benefit of positive spillover effects by facilitating higher inter-state trade and businesses. Going ahead, all tiers of government must engage along with private participation to create world-class capital assets in India.
|