The pandemic tested the resilience of the NBFC sector. Their balance sheet expanded in 2020-21 on the back of credit growth of NBFCs-ND-SI aided by proactive policy support and revival of the economy. Asset quality and capital buffers improved during the year, while profitability worsened marginally. HFCs’ balance sheet grew on the back of a pickup in credit in 2020-21. The consolidated balance sheet of AIFIs expanded during 2020-21 and their net profits posted an impressive growth. 1. Introduction VI.1 During 2020-21, non-banking financial companies (NBFCs) consolidated their balance sheets with credit deployment gaining traction, improved asset quality and enhanced capital buffers notwithstanding the testing challenges imposed by the pandemic. This chapter deals with non-banking financial institutions (NBFIs) regulated by the Reserve Bank1 comprising NBFCs, housing finance companies (HFCs), all-India financial institutions (AIFIs) and primary dealers (PDs). NBFCs are government/ public/ private limited companies engaged in purveying credit to key and niche sectors of the economy; viz., from infrastructure to the unbanked sections of the society. HFCs specialise in housing finance to individuals, co-operative societies, corporate bodies, and lease commercial and residential premises to support housing activity in the country (Chart VI.1)2. AIFIs, i.e., the National Bank for Agriculture and Rural Development (NABARD), the EXIM Bank of India, the Small Industries Development Bank of India (SIDBI) and the National Housing Bank (NHB) are apex financial institutions that play an important role in meeting the long-term funding requirements of agriculture and the rural sector, foreign trade, small industries, housing finance companies, NBFCs, Micro Finance Institutions (MFIs) and other specialised segments and institutions. PDs act as market makers in the government securities (G-secs) market, besides ensuring subscription to primary issuances. VI.2 The ongoing COVID-19 pandemic has deeply impacted the NBFC sector. In Q1:2020-21, they faced severe disruptions during and in the wake of the nation-wide lockdown, leading to a standstill of economic activity and a contraction of Gross Domestic Product (GDP) by 24.4 per cent. As the impact on the real sector spilled over to financial markets, NBFCs witnessed a sharp drop in collections and disbursements and a substantial increase in the cost of their borrowings even as access to market funding became restricted. The provision of moratorium also had an impact on their cash inflows, resulting in reduction in collections. Timely measures on monetary, fiscal, and regulatory fronts by the Reserve Bank and the government aided their revival, eased financial conditions and bolstered market sentiments. From Q2:2020-21 onwards, the situation improved, aided by policy support. Many NBFCs also recalibrated their business strategies, leveraging on digital technology with a strong emphasis on data analytics. The NBFC sector faced headwinds again when the second wave hit the country by March 2021. With the passing of the second wave, the outlook is brightening again; however, downside risks remain significant.  VI.3 NBFCs have a competitive edge in their superior understanding of regional dynamics, well-developed collection systems and personalised services in the drive to expand financial inclusion in India. Lower transaction costs, quick decision making, customer orientation and prompt provision of services have typically differentiated NBFCs from banks. The reach and last mile advantages of NBFCs have empowered them with agility, innovation and a cutting edge in providing formal financial services to underbanked and unserved sections of the society. VI.4 The rest of the chapter is organised into four sections. Section 2 provides an overview of the NBFC sector – both non-deposit taking systemically important NBFCs (NBFCs-ND-SI) and deposit-taking NBFCs (NBFCs-D). The activities and financial performance of HFCs are also covered in this section. An assessment of the performance of AIFIs is made in Section 3. Section 4 evaluates the role and performance of PDs. Section 5 concludes and offers some policy perspectives. 2. Non-Banking Financial Companies (NBFCs)3 VI.5 NBFCs’ credit intensity measured by the credit/GDP ratio has been rising consistently, reaching a high in 2021 (Chart VI.2 a). Significantly, NBFCs’ credit as proportion to SCBs’ credit has also risen (Chart VI.2 b). VI.6 NBFCs can be classified on the basis of a) asset/liability structures; b) systemic importance; and c) the activities they undertake. In terms of liability structures, NBFCs are subdivided into deposit-taking NBFCs (NBFCs-D) - which accept and hold public deposits - and non-deposit taking NBFCs (NBFCs-ND) - which source their funding from markets and banks. Among non-deposit taking NBFCs, those with asset size of ₹500 crore or more are classified as non-deposit taking systemically important NBFCs (NBFCs-ND-SI). As on September 30, 2021, there were 52 NBFCs-D and 312 NBFCs-ND-SI. Based on activities, there are 11 categories of NBFCs (Table VI.1). VI.7 Regulatory guidelines mandate that only those NBFCs with minimum net owned funds (NOF) of ₹2 crore4 can be allowed to operate. In 2018-19, there was a record number of cancellations/surrender of licenses of non-compliant NBFCs. During 2020-21, the number of registrations and cancellations were the lowest in the last five years (Chart VI.3). 2.1 Ownership Pattern VI.8 The NBFC sector is dominated by NBFCs-ND-SI that constitute 85.1 per cent of the total assets of the sector. The number of large government-owned NBFCs, which mainly lend in the infrastructure space, has remained unchanged but their share in total assets of NBFCs-ND-SI has increased during the year (Table VI.2). | Table VI.1 :Classification of NBFCs by Activity | | Type of NBFC | Activity | | 1. Investment and Credit Company (ICC) | Lending and investment. | | 2. NBFC-Infrastructure Finance Company (NBFC-IFC) | Financing of infrastructure sector. | | 3. Core Investment Company (CIC) | Investment in equity shares, preference shares, debt, or loans of group companies. | | 4. NBFC-Infrastructure Debt Fund (NBFC-IDF) | Facilitation of flow of long-term debt only into post commencement operations in infrastructure projects which have completed at least one year of satisfactory performance. | | 5. NBFC-Micro Finance Institution (NBFC-MFI) | Providing collateral free small ticket loans to economically disadvantaged groups. | | 6. NBFC-Factor | Acquisition of receivables of an assignor or extending loans against the security interest of the receivables at a discount. | | 7. NBFC-Non-Operative Financial Holding Company (NBFC-NOFHC) | Facilitation of promoters/ promoter groups in setting up new banks. | | 8. Mortgage Guarantee Company (MGC) | Undertaking of mortgage guarantee business. | | 9. NBFC-Account Aggregator (NBFC-AA) | Collecting and providing information about a customer’s financial assets in a consolidated, organised, and retrievable manner to the customer or others as specified by the customer. | | 10. NBFC–Peer to Peer Lending Platform (NBFC-P2P) | Providing an online platform to bring lenders and borrowers together to help mobilise funds. | | 11. Housing Finance Company (HFC) | Financing for housing. | | Source: RBI. | VI.9 The Reserve Bank has been monitoring the operations and growth of NBFCs-D in order to secure depositors’ interest, given that deposits of NBFCs-D are not covered by the Deposit Insurance and Credit Guarantee Corporation (DICGC). The Reserve Bank has mandated that only investment grade NBFCs-D shall accept fixed deposits from the public up to a limit of 1.5 times of their NOF and for a tenure of 12 to 60 months only, with interest rates capped at 12.5 per cent. VI.10 NBFCs-D accounted for 14.9 per cent of the total assets of the NBFC sector at end-March 2021. Privately owned NBFCs-D accounted for 88.4 per cent of NBFCs-D’ total assets in 2020-21 (Table VI.2). 2.2 Balance Sheet VI.11 During the year under review, the balance sheet of NBFCs expanded at a faster rate than a year ago, driven essentially by growth in credit and investments of NBFCs-ND-SI. The balance sheet of NBFCs-D, on the other hand, grew modestly as they adopted a more cautious approach. In 2020-21, the share capital and reserves of NBFCs expanded significantly as some NBFCs raised additional capital via rights issues, prudently buttressing their financials against the likely recognition of impaired assets after the lifting of the Supreme Court’s order on standstill on asset classification5. NBFCs’ credit also gained traction with the support provided by regulatory initiatives6, including the “co-lending model” introduced in November 2020, which allows banks to co-lend with NBFCs (including HFCs) in respect of priority sector loans. NBFCs also increased their investments substantially during the year. In view of the pandemic, NBFCs also built liquidity buffers, with their cash and bank balances growing at a robust pace, except for NBFCs-ND-SI. In 2021-22 (up to September), balance sheet growth of NBFCs remained buoyant due to pick up in investments by NBFCs-ND-SI (Appendix Tables VI.1, VI.2 and VI.3). | Table VI.2: Ownership Pattern of NBFCs | | (End-March 2021) | | (Amount in ₹ crore) | | Type | NBFC-ND-SI | NBFC-D | | Number of Companies | Asset Size | Asset Share in per cent | Number of Companies | Asset Size | Asset Share in per cent | | 1 | 2 | 3 | 4 | 5 | 6 | 7 | | A. Government Companies | 21 | 13,47,377 | 45.6 | 5 | 60,214 | 11.6 | | B. Non-government Companies (1+2) | 379 | 16,09,976 | 54.4 | 50 | 4,57,769 | 88.4 | | 1. Public Limited Companies | 202 | 11,59,669 | 39.2 | 48 | 3,15,889 | 61.0 | | 2. Private Limited Companies | 177 | 4,50,307 | 15.2 | 2 | 1,41,880 | 27.4 | | Total (A+B) | 400$ | 29,57,352 | 100.0 | 55 | 5,17,983 | 100.0 | Notes: 1. Data are provisional.
2. $The total number of NBFCs-ND-SI differs from that in Chart VI.1 as it includes group companies even with less than ₹500 crore asset size.
Source: Supervisory Returns, RBI. | VI.12 Public deposits of NBFCs-D grew strongly in 2019-20 and 2020-21 and remained a stable source of funding. On the assets side, investments continued to grow at an accelerated pace, while loans and advances picked up pace marginally vis-à-vis 2019-20 (Table VI.3). VI.13 On credit disbursement, 57 NBFCs, each having a loan book of more than ₹5000 crore, lent 90.1 per cent of the total credit disbursed in 2020-21 (Chart VI.4). Smaller NBFCs (asset size less than ₹500 crore) are numerous but accounted for only 0.9 per cent of total NBFC credit outstanding. VI.14 Amongst NBFCs-ND-SI, ICCs, IFCs and NBFCs-MFI together accounted for 98.1 per cent of the total asset size of the sub-sector in March 2021. All categories of NBFCs-ND-SI exhibited balance sheet growth in 2020-21, except for NBFCs-Factor (Table VI.4). With the harmonisation of major NBFC categories, NBFCs-D now comprise only ICCs. | Table VI.3: Abridged Balance Sheet of NBFCs | | (Amount in ₹ crore) | | Items | As at end-March - 2020 | As at end-March - 2021 | As at end- September - 2021 | | NBFCs | NBFCs-ND-SI | NBFCs-D | NBFCs | NBFCs-ND-SI | NBFCs-D | NBFCs | NBFCs-ND-SI | NBFCs-D | | 1 | 2 | 3 | 4 | 5 | 6 | 7 | 8 | 9 | 10 | | 1. Share Capital and Reserves | 6,13,810 | 5,28,044 | 85,766 | 7,76,214 | 6,75,759 | 1,00,455 | 8,12,562 | 7,06,936 | 1,05,626 | | | (11.8) | (9.6) | (27.7) | (26.5) | (28.0) | (17.1) | (25.6) | (28.2) | (10.5) | | 2. Public Deposits | 50,022 | - | 50,022 | 62,262 | - | 62,262 | 66,443 | - | 66,443 | | | (24.9) | | (24.9) | (24.5) | | (24.5) | (21.1) | | (21.1) | | 3. Debentures | 9,04,655 | 8,01,317 | 1,03,338 | 9,84,448 | 8,85,746 | 98,702 | 9,88,342 | 8,85,414 | 1,02,928 | | | (10.1) | (10.9) | (4.2) | (8.8) | (10.5) | (-4.5) | (7) | (7.2) | (5.6) | | 4. Bank Borrowings | 6,93,918 | 5,69,530 | 1,24,388 | 7,75,491 | 6,60,669 | 1,14,822 | 7,30,740 | 6,25,219 | 1,05,521 | | | (13.8) | (13.1) | (17.1) | (11.8) | (16) | (-7.7) | (5.0) | (9.5) | (-15.8) | | 5. Commercial Paper | 64,877 | 57,399 | 7,478 | 70,631 | 62,109 | 8,523 | 71,990 | 60,369 | 11,621 | | | (-54.6) | (-54.0) | (-58.7) | (8.9) | (8.2) | (14.0) | (6.0) | (-0.1) | (56.0) | | 6. Others | 7,53,994 | 6,38,166 | 1,15,828 | 8,06,289 | 6,73,069 | 1,33,219 | 8,40,595 | 7,00,069 | 1,40,527 | | | (13.9) | (11.8) | (27.1) | (6.9) | (5.5) | (15) | (7.5) | (5.8) | (16.9) | | Total Liabilities/Assets | 30,81,276 | 25,94,456 | 4,86,820 | 34,75,335 | 29,57,352 | 5,17,983 | 35,10,671 | 29,78,006 | 5,32,665 | | | (9.1) | (8.0) | (15.4) | (12.8) | (14.0) | (6.4) | (10.7) | (11.5) | (6.3) | | 1. Loans and Advances | 24,60,552 | 20,42,745 | 4,17,807 | 26,98,689 | 22,74,622 | 4,24,068 | 26,61,782 | 22,22,579 | 4,39,203 | | | (7.2) | (6.6) | (10.2) | (9.7) | (11.4) | (1.5) | (4.9) | (4.7) | (5.8) | | 2. Investments | 2,93,903 | 2,54,752 | 39,151 | 4,19,319 | 3,73,282 | 46,037 | 4,69,945 | 4,23,116 | 46,829 | | | (13.5) | (8.4) | (63.9) | (42.7) | (46.5) | (17.6) | (50.5) | (61.9) | (-8.1) | | 3. Cash and Bank Balances | 1,30,956 | 1,13,681 | 17,275 | 1,56,260 | 1,22,096 | 34,164 | 1,62,029 | 1,29,667 | 32,363 | | | (36.4) | (31.8) | (76.5) | (19.3) | (7.4) | (97.8) | (20.3) | (16.6) | (37.4) | | 4. Other Current Assets | 1,47,981 | 1,38,487 | 9,494 | 1,56,871 | 1,46,727 | 10,145 | 1,60,835 | 1,50,712 | 10,123 | | | (19.2) | (18.7) | (26.1) | (6.0) | (5.9) | (6.9) | (6.5) | (7.4) | (-5.6) | | 5. Other Assets | 47,884 | 44,792 | 3,093 | 44,195 | 40,625 | 3,570 | 56,081 | 51,934 | 4,147 | | | (-5.3) | (-8.5) | (93.2) | (-7.7) | (-9.3) | (15.4) | (56.2) | (47.2) | (565.6) | Notes: 1. Data are provisional.
2. Figures in parentheses indicate y-o-y growth in per cent.
Source: Supervisory Returns, RBI. |
 VI.15 ICCs’ share in total assets dipped marginally. Their credit growth, albeit modest, was aided by favourable base effects. Balance sheets of micro finance institutions (NBFCs-MFI), on the other hand, expanded on the back of robust credit growth, a favourable policy environment, pent-up demand and phased reopening of the economy (Chart VI.5 a). VI.16 IFCs’ credit disbursements in the infrastructure sector (power) grew strongly, insulated from the impact of COVID-19. Two large government-owned NBFCs ensured liquidity in the power sector during the pandemic period. | Table VI.4: Major Components of Liabilities and Assets of NBFCs-ND-SI by Classification | | (Amount in ₹ crore) | | Category / Liability | As at end-March 2020 | As at end-March 2021 | As at end- September 2021 | Percentage Variation of Total Liabilities | | Borrowings | Other Liabilities | Total Liabilities | Borrowings | Other Liabilities | Total Liabilities | Borrowings | Other Liabilities | Total Liabilities | (March 2020 over March 2019) | (March 2021 over March 2020) | | 1 | 2 | 3 | 4 | 5 | 6 | 7 | 8 | 9 | 10 | 11 | 12 | | ICC | 8,93,148 | 4,64,366 | 13,57,513 | 9,25,001 | 6,05,666 | 15,30,667 | 8,82,735 | 6,16,628 | 14,99,363 | 3.6 | 12.8 | | NBFC-Factor | 1,822 | 2,070 | 3,893 | 1,839 | 2,039 | 3,878 | 1,632 | 1,964 | 3,596 | -6.7 | -0.4 | | IDF-NBFC | 24,868 | 4,935 | 29,804 | 28,429 | 6,415 | 34,844 | 31,510 | 6,764 | 38,274 | 20.9 | 16.9 | | Infrastructure Finance Company | 9,10,033 | 2,15,025 | 11,25,058 | 10,41,895 | 2,39,500 | 12,81,395 | 10,65,847 | 2,61,896 | 13,27,743 | 13.4 | 13.9 | | NBFC-MFI | 45,594 | 19,241 | 64,835 | 62,310 | 26,249 | 88,559 | 58,562 | 22,924 | 81,487 | -1.0 | 36.6 | | Others | 2 | 13,352 | 13,354 | 77 | 17,933 | 18,009 | 80 | 27,462 | 27,542 | 117.5 | 34.9 | | Total | 18,75,467 | 7,18,989 | 25,94,456 | 20,59,551 | 8,97,801 | 29,57,352 | 20,40,367 | 9,37,639 | 29,78,006 | 8.0 | 14.0 | | Category / Asset | Loans and Advances | Other Assets | Total Assets | Loans and Advances | Other Assets | Total Assets | Loans and Advances | Other Assets | Total Assets | Percentage Variation of Total Assets | | (March 2020 over March 2019) | (March 2021 over March 2020) | | ICC | 9,44,992 | 4,12,521 | 13,57,513 | 10,03,748 | 5,26,919 | 15,30,667 | 9,20,368 | 5,78,995 | 14,99,363 | 3.6 | 12.8 | | NBFC-Factor | 3,096 | 797 | 3,893 | 2,961 | 917 | 3,878 | 2,763 | 833 | 3,596 | -6.7 | -0.4 | | IDF-NBFC | 27,410 | 2,394 | 29,804 | 30,414 | 4,430 | 34,844 | 31,477 | 6,797 | 38,274 | 20.9 | 16.9 | | Infrastructure Finance Company | 10,15,853 | 1,09,205 | 11,25,058 | 11,69,240 | 1,12,155 | 12,81,395 | 12,04,869 | 1,22,874 | 13,27,743 | 13.4 | 13.9 | | NBFC-MFI | 51,394 | 13,441 | 64,835 | 68,258 | 20,301 | 88,559 | 63,102 | 18,385 | 81,487 | -1.0 | 36.6 | | Others | - | 13,354 | 13,354 | - | 18,009 | 18,009 | - | 27,542 | 27,542 | 117.5 | 34.9 | | Total | 20,42,745 | 5,51,711 | 25,94,456 | 22,74,622 | 6,82,731 | 29,57,352 | 22,22,579 | 7,55,427 | 29,78,006 | 8.0 | 14.0 | Note: Data are provisional.
Source: Supervisory Returns, RBI. | They sanctioned ₹1.34 lakh crore and disbursed over ₹79,000 crore to distribution utilities (DISCOMs) under the Liquidity Infusion Scheme as part of the Aatmanirbhar Bharat Abhiyaan of the Union Government. Under this scheme, they extended special long-term transitional loans at concessional rates to DISCOMS to enable them to clear their outstanding dues. A renewed focus on encouraging green energy and introduction of policy measures to boost renewable projects has enabled greater funding of renewable energy projects by NBFCs. Another government-owned NBFC in the railway sector recorded substantial growth (48 per cent) in annual disbursements in 2020-21. These three government-owned NBFCs contributed 35.5 per cent of credit flows from the NBFC sector during the year. NBFCs-Factor, on the other hand, faced the brunt of the impact of COVID-19 which took a heavy toll on MSMEs (Chart VI.5 b). 2.3 Sectoral Credit of NBFCs VI.17 Industry remained the largest recipient of credit extended by the NBFC sector, followed by retail loans and services (Appendix Table VI.4). In 2020-21, the share of the retail loan portfolio of the sector continued to rise with a concomitant fall in the share of services sector. ICCs and IFCs together comprise 96.2 per cent credit extended by NBFCs as of end-March 2021. The fall in the share of ICCs was primarily due to the strong growth of other two categories viz., IFCs and NBFCs-MFI (Chart VI.6 a & b). VI.18 In 2020-21, the recovery in sectoral lending of NBFCs has been uneven. Credit to agriculture and services recorded absolute declines, while retail and industrial sectors expanded. Growth in retail loans was primarily driven by housing loans, vehicle loans, microfinance and loans against the collateral of gold (Table VI.5). VI.19 Both ICCs and NBFCs-MFI increased lending to the industrial sector at the cost of lending to agriculture. ICCs reduced their exposure to services [including commercial real estate (CRE)] in contact-sensitive segments severely affected by the pandemic. As NBFCs-MFI are required to have a minimum of 85 per cent of their net assets in microfinance loans by regulation, the share of retail loans in their overall credit portfolio is the largest. IFCs lend mostly to the industrial sector (Chart VI.7). 
| Table VI.5: Sectoral Credit Deployment by NBFCs | | (₹ crore) | | Type | At end-March 2020 | At end-March 2021 | At end-September 2021 | Percentage Variation | | 2019-20 | 2020-21 | | 1 | 2 | 3 | 4 | 5 | 6 | | I. Gross Advances | 24,60,552 | 26,98,689 | 26,61,782 | 7.2 | 9.7 | | II. Food Credit | 75 | 274 | 10 | -62.5 | 265.9 | | III. Non-food Credit (1 to 5) | 24,60,477 | 26,98,415 | 26,61,772 | 7.2 | 9.7 | | 1. Agriculture and Allied Activities | 49,012 | 37,892 | 37,737 | -21.9 | -22.7 | | 2. Industry (2.1 to 2.4) | 9,66,456 | 10,61,284 | 10,63,631 | 3.8 | 9.8 | | 2.1 Micro and Small | 36,441 | 44,294 | 36,156 | -2.5 | 21.5 | | 2.2 Medium | 13,931 | 15,037 | 15,169 | -13.0 | 7.9 | | 2.3 Large | 7,95,275 | 8,55,386 | 8,84,217 | 71.0 | 7.6 | | 2.4 Others | 1,20,809 | 1,46,567 | 1,28,090 | -70.7 | 21.3 | | 3. Services | 3,56,624 | 3,29,320 | 3,27,550 | -13.2 | -7.7 | | Of which, | | | | | | | 3.1 Commercial Real Estate | 1,01,452 | 80,568 | 79,337 | -24.9 | -20.6 | | 3.2 Retail Trade | 35,041 | 26,638 | 25,604 | -5.9 | -24.0 | | 4. Retail Loans | 7,03,094 | 7,86,518 | 7,62,232 | 17.4 | 11.9 | | Of which, | | | | | | | 4.1 Housing Loans | 19,480 | 21,478 | 21,497 | 5.6 | 10.3 | | 4.2 Consumer Durables | 19,171 | 18,336 | 19,854 | -2.3 | -4.4 | | 4.3 Vehicle/Auto Loans | 3,32,449 | 3,56,551 | 3,48,671 | 9.3 | 7.2 | | 4.4 Advances to Individuals against Gold | 34,678 | 94,840 | 1,14,013 | NA | 173.5 | | 4.5 Micro finance loan/SHG Loan | 43,802 | 57,270 | 60,008 | NA | 30.7 | | 5. Other Non-food Credit | 3,85,291 | 4,83,401 | 4,70,621 | 31.9 | 25.5 | Note: Data are provisional.
Source: Supervisory Returns, RBI. | VI.20 Notwithstanding disruptions caused by COVID-19 during the year, NBFCs’ industrial credit grew, reflecting their lending to the power and railway sectors, by government-owned NBFCs, as alluded to earlier (Chart VI.8). 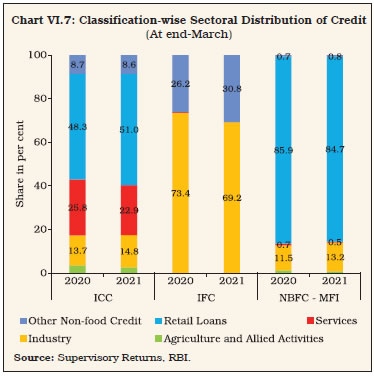
 VI.21 The MSME sector was among the most pandemic afflicted sectors. Accordingly, the Reserve Bank and the Union Government introduced several measures to revive activity in the sector: a) special refinance facilities for AIFIs, which included ₹15,000 crore to SIDBI for on-lending/refinancing to the MSME sector; b) Emergency Credit Line Guarantee Scheme (ECLGS) which provided ₹3 lakh crore of unsecured loans to MSMEs and business; c) extension of the scheme7 of one-time restructuring of loans to MSMEs without an asset classification downgrade; d) permitting bank lending to NBFCs (other than MFIs) for on-lending to agriculture, MSMEs and housing to be classified as priority sector lending (PSL); e) introduction of on-tap Targeted Long-Term Repo Operations (TLTRO) in October 2020 for reviving specific sectors, including MSMEs. VI.22 NBFCs’ credit to MSMEs grew at 17.8 per cent during 2020-21. ICCs, together with NBFCs-MFI, are the main purveyors of MSME credit (Chart VI.9.a). Eleven per cent of the NBFCs-MFI’ loan book comprises micro and small loans (Chart VI.9.b). VI.23 In view of the significance of the sector for income and employment generation, many regulatory policies to support the sector have been extended. The scheme of one-time restructuring of loans to MSMEs without an asset classification downgrade was extended in May 2021 and the exposure threshold was increased to ₹50 crore in June, 2021. The on Tap TLTRO scheme was extended till December 31, 2021. The special refinance facility was bolstered in April 2021 by providing fresh support of ₹15,000 crore to the SIDBI to meet the funding requirements of MSMEs during 2021-22. In June 2021, another special liquidity facility of ₹16,000 crore was provided to the SIDBI for on-lending/refinancing through novel models and structures including double intermediation and pooled bond/loan issuances to meet MSMEs’ short and medium-term credit needs with a focus on smaller MSMEs and businesses, including those in credit deficient and aspirational districts. The Union Government extended the ECLGS facility till September 30, 2021 or till guarantees worth ₹3 trillion are issued. Bank lending to registered NBFCs was permitted to be classified as PSL till September 30, 2021. 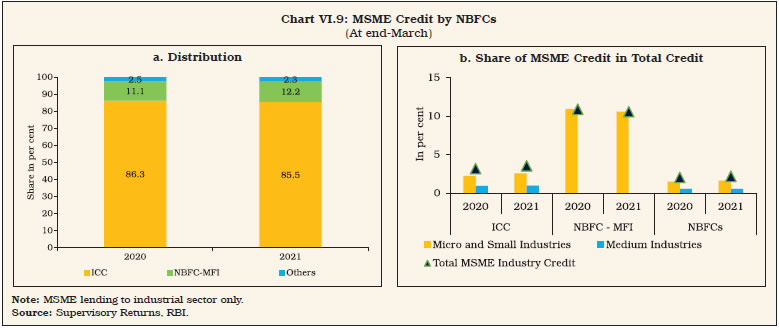 VI.24 Nearly one-fourth of NBFCs’ credit to the services sector goes to commercial real estate. In the total lending to commercial real estate by SCBs and NBFCs, the share of NBFCs was a sizable 25.5 per cent in March 2021. Credit flows to this segment have been severely affected as both banks and NBFCs reduced their exposures in view of the pandemic. In fact, credit flows from NBFCs were in the negative zone in 2020-21 while banks’ lending to the segment increased only marginally (Chart VI.10). VI.25 Vehicle loans credit, the largest segment in retail loans, witnessed reduction in share during 2020-21 owing to disruption of activity while the share of lending against gold doubled (Chart VI.11). VI.26 Vehicle financing is a niche area for NBFCs in which they still account for a predominant share. Component-wise, sales growth of commercial vehicles continued to be in the negative zone in 2020-21 while passenger vehicle sales picked up marginally aided by the opening up of the economy and a growing preference for personal vehicles. Tractor sales grew at a robust pace in 2020-21 as agriculture and rural areas were relatively insulated from the first wave and normal monsoon whetted activity (Chart VI.12). Consequently, NBFCs rebalanced their credit portfolios in favour of this section.
VI.27 Incremental credit flows of NBFCs to the vehicle loans segment outpaced those of SCBs. By 2020-21, NBFCs had a larger vehicle loan portfolio than SCBs (Chart VI.13 a and b). VI.28 NBFCs consolidated their position in the gold loan segment vis-a-vis SCBs in 2020-21 (Chart VI.14). VI.29 NBFCs-MFI play a crucial role in furthering financial inclusion, with a share of 31.1 per cent in total micro-credit (Chart VI.15). VI.30 Microfinance was adversely impacted by the pandemic. During the first wave of the pandemic (Q1:2020-21), the segment faced calamitous business interruptions with drop in collections on account of the nation-wide lockdown as well as the moratorium. Resumption of demand for credit facilitated higher disbursements by Q4:2020-21. The second wave further reduced the disbursements due to localised lockdowns. Nevertheless, the decline in Q1:2021-22 was not as severe as in Q1:2020-21 (Chart VI.16). VI.31 In the case of NBFCs-MFI, the pandemic had differential impact on big and small NBFCs-MFI (Box VI.1). The impact of the second wave was subdued as compared to the first wave - outstanding loans in June 2021 were higher than what was witnessed till December 2020, which bears testimony to the resilience of the segment (Chart VI.17). 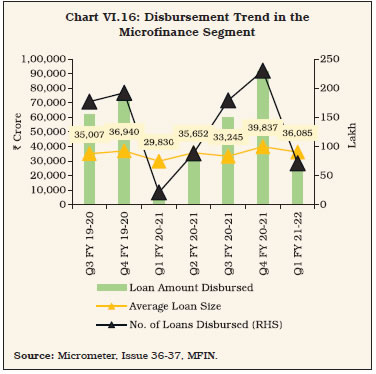
Box VI.1: Impact of COVID-19 on NBFCs-MFI NBFCs-MFI provide collateral-free, short-term and small-ticket loans to borrowers, especially low-income households and unorganised sector enterprises that are generally under-served by the formal channels of credit (RBI, 2021). The COVID-19 pandemic and associated lockdowns disproportionately affected the unorganised sector enterprises and the economically weaker sections. The stoppage of economic activity and mobility caused impediments to credit deployment by NBFCs-MFI and repayment of loans to them. To empirically analyse the effect of the pandemic on credit growth and asset quality of NBFCs-MFI, a panel regression was run in an event study framework [following the methodology by Clarke and Tapia-Scythe (2021) and Ramacharan et al. (2015)] using quarterly supervisory data on 33 NBFCs-MFI for the period March 2019-June 2021 with the help of the following equation:  where i and t represent NBFC and quarter, respectively. The equation was estimated independently for Yit for (a): the incremental credit8 on yearly basis (accounting for seasonality) and (b) NPA ratio9 : gross NPAs/total advances. The Time dummy was fixed at 0 for the quarter ending June 2020 and March 2020 was chosen as the baseline period indicating the onset of the pandemic10.The main coefficient of interest in the equation is βt, which captures the difference in the outcome variable in each quarter (analysed with respect to the onset of the pandemic i.e., March 2020). αi captures the time-invariant NBFC-specific fixed effects and Xit represents the vector of NBFC-specific control variables. The incremental credit flow for all NBFCs-MFI declined in the period immediately following the outbreak (June 2020). Although it has recovered in the later quarters, this recovery has been driven by the big-sized NBFCs-MFI11. Incremental credit flows of small-sized NBFCs-MFI has not yet been able to reach the pre-Covid levels (Charts 1a-1c). The results also indicate that the NPA ratio for NBFCs-MFI was largely maintained immediately following the pandemic, possibly due to the moratorium benefit and standstill in asset classification for NBFC borrowers. However, the effect of the pandemic on the asset quality of NBFCs-MFI has started to show from December 2020 (Chart 1d). References Clarke, D. and K. Tapia-Schythe (2021). Implementing the Panel Event Study. Stata Journal. Ramcharan, R., A. Kermani and M. Di Maggio (2015). Monetary Policy Pass-Through: Household Consumption and Voluntary Deleveraging. Society for Economic Dynamics, Meeting Papers 256. Reserve Bank of India (2021). Consultative Document on Regulation of Microfinance, June. | 2.4 Resource Mobilisation VI.32 Policy measures by the Reserve Bank and the Government provided timely liquidity support to NBFCs, bolstered market confidence and reduced borrowing costs. As financial conditions and market access of NBFCs improved, many NBFCs also adopted prudent debt recycling to pay off their extant high-cost borrowings for new debt at a lower cost. VI.33 NBFCs’ borrowings from banks continued to grow on top of a y-o-y growth rate of 13.8 per cent in the previous year. Borrowings through debentures and via commercial paper (CPs) also increased. At end-September 2021, total borrowings mobilised by NBFCs decelerated (Table VI.6) (Appendix tables VI.1, VI.2 and VI.3). VI.34 NBFCs have been gradually swapping their short-term borrowings for long-term borrowings; consequently, the share of long-term borrowings (payable in more than 12 months) in March 2021 inched up (Chart VI.18). VI.35 Rating-wise, AAA-rated non-convertible debentures (NCDs) of NBFCs have a preponderant share in overall NCD private placements of NBFCs (Chart VI.19 a). In Q1:2020-21, debenture issuances shot up, mainly by AAA and AA-rated entities, bolstered by liquidity measures. In Q2: 2020-21, A-rated NCDs raised higher funds, aided by Special Liquidity Scheme and Partial Credit Guarantee Scheme 2.0. VI.36 Tenure-wise, NCDs of three-year tenure were issued the most in Q1:2020-21 and this broadly coincides with the implementation of TLTRO. NCDs of long tenure (greater than 10 years) were mainly raised by government-owned IFCs and prominent private NBFCs (Chart VI.19 b). The unprecedented spike in spreads witnessed in the beginning of 2020-21 eased subsequently (Chart VI.20 a and b). | Table VI.6: Sources of Borrowings of NBFCs | | (Amount in ₹ crore) | | Items | At end-March-2020 | At end-March-2021 | At end-September-2021 | Percentage variation | | 2019-20 | 2020-21 | | 1 | 2 | 3 | 4 | 5 | 6 | | 1. Debentures | 9,04,655 | 9,84,428 | 9,88,342 | 5.0 | 8.8 | | | (41.7) | (42.0) | (42.5) | | | | 2. Bank Borrowings | 6,93,918 | 7,75,484 | 7,30,740 | 13.8 | 11.8 | | | (32.0) | (33.1) | (31.4) | | | | 3. Borrowings from FIs | 63,133 | 56,224 | 55,862 | 63.0 | -10.9 | | | (2.9) | (2.4) | (2.4) | | | | 4. Inter-corporate Borrowings | 77,032 | 76,839 | 87,189 | 6.8 | -0.3 | | | (3.6) | (3.3) | (3.8) | | | | 5. Commercial Paper | 64,877 | 70,631 | 71,990 | -54.6 | 8.9 | | | (3.0) | (3.0) | (3.1) | | | | 6. Borrowings from Government | 18,752 | 19,131 | 17,923 | 30.2 | 2.0 | | | (0.9) | (0.8) | (0.8) | | | | 7. Subordinated Debts | 73,513 | 68,857 | 67,095 | 16.2 | -6.3 | | | (3.4) | (2.9) | (2.9) | | | | 8. Other Borrowings | 2,73,969 | 2,94,074 | 3,04,638 | 37.2 | 7.3 | | | (12.6) | (12.5) | (13.1) | | | | 9. Total Borrowings | 21,69,849 | 23,45,668 | 23,23,777 | 8.3 | 8.1 | Notes: 1. Data are provisional.
2. Figures in parentheses indicate share in total borrowings.
Source: Supervisory Returns, RBI. |
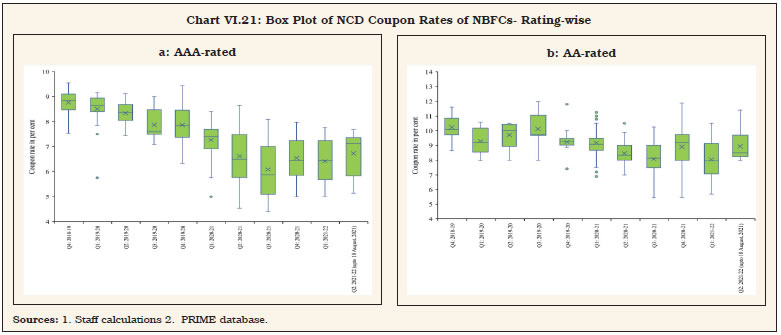 VI.37 Coupon rates of AAA-rated NCDs of NBFCs softened in tandem with the easing monetary cycle and it reduced considerably from Q3: 2020-21. However, the variance in rates among AAA-rated NCDs has widened relative to the pre-pandemic period, indicative of differentiation by the market on the basis of inherent balance sheet strength. In the case of AA-rated NCDs of NBFCs, the dispersion in the coupon rates broadened with policy support and increase in number of issuances (Chart VI.21 a and b). VI.38 Amongst SCBs, public sector banks (PSBs) remained dominant lenders to NBFCs, although private sector banks (PVBs) expanded lending to NBFCs in 2020-21 (Chart VI.22 a & b). VI.39 Overall bank exposure to NBFCs grew as their investment in NBFCs’ debentures increased on the back of COVID-19-related schemes (Chart VI.23 a and b). VI.40 The share of NBFCs in overall CP issuances fell sharply in April 2020, but recovered in the months of July and September 2020, with sector-specific policy actions. Subsequently, NBFCs’ CP issuances surpassed their pre-Covid levels. During the second wave, however, NBFCs did not borrow much via CPs due to adequate liquidity on their books. Nevertheless, NBFCs were quickly back in this space in July 2021 when their share jumped to 65 per cent of total issuances and many NBFCs utilised the funds so raised to provide funding to individuals for subscribing to Initial Public Offerings (Chart VI.24 a).
VI.41 The spike in NBFCs’ CP rates during the second wave was not as severe as the previous one and it quickly recovered (Chart VI.24 b). 2.5 NBFCs-D: Deposits VI.42 Deposit mobilisation by NBFCs progressed at a robust pace. The number of companies authorised to accept deposits has progressively reduced and stood at 55 as of March 2021 (Chart VI.25). Certain large NBFCs-D have explicitly increased their reliance on retail deposits relative to corporate deposits during the year. 90.1 per cent of deposits were raised by 5 NBFCs-D (Chart VI.26). 2.6 Asset Sales and Securitisation VI.43 Asset sales that are undertaken by NBFCs for liquidity management, rebalancing exposures, or strategic sales, and securitisation for redistribution of credit risk by repackaging assets into tradable securities with different risk profiles, dipped in June 2020 but they recovered over the rest of the year. Nevertheless, loan sales volumes of NBFCs-ND-SI have not picked up to pre-COVID levels. Loans securitised, on the other hand, picked up from September 2020 onwards, when the first wave of the pandemic started waning. As NBFCs’ business improved, the investor outlook towards loan securitisation gradually turned positive (Chart VI.27 a and b). Guidelines issued by the Reserve Bank in September 2021 are expected to strengthen these segments. In H1: 2021-22, loans sales picked up, while securitisation decelerated.
2.7 Asset Liability Profile of NBFCs VI.44 NBFCs have gradually changed their borrowing profile, relying more on the long-term segment. Policy support aided in ameliorating the liquidity position of NBFCs, that was impacted by COVID-19 and associated risk aversion. On account of the Liquidity Risk Management Framework, effective from December 2020, issues arising from lumpiness in income receipts which can hamper debt repayments, especially in short-term buckets, were mitigated. In March 2021, the mismatch (inflows minus outflows) in one-two months, two-three months and three-six months buckets improved vis-à-vis March 2020. The cumulative mismatch in the less than one year bucket was better in March 2021 than in March 2020. The deterioration in the one to three year maturity bucket may be attributable to the liquidity schemes in which many NBFCs availed funding by pledging three-year NCDs. The three to five year bucket, however, showed an improvement in March 2021 (Chart VI.28). 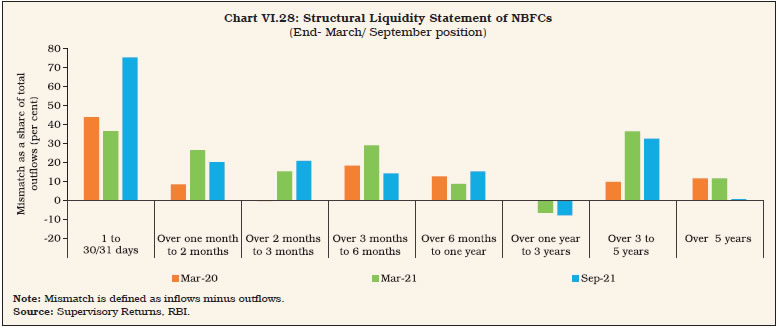
| Table VI.7: Financial Parameters of the NBFC Sector | | (₹ crore) | | Items | 2019-20 | 2020-21 | H1:2021-22 | | NBFCs | NBFCs-ND-SI | NBFCs-D | NBFCs | NBFCs-ND-SI | NBFCs-D | NBFCs | NBFCs-ND-SI | NBFCs-D | | 1 | 2 | 3 | 4 | 5 | 6 | 7 | 8 | 9 | 10 | | A. Income | 3,42,225 | 2,75,651 | 66,574 | 3,53,407 | 2,86,324 | 67,083 | 1,74,711 | 1,39,464 | 35,247 | | | (11.1) | (11.9) | (8.3) | (3.3) | (3.9) | (0.8) | (-3.8) | (-4.1) | (-2.4) | | B. Expenditure | 2,85,808 | 2,34,347 | 51,460 | 2,94,358 | 2,38,837 | 55,522 | 1,38,325 | 1,08,239 | 30,085 | | | (15.3) | (15.3) | (15.2) | (3.0) | (1.9) | (7.9) | (0.5) | (-0.6) | (4.4) | | C. Net Profit | 39,171 | 28,454 | 10,716 | 44,723 | 36,074 | 8,649 | 28,992 | 24,717 | 4,275 | | | (4.9) | (8.9) | (-4.5) | (14.2) | (26.8) | (-19.3) | (-17.1) | (-15.4) | (-25.6) | | D. Total Assets | 30,81,276 | 25,94,456 | 4,86,820 | 34,75,335 | 29,57,352 | 5,17,983 | 35,10,671 | 29,78,006 | 5,32,665 | | | (9.1) | (8.0) | (15.4) | (12.8) | (14.0) | (6.4) | (10.7) | (11.5) | (6.3) | | E. Financial Ratios (as per cent of Total Assets) | | | | | | | | | | | (i) Income | 11.1 | 10.6 | 13.7 | 10.2 | 9.7 | 13.0 | 5.0 | 4.7 | 6.6 | | (ii) Expenditure | 9.3 | 9.0 | 10.6 | 8.5 | 8.1 | 10.7 | 3.9 | 3.6 | 5.6 | | (iii) Net Profit | 1.3 | 1.1 | 2.2 | 1.3 | 1.2 | 1.7 | 0.8 | 0.8 | 0.8 | | F. Cost to Income Ratio (Per cent) | 78.5 | 80.1 | 72.5 | 78.2 | 78.2 | 78.4 | 73.1 | 70.6 | 82.2 | Notes: 1. Data are provisional.
2. Figures in parenthesis indicate Y-o-Y growth in per cent.
Source: Supervisory Returns, RBI. | 2.8 Financial Performance of NBFCs VI.45 NBFCs’ income growth decelerated steeply, as both NBFCs-ND-SI and NBFCs-D reported lower incomes in 2020-21. However, the sector has leveraged technology to counter the challenges posed by the pandemic through rationalisation of expenditure. Net profits of NBFCs-ND-SI witnessed a significant improvement in the aftermath of the first wave of COVID-19 and their cost to income ratios dropped. Conversely, NBFCs-D experienced a moderation in their income due to marginal growth in fund-based income. This, coupled with rising interest payments, increasing cost to income ratio and other expenditures, resulted in a decline in their profits. Net profits of NBFCs during H1:2021-22 declined on the back of fall in fund-based income (Table VI.7, Appendix Table VI.5 and Appendix Table VI.6). VI.46 Total expenses of NBFCs moderated during the year as interest expenses declined, although an increase in interest paid on fixed deposits reflected NBFCs-D preference for public deposits. Operating expenses declined during the year as NBFCs successfully reined in administrative costs by leveraging technology. Provisions against NPAs, however, increased significantly during the year reflective of NBFCs bracing for a potential increase in impaired assets after lifting of the asset classification standstill. In 2021-22 so far, expenses increased marginally as interest burden on bank credit declined (Table VI.8). 2.9 Profitability VI.47 Profitability indicators of NBFCs– return on equity (RoE) and net interest margin (NIM)-were lower during 2020-21 than a year ago, reflecting the stress in the sector. Return on assets (RoA), on the other hand, remained unchanged (Chart VI.29). The overall decline in the profitability could be attributed to drop in the business in the wake of the ongoing pandemic. In H1:2021-22, all profitability indicators of the sector moderated. | Table VI.8: Expenses of NBFCs | | (₹ Crore) | | Items | 2018-19 | 2019-20 | 2020-21 | H1:2021-22 | | 1 | 2 | 3 | 4 | 5 | | 1. Interest Expense and Other Financing Cost (a+b+c+d+e) | 1,50,964 | 1,70,088 | 1,67,571 | 80,488 | | (a) Interest Paid on Fixed Deposits | 2,822 | 3,180 | 4,668 | 2,469 | | (b) Interest on Inter-corporate Deposits | 6,004 | 6,764 | 6,659 | 2,723 | | (c) Interest on Credits from Banks | 50,075 | 58,915 | 60,206 | 27,616 | | (d) Interest on Credits from Financial Institutions | 10,061 | 10,357 | 10,652 | 6,782 | | (e) Other Financing Charges | 82,002 | 90,872 | 85,386 | 40,898 | | 2. Bad Debts Written-off | 14,194 | 25,426 | 29,678 | 8,854 | | 3. Provisions against Non-Performing Assets | 14,246 | 15,039 | 26,980 | 15,449 | | 4. Operating Expenses (i+ii) | 49,382 | 54,658 | 50,585 | 25,446 | | Of which; (i) Employee Costs | 23,395 | 25,833 | 26,036 | 13,953 | | (ii) Other Administrative Costs | 25,987 | 28,825 | 24,549 | 11,492 | | 5. Other Expenses | 19,175 | 20,597 | 19,544 | 8,087 | | Total Expenses | 2,47,960 | 2,85,808 | 2,94,358 | 1,38,325 | | Note: Data are provisional. Source: Supervisory Returns, RBI. | VI.48 In case of NBFCs-D, there was a deterioration in RoA and RoE in 2020-21 on account of the pandemic-induced slowdown. On the other hand, NIM improved during the same period, reflecting improvement in interest income along with lower expenses (Chart VI.29). VI.49 The profitability of NBFCs-ND-SI gauged in terms of RoA marginally increased in 2020-21 due to an improvement in the RoA of IFCs. The overall RoE of NBFCs-ND-SI declined. NIM was lower for all entities, mirroring subdued credit off-take (Chart VI.30). 2.10 Asset Quality VI.50 In 2020-21, NBFCs registered an improvement in asset quality as the asset classification standstill in view of the pandemic was in force. Resolution of a few accounts in the infrastructure space during the year also helped.
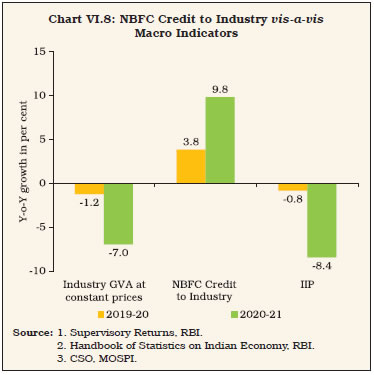
Both GNPA and NNPA ratios declined post March 2020. The higher provision coverage ratio (PCR) during the period is reflective of adequate buffers to deal with likely headwinds (Chart VI.31). In 2021-22 (up to September), asset quality of the sector deteriorated to some extent. GNPA ratio increased from 6.0 per cent to 6.8 per cent and NNPA ratio increased from 2.7 per cent to 3.0 per cent. VI.51 In March 2021, NBFCs-MFI and IFCs had the highest PCRs. PCR of ICCs, though the lowest, improved in 2021 as compared to 2020 (Chart VI.32). VI.52 Based on the duration for which an asset remains non-performing, NPAs can be categorised into sub-standard, doubtful and loss assets. In 2020-21, a part of the sub-standard assets of a large NBFC returned to being standard, which led to a marginal improvement in asset quality (Chart VI.33). VI.53 Among performing loans of NBFCs, 87.6 per cent of loans were standard and rest were overdue but not NPAs in March 2021. Loans overdue in the first bucket viz., less than 30 days were the largest, but the position improved in 2021. The share of loans overdue for more than 60 days but less than 90 days doubled (Chart VI.34). VI.54 In 2020-21, overall GNPA and NNPA ratios of NBFCs-ND-SI decreased but the quality of assets declined in the ICC and NBFC-MFI categories. On the other hand, asset quality of IFCs has improved with declines in GNPA and NNPA, reflective of better provisioning in the IFC segment (Chart VI.35). In H1:2021-22, the GNPA and NNPA ratios of NBFCs-ND-SI rose.
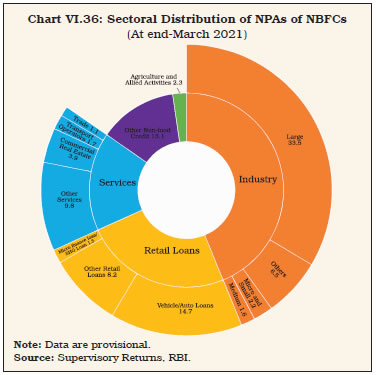
VI.55 The sectoral distribution of NPAs of NBFCs point to a preponderant share of industry in the overall delinquent assets of the sector. Within the industrial sector, loans to large industry have a predominant share in NPAs. Vehicle loans have the largest share in retail loans (Chart VI.36). VI.56 Similarly, a sectoral snapshot of stressed assets12 of NBFCs-ND-SI shows that industry, which is the largest recipient of NBFC lending traditionally, had the highest share of stressed assets whereas agriculture contributed the least (Chart VI.37). Retail and services sectors’ contributions to stressed assets, which were similar till end-March 2020 diverged in 2021. In the light of the pandemic, the Reserve Bank had announced a six-month moratorium on loan repayments till August 31, 2020 and subsequently a one-time debt restructuring plan, which were geared to cushion the impact of the pandemic on the financial ecosystem. In the post moratorium period, the asset quality of NBFCs-ND-SI worsened in the retail loans category. By end-September 2021, stressed assets in the retail sector increased substantially while those in industry sector reduced. 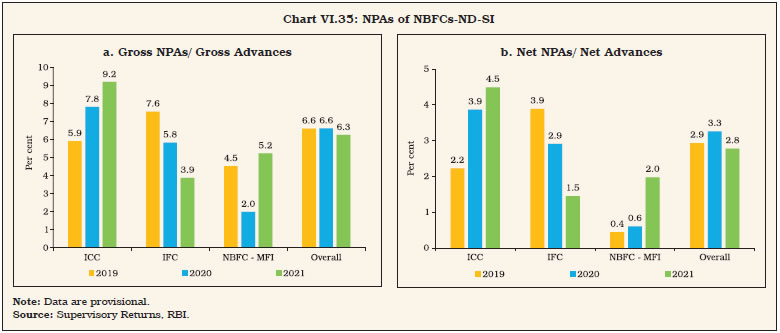
 VI.57 In the case of NBFCs-D, the GNPA ratio reduced marginally during the year. The NNPA ratio also showed a reduction, pointing to adequate provisioning (Chart VI.38). In 2021-22 so far (up to September), however, the GNPA and NNPA ratios of NBFCs-D inched up.
VI.58 Large borrowal accounts (exposure of ₹5 crore and above) constituted 52.8 per cent of NPAs and 44.9 per cent of total loans of NBFCs at end-March 2021. The large increase in restructured standard advances of NBFCs are indicative of proactive measures to arrest the impact of the pandemic on loan books. In the case of incipient stress as indicated by the share of special mention accounts (SMA), SMA-0 witnessed significant reduction while that of SMA-1 remained at the same level (Chart VI.39). SMA-2, which is on the brink of being classified as NPAs, doubled during the year which is a cause for concern. 2.11 Capital Adequacy VI.59 NBFCs are well capitalised, with their capital to risk-weighted asset ratio (CRAR) well above the stipulated level of 15 per cent. During 2020-21, NBFCs’ CRARs improved further, attributable to an increase in the level of Tier-I capital, retained earnings and moderation in non-performing assets (Chart VI.40). VI.60 All categories of NBFCs-ND-SI except the NBFCs-MFI have shown improvement in CRARs, mainly aided by higher CRARs of IFCs (Chart VI.41 a). The marginal decline in the CRAR of the NBFCs-MFI is mainly due to capital erosion and increase in their risk-weighted assets. VI.61 The CRAR of the NBFCs-D witnessed a sharp increase in 2020-21, mainly due to growth in share capital and reserves (Chart VI.41 b). 2.12 Exposure to Sensitive Sectors VI.62 The Reserve Bank has categorised the capital market, real estate, and commodities as sensitive sectors, as these assets are prone to fluctuations in value, with implications for financial stability. NBFCs’ overall exposure to sensitive sectors grew in 2020-21 mainly due to a low base (Chart VI.42).
2.13 Residuary Non-Banking Companies (RNBC) VI.63 The principal business of RNBCs is collecting deposits and deploying them in approved securities, as directed by the Reserve Bank. The number of RNBCs has consistently declined since 1998-99 and at end- March 2021, only one RNBC, which is not accepting any new deposits, remained in operation. VI.64 In sum, the balance sheet of the NBFC sector expanded moderately in 2020-21, driven by growth in both credit and investments of NBFCs-ND-SI. Public deposits of NBFCs-D increased as well, due to attractive returns. The profit parameters of NBFCs registered a decline due to the pandemic-induced economic slowdown. As regards asset quality, the GNPA and NNPA ratios fell, backed by strong provisions. The substantial rise in capital of the sector, much above the regulatory prescription, signals overall resilience of the sector. 2.14 Housing Finance Companies (HFCs) VI.65 Housing finance companies (HFCs) are specialised lending institutions which, along with SCBs, provide housing credit in India. With transferring of regulation of HFCs to the Reserve Bank by amendment of the NHB Act, 1987, effective August 9, 2019, HFCs are being treated as a category of NBFCs for regulation purposes. VI.66 In recent times, HFCs have undergone several legislative/regulatory changes to harmonise the regulations between HFCs and NBFCs in a phased manner. Based on a review, a revised regulatory framework for HFCs was issued on October 22, 2020 and again on February 17, 2021. VI.67 HFCs’ credit to the housing sector accelerated in 2020-21, primarily on account of low interest rates, availability of refinance as well as special refinance facilities and the additional special refinance facility of the NHB (which amounted to ₹13,917 crore) backed by the Reserve Bank under the Aatmanirbhar Bharat Abhiyaan. Bank credit to the housing sector, however, decelerated in 2020-21 even though it remained higher than HFCs’ credit (Chart VI.43). VI.68 At the end of March 2021, there were 10013 HFCs, of which only 16 were deposit taking entities. Five of the latter need prior permission from NHB before accepting public deposits. Non-government public limited companies dominate the segment, comprising 94.8 per cent of total assets. The combined balance sheet of these entities experienced a growth in 2020-21 after a deceleration in 2019-20. The asset size of the lone government HFC contracted in 2020-21 (Table VI.9). 2.14.1. Balance Sheet14 VI.69 The consolidated balance sheet of HFCs grew in 2020-21 on account of steep growth in borrowings from NHB, inter-corporate borrowing and reserves and surplus. On the asset side, loans and advances registered a moderate growth while investments registered an impressive growth. On the other hand, cash and bank balances, and other assets declined (Table VI.10). | Table VI.9: Ownership Pattern of HFCs | | (At end-March) | | (₹ crore) | | Type | 2020 | 2021 | | Number | Asset Size | Number | Asset Size | | 1 | 2 | 4 | 5 | 7 | | A. Government Companies | 1 | 79,535 | 1 | 76,959 | | B. Non-government Companies (1+2) | 99 | 13,14,329 | 99 | 14,05,904 | | 1. Public Ltd. Companies | 75 | 13,09,762 | 78 | 14,01,522 | | 2. Private Ltd. Companies | 24 | 4,568 | 21 | 4,382 | | Total (A+B) | 100 | 13,93,865 | 100 | 14,82,863 | Note: Data are provisional.
Source: NHB. |
| Table VI.10: Consolidated Balance Sheet of HFCs | | (At end-March) | | (₹ crore) | | Items | 2019 | 2020 | 2021 | Percentage variation | | 2020 | 2021 | | 1 | 2 | 3 | 4 | 5 | 6 | | 1 Share capital | 34,048 | 36,858 | 37,696 | 8.3 | 2.3 | | 2 Reserves and surplus | 1,51,706 | 1,45,053 | 1,70,359 | -4.4 | 17.4 | | 3 Public deposits | 1,05,895 | 1,19,795 | 1,26,691 | 13.1 | 5.8 | | 4 Debentures | 4,66,689 | 3,97,949 | 3,97,816 | -14.7 | 0.0 | | 5 Bank borrowings# | 2,98,943 | 3,53,214 | 3,29,835 | 18.2 | -6.6 | | 6 Borrowings from NHB # | 42,118 | 49,673 | 67,341 | 17.9 | 35.6 | | 7 Inter-corporate borrowings | 35,627 | 6,206 | 19,182 | -82.6 | 209.1 | | 8 Commercial papers | 79,059 | 46,631 | 54,554 | -41.0 | 17.0 | | 9 Borrowings from Government*** | 0 | 1,282 | 19,313 | 0 | - | | 10 Subordinated debts | 18,320 | 17,348 | 19,168 | -5.3 | 10.5 | | 11 Other borrowings | 25,103 | 1,49,404 | 1,31,818 | 495.2 | -11.8 | | 12 Current liabilities | 13,740 | 20,446 | 8,100 | 48.8 | -60.4 | | 13 Provisions^ | 8,569 | 7,499 | 64,303 | -12.5 | 757.5 | | 14 Other* | 40,021 | 42,508 | 36,686 | 6.2 | -13.7 | | 15 Total Liabilities/ Assets | 13,19,840 | 13,93,865 | 14,82,863 | 5.6 | 6.4 | | 16 Loans and advances | 1,163,148 | 11,83,561 | 12,77,653 | 1.8 | 7.9 | | 17 Hire purchase and lease assets | 0 | 33 | 10 | - | -70.4 | | 18 Investments | 88,640 | 97,931 | 1,29,961 | 10.5 | 32.7 | | 19 Cash and bank balances | 33,166 | 56,955 | 36,864 | 71.7 | -35.3 | | 20 Other assets** | 34,885 | 55,384 | 38,375 | 58.8 | -30.7 | ^The sudden increase in provisions is due to high provision reported by one major HFC.
*includes deferred tax liabilities and other liabilities.
**includes tangible & intangible assets, other assets, and deferred tax asset.
*** includes borrowings from foreign government also.
# Figures have been revised.
Notes: Data are provisional.
Source: NHB. | 2.14.2. Resource Profile of HFCs VI.70 HFCs primarily rely on debentures and bank borrowings for funds, which constitute around 66 per cent of total resources (Chart VI.44). The dependence of HFCs on bank borrowings decelerated in 2020-21; however, dependence on borrowings from NHB and public deposits increased, reflecting their reliance on long term-resources amidst risk averse market conditions. VI.71 Public deposits, another important source of funding, decelerated in 2020-21 (Chart VI.45). Furthermore, the share of deposits in total liabilities of HFCs has been steadily declining since 2015-16 till 2020-21 with the exception of 2019-20. VI.72 The distribution of deposits with HFCs in 2020-21 shows that there is a concentration of deposits in the 6-9 per cent interest rate bracket. A significant growth has been observed in deposits in the below 6 per cent interest rate bracket due to the low interest rate environment (Chart VI.46). The maximum share of deposits is in the maturity bracket of 24 to 48 months.
2.14.3. Financial Performance VI.73 The consolidated income of HFCs decelerated in 2020-21 on account of moderation of fee income and stagnant fund income. Income as a proportion to total assets decreased on account of decrease in fund income (Chart VI.47). VI.74 Furthermore, expenditure also decreased mainly on account of deceleration in both financial expenditure and operating expenditure. As a result, there was a significant decrease in the cost to income ratio in 2020-21. Meanwhile, the RoA reached zero (Table VI.11). 2.14.4. Soundness Indicators VI.75 The GNPA ratio of HFCs increased in 2020-21. However, the NNPA ratio decreased in 2020-21 on account of significant increase in provisioning. Two major HFCs registered spikes in their GNPA and NNPA ratios in 2020-21. Excluding these two major HFCs, GNPA and NNPA ratios stood at 3.1 per cent and 1.7 per cent, respectively, in 2020-21 (Chart VI.48a and b). 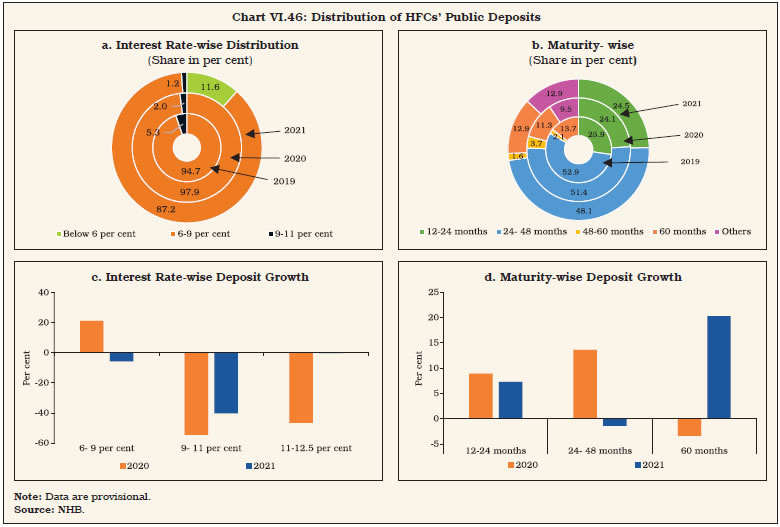
 VI.76 To sum up, in 2020-21, HFCs have been able to sustain momentum with moderate growth in credit demand. After the outbreak of COVID-19, several regulatory and liquidity measures were announced by the Reserve Bank, along with the announcement of the Aatmanirbhar Bharat Abhiyaan by the Government, which resulted in an improvement in the liquidity position of HFCs. The recent uptick in sales of housing inventories on account of reopening of economy, the benign interest rate environment and incentives in stamp duty reductions aided the sector. Furthermore, HFCs took several proactive steps to counter the impact of the pandemic on their business by adopting work-from-home processes which helped in ensuring continuity of business even during the lockdown and made them digitally enabled for sourcing, processing, and disbursing loans. Efforts towards digitisation also might have contributed towards reducing their operating expenditure. | Table VI.11: Financial Ratios of HFCs | | (As per cent of Total Assets) | | (At end-March) | | Particulars | 2017 | 2018 | 2019 | 2020 | 2021 | | 1 | 2 | 3 | 4 | 5 | 6 | | Total Income | 10.0 | 9.0 | 9.9 | 10.2 | 8.7 | | 1. Fund Income | 9.8 | 8.8 | 9.7 | 10.1 | 8.6 | | 2. Fee Income | 0.2 | 0.2 | 0.2 | 0.1 | 0.1 | | Total Expenditure | 7.4 | 6.6 | 7.9 | 8.8 | 6.7 | | 1. Financial Expenditure | 6.4 | 5.6 | 6.4 | 6.4 | 5.4 | | 2. Operating Expenditure | 0.9 | 1.0 | 1.5 | 2.4 | 1.3 | | Tax Provision | 0.8 | 0.7 | 0.7 | 0.6 | 0.9 | | Cost to Income Ratio (Total Exp./Total Income) | 73.6 | 73.6 | 79.3 | 86.2 | 76.4 | | Return on Assets (RoA) (PAT/Total Assets) | 2.1 | 2.0 | 1.4 | -0.2 | 0.0 | Note: Data are provisional.
Source: NHB. |
3. All India Financial Institutions VI.77 At end-March 2021, there were four all India financial institutions (AIFIs) viz., the National Bank for Agriculture and Rural Development (NABARD), the Small Industries Development Bank of India (SIDBI) and the National Housing Bank (NHB), which play a critical role in meeting the long-term funding requirements of agriculture and the rural sector, small industries, housing finance companies, NBFCs and MFIs, respectively. The fourth AIFI - Export Import Bank of India (EXIM Bank)-functions as the principal financial institution promoting the country’s international trade and providing financial assistance to exporters and importers. The Reserve Bank regulates and supervises these four AIFIs. 3.1 AIFIs’ Operations15 VI.78 In response to the pandemic, financial assistance sanctioned by AIFIs registered a robust growth during 2020-21 as compared with the previous year. The increase was primarily on account of a 65 per cent rise in sanctions by NABARD. Disbursements too gained traction during 2020-21. NABARD recorded the highest disbursement growth, reflecting its thrust on the agricultural and rural sector, production and marketing credit, the long term irrigation fund and the micro irrigation fund. Increase in the disbursements by NHB could be attributed to the support for the Pradhan Mantri Awas Yojana (PMAY). Disbursements by SIDBI remained stagnant during the year. Financial assistance sanctioned by EXIM Bank declined on account of slowdown in exports and subdued macroeconomic conditions in partner countries (Table VI.12). Disbursements by EXIM Bank, however, increased moderately (Appendix Table VI.7). | Table VI.12: Financial Assistance Sanctioned & Disbursed by AIFIs | | Institutions | Sanctions | Disbursements | | 2019-20 | 2020-21 | 2019-20 | 2020-21 | | 1 | 2 | 3 | 4 | 5 | | EXIM BANK | 40,255 | 36,521 | 33,735 | 34,122 | | NABARD | 2,78,883 | 4,59,849 | 2,81,811 | 3,50,022 | | NHB | 36,594 | 37,791 | 31,258 | 34,230 | | SIDBI | 1,09,826 | 1,05,588 | 98,354 | 98,115 | | Total | 4,65,558 | 6,39,748 | 4,45,159 | 5,16,489 | Note: Data are provisional.
Source: Respective Financial Institutions. | 3.2 Balance Sheet VI.79 The consolidated balance sheet of AIFIs expanded in 2020-21 after decelerating in 2019-20 (Table VI.13). This was mainly on account of substantial growth in investments and loans and advances, particularly by NABARD. Loans and advances constituted the largest share in the total assets of AIFIs, followed by investments. On the liabilities side, AIFIs’ reliance on bond and debentures increased in 2020-21. Borrowings recorded a robust growth due to favourable base effect. This was mainly on account of the steep increase in borrowings by NABARD to finance its enhanced credit disbursements and investment activities during the pandemic. VI.80 In the COVID-19 pandemic, special refinance facilities for a total amount of ₹75,000 crore were provided during 2020-21 to all AIFIs for a period of one year. Furthermore, in consonance with the policy objective of nurturing still nascent growth impulses, fresh support of ₹50,000 crore is allocated to the AIFIs for lending in 2021-22. Accordingly, NABARD is provided with a special liquidity facility (SLF) of ₹ 25,000 crore to support agriculture and allied activities, the rural non-farm sector, and NBFC-MFIs. Similarly, NHB is allocated with ₹ 10,000 crore to cater to the needs of the housing sector and SIDBI is allocated ₹15,000 crore to meet the funding requirements of MSMEs. | Table VI.13: AIFIs’ Balance Sheet | | (₹ crore) | | Liabilities | 2020 | 2021 | Percentage variation | | 2020-21 | | 1 | 2 | 3 | 4 | | 1. Capital | 29,921 | 32,221 | 7.7 | | | (3.2) | (3.0) | | | 2. Reserves | 63,522 | 71,025 | 11.8 | | | (6.8) | (6.6) | | | 3. Bonds & Debentures | 2,63,425 | 3,27,427 | 24.3 | | | (28.0) | (30.4) | | | 4. Deposits | 3,86,678 | 4,12,001 | 6.5 | | | (41.1) | (38.3) | | | 5. Borrowings | 1,38,621 | 1,70,820 | 23.2 | | | (14.7) | (15.9) | | | 6. Other Liabilities | 58,105 | 62,023 | 6.7 | | | (6.2) | (5.8) | | | Total Liabilities / Assets | 9,40,271 | 10,75,516 | 14.4 | | 1. Cash & Bank Balances | 35,078 | 34,595 | -1.4 | | | (3.7) | (3.2) | | | 2. Investments | 59,868 | 79,275 | 32.4 | | | (6.4) | (7.4) | | | 3. Loans & Advances | 8,25,620 | 9,44,318 | 14.4 | | | (87.8) | (87.8) | | | 4. Bills Discounted /Rediscounted | 1,395 | 1,410 | 1.1 | | | (0.1) | (0.1) | | | 5. Fixed Assets | 1,221 | 1,273 | 4.3 | | | (0.1) | (0.1) | | | 6. Other Assets | 17,089 | 14,646 | -14.3 | | | (1.8) | (1.4) | | Notes: Figures in parentheses are percentages of total liabilities/assets.
Data are provisional.
Source: Respective Financial Institutions. | VI.81 Further, in order to meet MSMEs’ short-and medium-term credit needs to kick start the investment cycle, a Special Liquidity Facility of ₹16,000 crore was granted to SIDBI for on-lending/ refinancing. VI.82 Total resources raised by AIFIs (except for NABARD) decreased in 2020-21. EXIM Bank resorted to higher short-term borrowings. Out of total resources raised in 2020-21, NABARD mobilised the highest share, followed by NHB, SIDBI and EXIM Bank. Putting together, NABARD and NHB accounted for 80 per cent of the total resources. Except SIDBI, AIFIs largely rely on short-term funds for financing their activities. NHB raises over 93 per cent of its resources via short term instruments (Table VI.14). VI.83 The NABARD and the EXIM Bank together constituted around 80 per cent of resources raised by AIFIs from the money market. While resources raised through CDs decreased, resources raised through CPs increased for AIFIs. The utilisation of borrowing under umbrella limit remained lower in 2020-21 than a year ago (Table VI.15). 3.3 Sources and Uses of Funds VI.84 Funds raised and deployed by the AIFIs in 2020-21 registered a rapid growth although there was marginal contraction in total fresh deployment by AIFIs. The share of repayment of past borrowings in resources mobilised increased in 2020-21 as compared to the previous year (Table VI.16). | Table VI.14: Resources Mobilised by AIFIs in 2020-21 | | (₹ crore) | | Institution | Total Resources Raised | Outstanding | | Long-Term | Short-Term | Foreign Currency | Total | | 1 | 2 | 3 | 4 | 5 | 6 | | EXIM BANK | 0 | 35,146 | 14,841 | 49,987 | 1,09,617 | | NABARD | 1,45,641 | 1,71,655 | 0 | 3,17,296 | 5,60,237 | | NHB* | 9,879 | 1,30,975 | 0 | 1,40,854 | 78,028 | | SIDBI** | 40,450 | 24,270 | 0 | 64,720 | 1,63,008 | | Total | 1,95,970 | 3,62,046 | 14,841 | 5,72,857 | 9,10,890 | Note: Long-term rupee resources comprise borrowings by way of bonds/debentures; while short-term resources comprise CPs, term deposits, ICDs, CDs and borrowings from the term money market. Foreign currency resources largely comprise of borrowings by issuing of bonds in the international market.
* Short-term resources figure represents the borrowing through transactions in the overnight triparty Repo Dealing and Settlement (TREPS) on a roll-over basis (gross amount on roll-over basis).
**Short-Term under Total Resources Raised also include Short Term Loans from Banks.
Source: Respective Financial Institutions. |
| Table VI.15: Resources Raised by AIFIs from the Money Market | | (At end-March)# | | (₹ crore) | | Instrument | 2019-20 | 2020-21 | | 1 | 2 | 3 | | A. Total | 1,20,294 | 99,068 | | i) Term Deposits | 1,298 | 3,396 | | ii) Term Money | 7,211 | 3,602 | | iii) Inter-corporate Deposits | 8,177 | - | | iv) Certificate of Deposits | 46,240 | 21,275 | | v) Commercial Paper | 57,368 | 70,795 | | Memo: | | | | B. Umbrella Limit | 1,17,538 | 1,34,662 | | C. Utilization of Umbrella limit* (A as percentage of B) | 102.3 | 73.6 | #: End-June for NHB. *: Resources raised under A.
Note: AIFIs are allowed to mobilise resources within the overall ‘umbrella limit’, which is linked to the net owned funds (NOF) of the FI concerned as per its latest audited balance sheet. The umbrella limit is applicable for five instruments– term deposits; term money borrowings; certificates of deposits (CDs); commercial paper (CPs); and inter-corporate deposits.
Source: Respective Financial Institutions. |
| Table VI.16: Pattern of AIFIs’ Sources and Deployment of Funds | | (₹ crore) | | Items | 2019-20 | 2020-21 | Percentage variation | | 1 | 2 | 3 | 4 | | A. Sources of Funds | | | | | i. Internal | 36,18,908 | 44,97,117 | 24.3 | | | (84.0) | (80.2) | | | ii. External | 5,65,094 | 8,82,814 | 56.2 | | | (13.1) | (15.8) | | | iii. Others@ | 1,24,634 | 2,25,134 | 80.6 | | | (2.9) | (4.0) | | | Total (i+ii+iii) | 43,08,636 | 56,05,065 | 30.1 | | | (100) | (100) | | | B. Deployment of Funds | | | | | i. Fresh Deployment | 8,05,090 | 8,03,936 | -0.1 | | | (18.7) | (14.3) | | | ii. Repayment of Past Borrowings | 22,93,775 | 32,55,032 | 41.9 | | | (53.4) | (58.1) | | | iii. Other Deployment | 11,95,171 | 15,46,098 | 29.4 | | | (27.8) | (27.6) | | | of which: Interest Payments | 39,408 | 39,344 | -0.2 | | | (0.9) | (0.7) | | | Total (i+ii+iii) | 42,94,037 | 56,05,065 | 30.5 | | | (100) | (100) | | @: Includes cash and balances with banks and the Reserve Bank of India
Note: Figures in parentheses are percentages of total. Data are provisional.
Source: Respective Financial Institutions. |
3.4 Maturity and Cost of Borrowings and Lending VI.85 AIFIs were able to borrow at lower rates as the weighted average cost (WAC) of rupee resources decreased substantially in 2020-21 vis-à-vis the previous year due to accommodative monetary policy. NHB recorded the highest decline in its long-term prime lending rate (PLR)-170 bps- followed by SIDBI (Chart VI.49a, Chart VI.49b and Chart VI.50). 3.5 Financial Performance VI.86 AIFIs registered a marginal growth in income during 2020-21, mainly on account of deceleration in interest income, which constitutes around 97 per cent of total income. Expenditure, on the other hand, contracted during 2020-21, primarily on account of contraction in interest expenditure and the wage bill. Consequently, net profits of AIFIs posted an impressive growth during 2020-21 (Table VI.17). | Table VI.17: Financial Performance of AIFIs | | (₹ crore) | | Type | 2019-20 | 2020-21 | Percentage Variation | | 2019-20 | 2020-21 | | 1 | 2 | 3 | 4 | 5 | | A) Income | 58,460 | 59,291 | 8.3 | 1.4 | | a) Interest Income | 56,863 | 57,597 | 7.9 | 1.3 | | | (97.3) | (97.1) | | | | b) Non-Interest Income | 1,597 | 1,694 | 27.0 | 6.1 | | | (2.7) | (2.9) | | | | B) Expenditure | 44,499 | 42,913 | 5.7 | -3.6 | | a) Interest Expenditure | 41,236 | 39,829 | 4.9 | -3.4 | | | (92.7) | (92.8) | | | | b) Operating Expenses | 3,263 | 3,084 | 17.0 | -5.5 | | | (7.3) | (7.2) | | | | of which Wage Bill | 2,323 | 2,203 | 16.9 | -5.2 | | C) Provisions for Taxation | 2,244 | 2,409 | -20.8 | 7.4 | | D) Profit | | | | | | Operating Profit (PBT) | 8,738 | 10,045 | -19.4 | 15.0 | | Net Profit (PAT) | 6,493 | 7,635 | 5.9 | 17.6 | Notes: 1. Figures in parentheses are percentages of total income/expenditure.
2. Data are provisional.
Source: Respective Financial Institutions. |
 VI.87 Under financial ratios, operating profit as a ratio of total average assets slightly increased during 2020-21. However, other financial ratios, except the ratio of spread to total average assets, provisions, and net profit, decreased year on year (Chart VI.51). VI.88 Interest income as a ratio of average working funds declined for all AIFIs. Operating profits of EXIM Bank, NABARD and SIDBI improved, indicating efficient utilization of working funds; however, operating profits of NHB moderated during the year (Table VI.18). VI.89 The RoA for all AIFIs marginally improved in 2020-21 (for NABARD it remained the same) (Chart VI.52). The CRAR for EXIM Bank and SIDBI improved in 2020-21, while that of NABARD and NHB moderated. 3.6 Soundness Indicators VI.90 AIFIs’ net NPAs ratios decreased during 2020-21. NABARD and NHB reported zero per cent net NPAs (Chart VI.53). | Table VI.18: AIFIs’ Select Financial Parameters | | Items | Interest Income/Average Working Funds
(per cent) | Non-interest Income/Average Working Funds
(per cent) | Operating Profit/Average Working Funds
(per cent) | Net Profit per Employee
(₹ lakh) | | 2020 | 2021 | 2020 | 2021 | 2020 | 2021 | 2020 | 2021 | | EXIM Bank | 7.2 | 6.4 | 0.4 | 0.5 | 1.8 | 2.3 | 35 | 73 | | NABARD | 6.7 | 6.1 | 0.0 | 0.0 | 1.4 | 1.5 | 108 | 127 | | NHB | 6.3 | 5.5 | 0.1 | 0.1 | 1.9 | 1.3 | 153 | 425 | | SIDBI | 6.5 | 5.7 | 0.6 | 0.5 | 2.2 | 2.3 | 221 | 237 | Note: Data are provisional.
Source: Respective Financial Institutions. |
VI.91 Overall, AIFIs’ stable asset quality as reflected in the ratio of standard assets increased in 2020-21 (Chart VI.54). VI.92 In order to strengthen the financial health of AIFIs, the Reserve Bank has released draft Master Directions on October 22, 2021 on prudential regulations on Basel III capital framework, exposure norms, significant investments, classification, valuation and operation of investment portfolio norms and resource raising norms for AIFIs for public comments. VI.93 The consolidated balance sheet of AIFIs expanded on account of ample liquidity support by the Reserve Bank as well as higher borrowings by them. AIFIs’ reliance on deposits and bonds & debentures remained high. AIFIs’ net NPA ratios decreased during the year and the ratio of standard assets increased. 4. Primary Dealers VI.94 As on March 31, 2021 there were 21 primary dealers (PDs), of which 14 function as bank departments and 7 as standalone PDs (SPDs), the latter registered as NBFCs under section 45 IA of the RBI Act, 1934. 4.1 Operations and Performance of PDs VI.95 PDs are financial intermediaries mandated to take part in the all-round development of the primary and secondary government securities market, underwrite issuances of government dated securities and participate in primary auctions. They are also mandated to achieve a minimum success ratio (bids accepted as a proportion to bidding commitment) of 40 per cent in primary auctions of T-bills and Cash Management Bills (CMBs), assessed on a half-yearly basis. In 2020-21, all PDs achieved their minimum bidding commitments and subscribed to 68.9 per cent of the notified amount of T-Bills / CMBs issued during the year. During the year, the Government of India issued dated securities with a face value of ₹13,70,324 crore (Notified amount was ₹12, 85,000 crore) through auctions, as against ₹7,10,000 crore issued during the previous year. PDs’ share of allotment in the primary issuance of dated securities increased. In H1:2021-22, PDs achieved a success ratio of 62.50 per cent against their bidding commitment in T-Bills and CMBs. Also, against the total notified amount of dated Government securities of ₹6,57,000 crore, allotment to PDs stood at 46.5 per cent which was lower than 52.4 per cent during H1: 2020-21 (Table VI.19). VI.96 Partial devolvement on PDs took place on fifteen instances amounting to ₹1,30,562 crore during 2020-21 as against two instances amounting to ₹3,606 crore in 2019-20. The underwriting commission paid to PDs during 2020-21 was considerably higher at ₹455 crore, compared to ₹41 crores paid in the previous year. The increase in the underwriting commission, being strongly co-related to market conditions, can be attributed to the enlarged quantum of borrowing. During H1:2021-22, there were nine instances of devolvement aggregating to ₹75,802 crore. The underwriting commission paid to the PDs during the half year amounted to ₹309 crore, which works out to 4.82p/₹100 (Chart VI.55). | Table VI.19: Performance of PDs in the Primary Market | | (₹ crore) | | Items | 2019-20 | 2020-21 | H1: 2021-22 | | 1 | 2 | 3 | 4 | | Treasury Bills and CMBs | | | | | (a) Bidding commitment | 13,83,666 | 17,35,783 | 7,88,880 | | (b) Actual bids submitted | 41,92,322 | 49,05,302 | 19,39,626 | | (c) Bid to cover ratio | 3.0 | 2.8 | 2.5 | | (d) Bids accepted | 8,51,816 | 10,24,732 | 4,92,935 | | (e) Success ratio (d) / (a) (in Per cent) | 61.6 | 59.0 | 62.5 | | Central Government Dated Securities | | | | | (f) Notified amount | 7,10,000 | 12,85,000 | 6,57,000 | | (g) Actual bids submitted | 15,31,570 | 24,54,253 | 13,25,625 | | (h) Bid to cover ratio | 2.16 | 1.91 | 2.02 | | (i) Bids of PDs accepted | 3,40,610 | 6,80,763 | 3,26,815 | | (j) Share of PDs (i) / (f) (Per cent) | 48.0 | 49.7* | 46.5** | *Calculated with respect to the total accepted amount of ₹13,70,324 crore.
**Calculated with respect to the total accepted amount of ₹7,02,357 crore.
Source: Returns filed by PDs. |
 VI.97 All PDs individually achieved the required minimum annual total turnover ratio (both in outright and repo transactions) for dated Government securities, set at 5 times the average month-end stock of securities held by them. Similarly, the minimum ratio to be achieved through outright transactions exclusively is 3 times. For T-Bills, the corresponding minimum targets are 10 times and 6 times, respectively. 4.2 Performance of Standalone PDs VI.98 In the secondary market outright segment, the quantum of turnover of standalone primary dealers (SPDs) decreased in comparison with the previous year. In the repo segment, the quantum of turnover by SPDs increased over the previous year. The share of SPDs in total market turnover decreased marginally during the year (Table VI.20). 4.3 Sources and Application of SPDs’ Funds VI.99 Funds mobilised by SPDs rose on a year-on-year basis in 2020-21. Borrowings remained the major source of SPDs’ funding. The quantum of secured loans increased marginally whereas unsecured loans decreased. The largest share of investments of SPDs is held in the form of current assets (Table VI.21). | Table VI.20: Performance of SPDs in the G-secs Secondary Market | | (₹ crore) | | Items | 2019-20 | 2020-21 | H1: 2021-22 | | 1 | 2 | 3 | 4 | | Outright | | | | | Turnover of SPDs | 36,56,472 | 24,71,523 | 14,00,727 | | Market turnover | 1,33,08,365 | 1,00,32,187 | 48,35,156 | | Share of SPDs (Per cent) | 27.5 | 24.6 | 29.0 | | Repo | | | | | Turnover of SPDs | 69,29,624 | 90,75,360 | 47,20,772 | | Market turnover | 1,47,99,714 | 2,27,70,547 | 1,19,59,276 | | Share of SPDs (Per cent) | 46.8 | 39.9 | 39.5 | | Total (Outright + Repo) | | | | | Turnover of SPDs | 1,05,86,096 | 1,15,46,883 | 61,21,499 | | Market turnover | 2,81,08,079 | 3,28,02,734 | 1,67,94,432 | | Share of SPDs (Per cent) | 37.7 | 35.2 | 36.4 | | Source: Clearing Corporation of India Ltd. |
| Table VI.21: Sources and Applications of SPDs’ Funds | | (₹ crore) | | Items | 2019-20 | 2020-21 | H1: 2021-22 | Percentage variation 2020-21 over 2019-20 | | 1 | 2 | 3 | 4 | 5 | | Sources of Funds | 69,573 | 71,986 | 69,864 | 3.5 | | 1. Capital | 1,609 | 1,849 | 1,849 | 14.9 | | 2. Reserves and surplus | 5,154 | 7,011 | 7,336 | 36.0 | | 3. Loans (a+b) | 62,810 | 63,127 | 60,678 | 0.5 | | (a) Secured | 49,181 | 50,374 | 45,915 | 2.4 | | (b) Unsecured | 13,629 | 12,752 | 14,763 | -6.4 | | Application of Funds | 69,573 | 71,986 | 69,864 | 3.5 | | 1. Fixed assets | 44 | 44 | 41 | 2.0 | | 2. HTM investments (a+b) | 493 | 154 | 1,805 | -68.8 | | (a) Government securities | 358 | - | 1,634 | -100.0 | | (b) Others | 135 | 154 | 171 | 13.7 | | 3. Current assets | 71,074 | 72,389 | 66,145 | 1.9 | | 4. Loans and advances | 809 | 1,986 | 4,931 | 145.5 | | 5. Current liabilities | 2,847 | 2,616 | 3,050 | -8.1 | | 6. Deferred tax | 1 | 32.7 | -6.8 | 3167.5 | | 7. Others | -1 | -3.2 | -1.4 | 302.5 | | Source: Returns submitted by PDs | 4.4 Financial Performance of SPDs VI.100 A substantial increase was observed in the SPDs’ profit after tax (PAT) in 2020-21 vis-à-vis previous year on account of sharp contraction in interest expenses. Trading profits also witnessed a substantial increase. Income remained at almost similar levels whereas expenditure decreased in comparison with the previous year, resulting in higher profits for the SPDs during 2020-21. During H1: 2021-22, there was a decrease in PAT on account of reduced trading profits (Table VI.22 and Appendix Table VI.8). VI.101 SPDs’ return on net worth increased in 2020-21 vis-a-vis 2019-20. On account of increased trading profits and the sharp drop in expenditure, the cost to income ratio decreased, reflecting improved operating efficiency (Table VI.23). VI.102 The combined CRAR for all SPDs increased in 2020-21 and remained comfortably above the mandated 15 per cent. Capital buffers of the SPDs improved substantially during the year (Chart VI.56 and Appendix Table VI.9). | Table VI.22: Financial Performance of SPDs | | (₹ crore) | | Items | 2019-20 | 2020-21 | H1: 2021-22 | Variation 2020-21 over 2019-20 | | Amount | Per cent | | 1 | 2 | 3 | 4 | 5 | 6 | | A. Income (i to iii) | 5,367 | 5,386 | 2,493 | 19 | 0.3 | | (i) Interest and discount | 4,628 | 4,173 | 2,141 | -455 | -9.9 | | (ii) Trading profits | 682 | 1,008 | 248 | 326 | 47.8 | | (iii) Other income | 57 | 205 | 103 | 148 | 259.0 | | B. Expenses (i to ii) | 3,663 | 2,493 | 1,319 | -1,170 | -31.9 | | (i) Interest | 3,209 | 2,130 | 1,127 | -1,079 | -33.6 | | (ii) Other expenses including establishment and administrative costs | 454 | 364 | 192 | -90 | -19.9 | | C. Profit before tax | 1,687 | 2,582 | 1,031 | 895 | 53.0 | | D. Profit after tax | 1,276 | 1,938 | 766 | 662 | 51.9 | Note: Figures may not add up due to rounding-off.
Source: Returns submitted by PDs |
| Table VI.23: SPDs’ Financial Indicators | | (₹ crore) | | Indicators | 2019-20 | 2020-21 | H1: 2021-22 | | 1 | 2 | 3 | 4 | | (i) Net profit | 1,276 | 1,938 | 766 | | (ii) Average assets | 69,631 | 77,357 | 80,256 | | (iii) Return on average assets (Per cent) | 1.9 | 2.6 | 1.0 | | (iv) Return on net worth (Per cent) | 21.3 | 26.0 | 8.7 | | (v) Cost to income ratio (Per cent) | 21.0 | 11.2 | 14.0 | | Source: Returns submitted by PDs | 5. Overall Assessment VI.103 The pandemic has tested the resilience of NBFCs, but so far, the sector has emerged stronger with reasonable balance sheet growth, increased credit intermediation, higher capital, lower delinquency ratio and enlarged liquidity cushions. Various policies in the aftermath of the pandemic ensured liquidity support, moratorium and asset classification standstill eased financial conditions and gave NBFCs adequate time and wherewithal to weather the shock and leverage on their grass root level reach to channelize credit to productive sectors and revive growth. Many NBFCs have adopted strong credit risk assessment frameworks to ensure the quality of credit creation. The Reserve Bank has introduced scale-based regulation to enhance the regulatory oversight over the sector effective October 2022. To further strengthen the supervisory tools applicable to NBFCs, the Reserve Bank issued Prompt Corrective Action Framework for NBFCs effective October 2022. The recent amendment of the Factoring Regulation Act can incentivise all NBFCs to boost the MSME sector. Many NBFCs have used the pandemic to reinvent their business models, realising the power of data analytics and Big Data in business applications. In this regard, many have tied up with FinTech firms to leverage on technological innovations. NBFCs need to be better equipped and focused on cyber fraud prevention. In this regard, the Reserve Bank has placed a report on digital lending including lending through online platforms and mobile apps on November 18, 2021 in the public domain. The Reserve Bank’s recent act of superseding the boards of NBFCs which failed to repay debts is evidence of the vigil the regulator has on the sector in protecting stakeholders’ interests and preventing adverse impacts on the financial system. 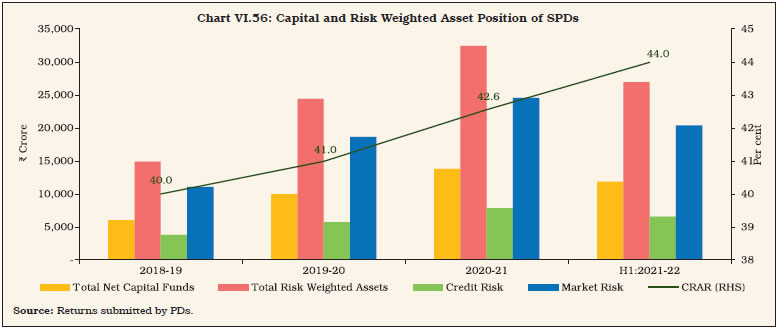 VI.104 HFCs also took several proactive steps to counter the impact of COVID-19 and ensure continuity of business during the lockdown by resorting to digitally-enabled services for sourcing, processing, and disbursing loans. Going forward, given the growing population and the under penetrated market, affordable housing finance has huge potential. The consolidated balance sheet of AIFIs expanded at a fast pace on account of ample liquidity support by the Reserve Bank. VI.105 With increased pace of vaccinations and the broadening revival of the economy, the NBFC sector is expected to remain buoyant. The financial system is maturing from a bank-dominated space to a hybrid system wherein non-bank intermediaries are gaining prominence. The developments in the sector in 2020-21 are a harbinger of even brighter prospects in the years ahead.
|