Press Release RBI Working Paper Series No. 04 Macroeconomic Effects of Uncertainty: A Big Data Analysis for India @Nalin Priyaranjan and Bhanu Pratap Abstract * Uncertainty about the current state and near-term outlook of an economy as well as the likely course of future policy actions can prompt economic agents to alter their decisions to spend, save, invest and hire. In this paper, we construct three alternative indices to measure the level of uncertainty for the Indian economy. The first two uncertainty indices are constructed by applying text mining and natural language processing (NLP) techniques on a dataset compiled from leading Indian business newspapers. The third index is based on internet search intensity data available from Google Trends. Empirical findings from a Local Projections-based econometric framework suggest that uncertainty shocks influence financial markets as well as the real economy in India. Our results indicate that both investment activity and real GDP growth slow down when uncertainty increases in the economy. Such uncertainty indices can help strengthen policy simulation exercises to study the impact of low/high uncertainty scenarios and also improve near-term projection of macroeconomic variables which exhibit high degree of sensitivity to uncertainty. JEL Classification: C31, C55, E22, E32, G18 Keywords: Uncertainty, big data, economic agents, financial markets Introduction Uncertainty around the current state of the economy as well as its future outlook plays an important role in determining the evolution of macroeconomic outcomes. Economic agents find it difficult to muster confidence and take decisions when they are unsure about the likely trajectory of the economy. This prompts people to change their decisions – it may force consumers to delay consumption of goods and services or it may influence firms’ decision to invest in capital or hire labour. Until recently, only negative macroeconomic and financial outcomes, such as fall in GDP growth, employment, stock markets, corporate earnings etc., were considered to be sources of uncertainty. However, uncertainty can also arise due to political economy factors which eventually percolate into economic policies. Statements, actions and decisions taken by policymakers with respect to fiscal, monetary, structural and regulatory policies can also affect the wider economy and its future outcomes. Hence, it is important to understand the nature of uncertainty that may arise from different sources and analyse its likely impact on domestic economic activity and financial markets. An issue related to understanding the economic effects of uncertainty is the measurement of uncertainty. In general, periods of lesser uncertainty are characterized by stable economic conditions which provides a conducive environment for the economy to grow at its potential. On the contrary, higher uncertainty hurts economic activity making the economy perform below its potential. However, since uncertainty is not directly observable, alternate ways of measuring uncertainty becomes an important task. The lack of a clear definition of uncertainty makes the task of measurement even more difficult. Various methods have been suggested in the literature to measure uncertainty through observable economic and financial outcomes. Some of the most popular methods are those on financial market volatility and observed divergence in the forecasts of professional forecasters. Assuming that financial markets take into account all types of risks and factors affecting the economy – which is then reflected in prices – uncertainty can be proxied using realised or implied market volatility such as CBOE Volatility Index (VIX). Similarly, the approach based on forecasts by professional forecasters assumes that such forecasts consider all possible information available at that time. If forecasters disagree with each other on the current state of the economy and its outlook, there will be divergence in their forecasts. This divergence can be used to measure uncertainty. Lately, newer data sources like newspapers, economic research reports and internet search intensity have been leveraged to construct uncertainty measures. Since uncertainty ultimately affects the decisions of the economic agents – consumers, workers, investors and so on – this novel approach measures uncertainty from the perspective of economic agents. Newspapers carry analyses of financial markets, political outlook, expert opinions on the economy and thus reflect the state of the economy allowing people to form their decisions. Uncertainty is then proxied from these newspapers using various text mining techniques. Likewise, people also make use of the internet to search for information, especially when unanticipated events, such as market crashes or electoral outcomes hit the economy. The availability of internet search data in public domain has now made it possible to compute internet search-based uncertainty index. For India, to the best of our knowledge, an uncertainty index has only been made available by Baker et al. (2016), henceforth referred to as BBD-EPU index1. Most of the literature on assessing the economic impact of uncertainty in India has used BBD-EPU index (Anand and Tulin, 2014; Ghosh et al., 2017). In fact, the recent Economic Survey 2018-19 (GoI, 2019) also uses BBD-EPU index to analyse the impact of uncertainty on investment2. Thus, so far, not only there have been a limited number of studies in this area, most of these studies have relied on a single uncertainty indicator. Further, no attempts have been made to construct any alternate measures of uncertainty for India. Given the limited literature on uncertainty in India, this paper aims to contribute to the literature in the following ways. First, we compute alternative indicators of uncertainty by leveraging latest methodologies and a novel dataset compiled from newspapers and internet search intensity. Second, we empirically analyse the relationship between uncertainty, financial markets and economic activity using a generalized, robust econometric framework based on local projections method. Third, by developing a large dataset and algorithms to compute uncertainty indices, we make it possible for researchers to construct high-frequency and categorical uncertainty indicators for India for specific cases. Thus, our attempt should help further understanding of uncertainty and its impact on the economy. The rest of the paper is organised as follows. Section II reviews the literature on the concept of uncertainty and its measurement. Section III describes data and methodology for computing uncertainty indices for India. Section IV is devoted to the empirical analysis of our composite uncertainty index. We conclude the paper in Section V with some thoughts on further research in this domain. II. Review of Literature The economic concept of uncertainty was first defined by Knight (1921). While he recognized that risk and uncertainty are related, he deemed risk to follow a known probability distribution over a set of events. On the other hand, Knight defined uncertainty as “peoples’ inability to forecast the likelihood of events happening” i.e., it is a situation in which economic agents cannot predict the likely state of the economy in the future. A heightened level of uncertainty about the future inhibits the ability of economic agents to take decisions. The Global Financial Crisis 2008 is one such recent example of a period of heightened uncertainty. In fact, an increase in uncertainty during the crisis is considered as one of the main factors behind the deep recession and the prolonged recovery that followed (Stock and Watson, 2012). Since then, and not surprisingly, policymakers and economists have taken a renewed interest in understanding the channels through which uncertainty manifests and impacts the economy. From a theoretical point of view, the potential channels of transmission of uncertainty to the real economy are manifold. The first of such channels works through the firms by affecting their investment decisions. This is often termed as the “real options” channel which causes firms to postpone investments and hiring of labour (Bernanke, 1993; Pindyck, 1991; Bertola and Caballero, 1994). Similarly, the “cost of financing” channel also plays a role in reducing investment by raising the risk premium and increasing the cost of borrowing (Christiano et al., 2014; Arellano et al., 2016). The “precautionary savings” channel working at the household-level, causes people to often delay consumption expenditure on durable goods – such as houses and cars – when they encounter high uncertainty (Kimball, 1990; Eberly, 1994). While the transmission channels mentioned above impede consumption, investment and hiring, uncertainty can also have a “positive” effect on economic activity under certain conditions. The Oi-Hartman-Abel effect (Oi, 1961; Hartman, 1972; Abel, 1983) postulates that if agents can flexibly expand to benefit from good outcomes, and, quickly contract during bad outcomes, they may benefit from increased uncertainty. Such an effect, however, is believed to be strong only in the medium to long run. With the piquing interest in uncertainty as a real macroeconomic phenomenon, the literature has also analysed the economy-wide impact of uncertainty. According to Bloom (2014), the empirical literature on uncertainty seems to have taken three main approaches to identify the causal impact of uncertainty on firms and consumers. The first of these approaches relies on estimating the movement of output, investment and employment following increases in uncertainty (Bloom et al., 2007; Novy and Taylor, 2014). This approach works well in the case of unanticipated shocks to uncertainty but not when such shocks are correlated with other unobserved factors or are predicted in advance. The second approach uses structural models to quantify the impact of uncertainty shocks. In a general equilibrium model with heterogeneous firms, labour and capital adjustment costs, and countercyclical uncertainty, Bloom et al. (2012) found that average increase in uncertainty during recessions reduces output by 3 per cent followed by a rapid recovery, in the first and second year, respectively. On the other hand, some studies have found only a marginal impact of uncertainty on growth (Bachmann and Bayer, 2013; Born and Pfeifer, 2014). Such mixed results are regarded to be symptomatic of sensitive modelling assumptions and linear nature of standard business cycle models. Nevertheless, accounting for the nonlinear impact of uncertainty on economic activity has been found to produce much amplified effects (Basu and Bundick, 2017). Uncertainty shocks have also been found to have high impact in the presence of frictions in the labour and financial markets (Bonciani and van Roye, 2016; Leduc and Liu, 2016). Moving from business cycle effects of uncertainty to its potential impact in the long run, Bianchi et al. (2018), Bonciani and Oh (2019) found that uncertainty shocks negatively affects economic activity in the long run. Lastly, the third approach is premised on exploiting natural experiments to estimate the uncertainty impact. Baker and Bloom (2013) use natural disasters, terrorist attacks and political shocks as instruments to capture the impact of uncertainty. Earlier, Stein and Stone (2012) use a similar approach to analyse US firms and find that firms exposed to greater uncertainty have lower investment, hiring and advertisement. Closely connected with the empirical assessment of uncertainty is the issue of its measurement. The conventional approach relies on finance or forecast-based measures to proxy uncertainty. While the finance-based approach utilizes stock market volatility indicators as a measure of uncertainty (Bloom, 2009; Gilchrist et al., 2014), the forecast-based approach models the disagreement between forecasts of professional forecasters and the actual economic outcome (Bachman et al., 2013; Scotti, 2013; Jurado et al., 2015). Departing from this conventional approach, some recent efforts have leveraged data on news articles and internet search intensity to quantify uncertainty. In their seminal work, Baker et al. (2016) use textual data from newspapers to create an index of economic policy uncertainty using the frequency of usage of certain keywords in the news articles. Ghirelli et al. (2019), in a similar spirit, build on this approach by increasing both the number of keywords and newspapers, in the case of Spain. Recognising that this approach may be subject to measurement error due to human intervention, Azqueta-Gavaldon, (2017), Saltzman and Yung, (2018) and Tobback et al. (2018) use Natural Language Processing (NLP) and Machine Learning (ML) methods to create uncertainty indices using the same data source. Similarly, data on internet-based search intensity available through Google Trends has also been used to create uncertainty indices in various country-specific studies (Dzielinski, 2012; Bontempi et al., 2015; Castelnuovo and Tran, 2017). The literature generally suggests that uncertainty negatively impacts the macroeconomy and financial markets across developed and developing countries. III. Methodology – Uncertainty measures for India We begin with creating a large dataset of newspaper articles published in leading business news dailies in India during the period 2004 to 2019. Another dataset is created by downloading search intensity data from Google Trends. Using both these datasets, three alternative uncertainty indices are constructed. These uncertainty indices reflect information content available from their respective sources. Hence, with a view to have one single composite index for providing a comprehensive picture of uncertainty in the economy, we combine the uncertainty indices into a single uncertainty index using a standard principal component approach (PCA) approach. Rest of this section details the methodology used in compilation of the indices. III.1. Newspaper-based index For the index based on newspaper data, we target relevant Indian business news dailies – Economic Times, The Hindu Business Line and Financial Express – available via their online archives3. Each digital article in the online newspaper archive was downloaded and converted into machine readable format using automated programs. Our final dataset consists of more than 100,000 news articles. Following the approach adopted in Baker et al. (2016), an article is classified as indicating uncertainty if it contains at least one keyword4 from each of the three sets: E containing economy related keywords; P containing policy related keywords; and, U containing words related to uncertainty. An article fulfilling these conditions is classified as an EPU article and is assumed to convey uncertainty. Once all articles are classified, the daily count of such articles are aggregated and normalised to obtain a monthly series of our first uncertainty index. 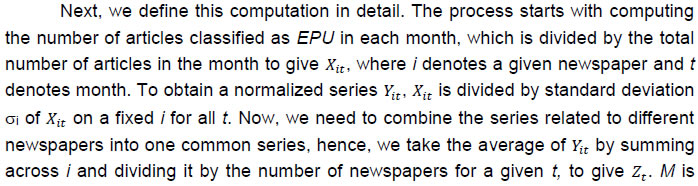 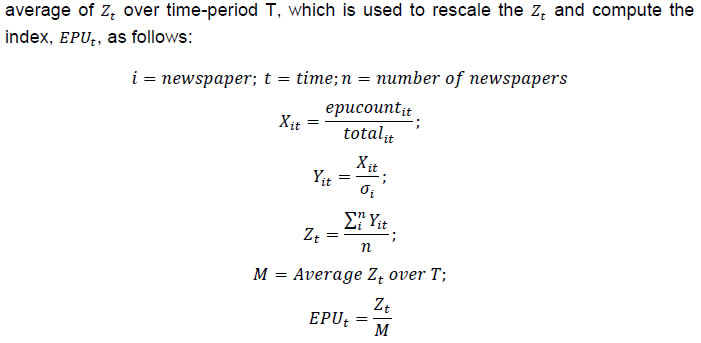 The rationale of this approach is based on the presence of certain words in a news article assuming that uncertainty in the economy is reflected and captured by news reports. In an era of widespread communication and globalisation, any favourable or unfavourable information is rapidly disseminated amongst the public. Sentiments arising from macroeconomic data and industry reports find place in the online news articles in almost real time. Thus, frequent occurrences of a set of words can provide information on an economy with the potential to be useful for macroeconomic analysis. The newspaper-based uncertainty index constructed for India is shown in Chart 1. III.2. Lexicon-based Index Sentiment analysis is a popular approach in the domain of Natural Language Processing (NLP) to convert qualitative textual information into quantitative information. Intuitively, this method assigns a sentiment score to words in a given text based on whether the word conveys a positive or negative connotation. The list of such words – lexicon – and the associated scores must be defined a priori. Nyman et al. (2018) use this approach to create a sentiment index for the UK economy. They propose that such an index, owing to its high-frequency nature and ability to capture real-time ‘sentiments’, is useful for nowcasting Gross Domestic Product (GDP) for the UK economy. Xie (2020) advocates a generalized framework to generate a public sentiment index automatically, which is found to be comparable to the BBD-EPU index. The use of sentiment score as a proxy for uncertainty is supported by the fact that when an economy goes through periods of stress, especially recessions, the public mood turns gloomy in general, along with a rise in uncertainty about the future. This ultimately gets reflected in newspaper coverage which can be quantified in the form of a net sentiment score. In this paper, we choose the lexicon provided by Loughran and McDonald (2011), developed specifically for applications in economics and finance, to create a sentiment index for India. Table 1 showcases the type of sentiments (in italics) and number of words captured in the Loughran-McDonald lexicon. | Table 1: Loughran-McDonald Lexicon – Sentiments and Total Count of Words | | Sentiment | Positive | Negative | Uncertainty | Litigious | Strong Modal | Weak Modal | Constraining | | Words | Able | Abandon | Abeyance | Abrogate | Always | Almost | Abide | | … | … | … | … | … | … | … | … | | No. of Words | 354 | 2355 | 297 | 904 | 19 | 27 | 184 | | Source: Loughran and McDonald (2011). | For each news article A containing w number of words, we compute an article-wise net sentiment score for each article in our dataset as follows: where W+ and W- denote the pre-defined positive and negative list of words based on the Loughran-McDonald lexicon. For instance, the sentiment score for typical headlines appearing in business news dailies, such as those shown below, would be: | markets | rise | to | new | high | as | mid- | and | small-caps | gain | momentum | (Total) | | 0 | 1 | 0 | 1 | 1 | 0 | 0 | 0 | 0 | 1 | 1 | 5 |
| equity | markets | down | to | three | year | low | as | growth | data | shows | weakness | (Total) | | 0 | 0 | -1 | 0 | 0 | 0 | -1 | 0 | 1 | 0 | 0 | -1 | -2 | The article-wise sentiment score is then aggregated for all articles each day of the month to arrive at a monthly sentiment index (normalized using the total number of articles (N) per month): At this stage, we de-seasonalize the index to filter out any deterministic seasonal pattern that may have crept in the data, and then detrend the index using a standard Hodrick-Prescott (HP) filter to arrive at the final index. An index value greater than zero signifies net positive public sentiment and vice-versa. The final Net Sentiment Score (NSS) Index is plotted in Chart 2. III.3. Internet search intensity-based Uncertainty Index The third index is computed based on internet search intensity of 70 keywords pertaining to fiscal, monetary and trade policies via Google Trends for the period January 2004 to February 2019. Google Trends provides search volume intensity for a given word which is a number in the range of 0 to 100, indicating relative search volume of a given word relative to the total search volume. The maximum value 100 corresponds to a particular time where the relative search volume of a given keyword was maximum in the entire sample. Increased interest in any particular topic results in increased internet searches, thus resulting in a higher index value. This forms the underlying principle for using Google Trends to construct an uncertainty index. While the topic (or keyword) may not necessarily carry any negative or uncertainty connotation by itself, increased ‘uncertainty’ in the economy (often caused due to unexpected events or policy announcements) may prompt people to search for information related to the concerned topic on the internet. To compute an uncertainty index using this approach, one must first select the list of keywords for which internet search intensity data is to be obtained and then combine the search volumes to compute the index. We select a set of 70 keywords (Appendix B) representing different types of policies and compute their search volume intensity (SVI). As our study is focused on computing uncertainty index for India, SVI for selected keywords pertains to internet searches made within India only. It is important to note here that comparing SVI between keywords is not meaningful due to their relative scaling with itself. A keyword with higher SVI relative to another keyword at time t may have a lower actual search volume compared with a frequently used word, since SVI are compared with maximum search volume of itself. To solve for this limitation and obtain a single uncertainty index, SVIs of all keywords were consolidated following Castelnuovo and Tran (2017). Since SVI does not contain the absolute magnitude of search volume, we compute SVI for each selected word relative to the SVI of a benchmark word (economy in our case). The SVI of the benchmark word (kb) computed independently is denoted by SVI*b. Since Google Trends permits inputting only five words in every instance, the fifth word is kept as a benchmark word for the purpose of consolidation; thus, only the first four words are changed and fifth remains as a benchmark in a set j. The SVI of word i in a set of words j is denoted as SVIij and of benchmark word kb in set j as SVIbj. It is important to note that SVIbj would vary from one set to another. Notwithstanding that it pertains to the same benchmark word. This is because of the relative nature of the SVI, which makes the highest searched term in the new set of words automatically valued to have a maximum of 100. Thus, to overcome this and construct the relative SVI for each word, using SVIbj, we compute the search intensity of each word which is finally used to construct the index as a ratio. A list of keywords and computational details for the index are provided in the Appendix B and C. In the last step, Google Uncertainty Index5 (GUI) for India is computed by summing the relative SVI of all the keywords (Chart 3): 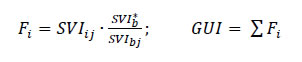 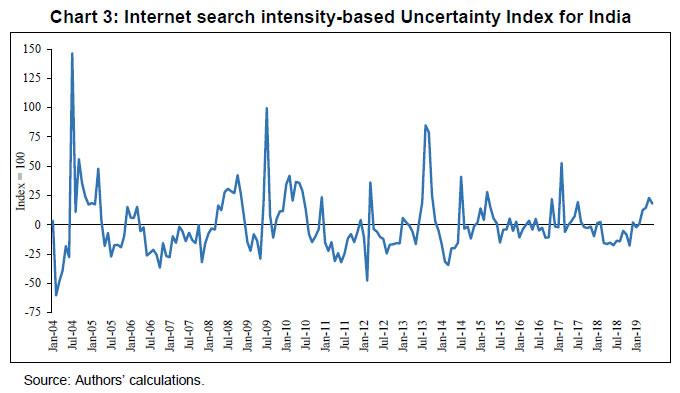 III.4. A Combined Uncertainty Index for India – INDIA-UI Index A reasonably good measure of uncertainty should be able to capture major domestic and global events that are expected to impact the economy. The newspaper-based index captures the views of market commentators and journalists on economic events and shocks. The sentiments-based index, on the other hand, suggests the nature of the overall sentiment expressed in such articles - positive or negative. As mentioned earlier, negative public sentiments and higher uncertainty coincide with each other. Lastly, when economic or financial shocks occur, people try to ‘search’ for more information to get clarity about the shock and its likely impact. This behavior is captured by the Google Trends-based index. We note that both the EPU and the GUI peak around all major domestic/global events indicating their ability to capture major events that are expected to lead to heightened uncertainty in the economy. However, no such pattern is discernible in the sentiments-based index, although it does remain negative during 2010-13, a phase of economic slowdown in India, turning sharply positive around the parliamentary elections in 2014, remaining positive almost till the end of 2016. Using a standard PCA approach, we combine the indices to arrive at our final uncertainty index, namely the ‘India Uncertainty Index’ or in short, the INDIA-UI Index (Chart 4). Both domestic and global politico-economic events are captured by the index. It can also be seen that uncertainty in the Indian economy generally increases and remains high during the recession. This broad countercyclical trend – observable across other developing and developed countries – is recognized as one of the pervasive characteristics of uncertainty (Bloom, 2014). 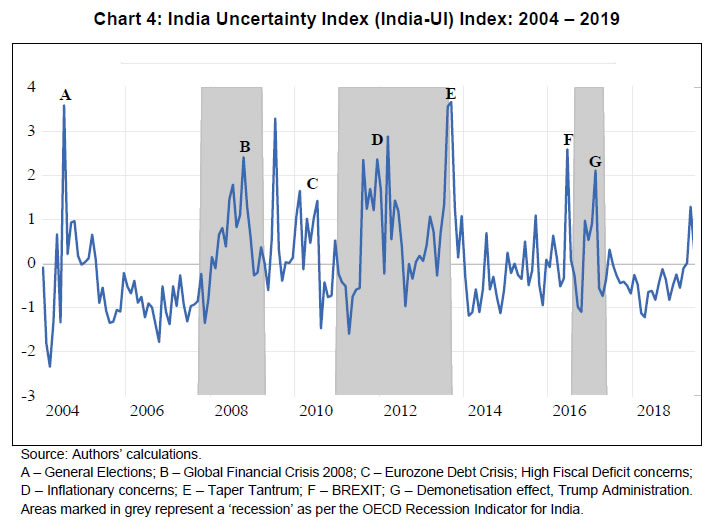 IV. Uncertainty and Indian Macroeconomy - Empirical Analysis In this section, we devote our attention to analyse the dynamic impact of uncertainty, as captured by INDIA-UI, on the Indian macroeconomy. Uncertainty, notwithstanding its source, may impact financial markets as well as the real economy leading to economy-wide adverse effects, such as heightened risk, volatility along with sharp decreases in investment, hiring and output. Chart 5 reports the sample scatter plots of INDIA-UI (shown on the x-axis in each plot) along with India-VIX index, risk premium6, monthly returns on NSE Nifty index, financial conditions index7, USD-INR exchange rate and net foreign institutional investment (net FII) for India. The VIX index and risk premium, both conventional risk measures based on financial markets, show a strong positive correlation with uncertainty. Not surprisingly, financial conditions seem to deteriorate during times of higher uncertainty. The stock market (NSE Nifty) returns are lower and it seems that the Indian Rupee (INR) also tends to face depreciation pressures against the US Dollar (USD) when uncertainty increases, although the observed correlation is not very strong. These relationships, though, are broadly in sync with the empirical literature on the impact of uncertainty on financial markets. 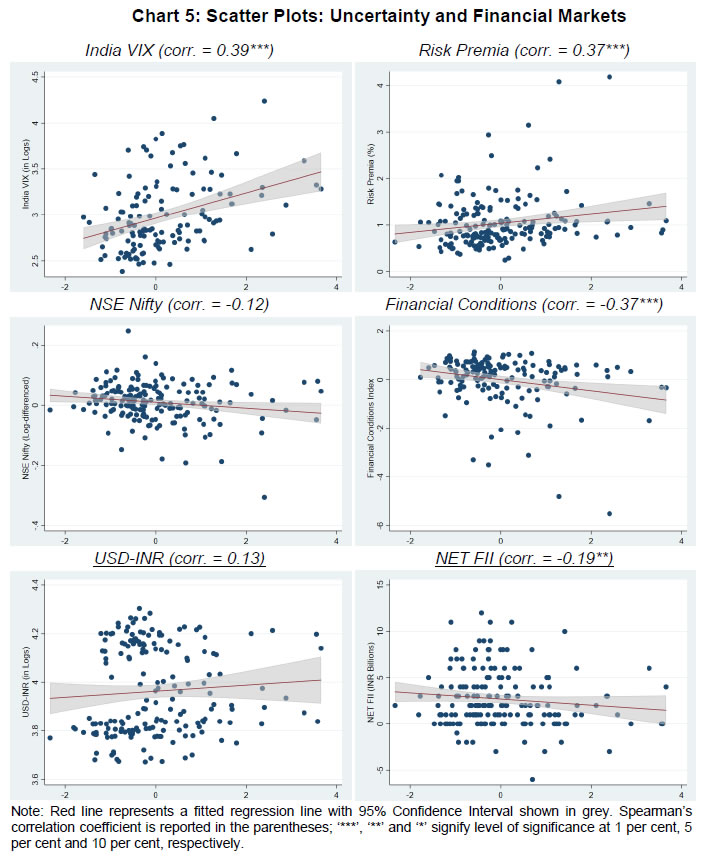 Further, INDIA-UI (x-axis) is plotted alongside macroeconomic variables (all real variables taken in year-on-year (YoY) percentage change terms), namely, gross fixed capital formation (GFCF) as a measure of overall private investment; gross final private consumption as a measure of total private consumption; total bank credit as a measure of lending activity; and, gross domestic product (GDP) as a measure for overall economic activity (Chart 6). Similar to other countries, uncertainty correlates negatively with economic activity in India. Therefore, on an average, higher the uncertainty, lower is the private consumption, bank credit, private investment and output. This underlines the strong procyclical nature of uncertainty. 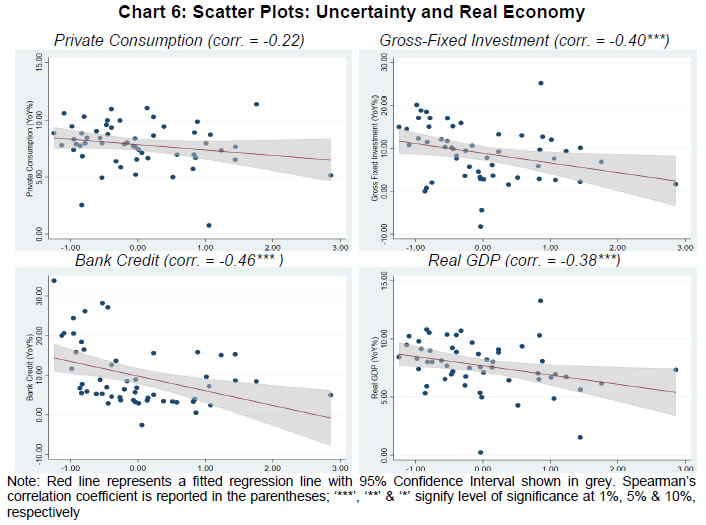 As a next step, we employ the Granger causality test to understand the predictive relationship i.e., lead-lag relationship between uncertainty and indicators of risk, investment and output discussed above. The feasibility of using uncertainty index to forecast other economic indicators can also be determined from this exercise. Test results have been provided in Appendix Table A1. The test fails to reject the null that uncertainty does not granger cause financial market indicators. On the contrary, the causality (in granger sense) runs from financial markets to uncertainty. This may suggest that financial markets are ahead of newspapers and economic agents in picking up early signs of any impending risk and/or uncertainty in the economy. Broadly in line with the literature, uncertainty granger causes real macroeconomic indicators, such as investment (GFCF), consumption (PFCE) and real GDP growth. IV.1. Dynamic Impact of Uncertainty Shocks To understand the macroeconomic impact of uncertainty shocks on Indian financial markets and the broader real economy, we estimate a model based on the local projections (LP) framework proposed by Jordá (2005) as follows: where h = (1, 2…, H) and Yt is a set of endogenous variables. In its basic form, local projection framework consists of sequential regressions of endogenous variables shifted several steps ahead. In other words, this involves directly regressing the variable of interest on the shock, controlling for other variables (Nakamura and Steinsson, 2018). To construct impulse response functions (IRFs) from this approach, separate regression for each forecast horizon (h) must be estimated: In contrast, standard vector autoregressions (VARs) are based on a global approximation of the data generating process (DGP) and thus uses the estimated dynamics of the entire system to ‘iterate’ the response of the concerned variable to a shock. In such a scenario, estimated IRFs from a VAR could be biased if the underlying VAR is mis-specified. The LP method has been shown to be robust to model mis-specification error and can be easily estimated using ordinary least squares (OLS) technique. We set up two models – one focused on private investment and another on overall economic activity – and estimate impulse responses (IRs) using the LP method to summarize the dynamic impact of uncertainty shocks on financial and macroeconomic variables. The model, variable and sample details are provided in Table 2. To ensure that the shocks are well-identified and uncertainty shocks are orthogonal to other stochastic elements in the econometric model, we rely on a Cholesky Decomposition with the same ordering as variables mentioned in Table 2. This lets us gauge whether uncertainty shocks foreshadow weaker macroeconomic performance in terms of increased risk, lower investment and output growth in the economy. | Table 2: Local Projection (LP) Model Specification and Data | | Model | Variables | Sample | | Model 1 | India-UI; risk premia; real weighted-average lending rate (WALR); real gross fixed capital formation (GFCF, YoY%) | 2005Q1-2018Q4 | | Model 2 | India-UI; CPI inflation; real gross domestic product (GDP, YoY%); real weighted-average call rate (WACR) | Quantifying the impact of uncertainty shock on investment activity, Chart 7 shows the model-implied responses of risk premia, weighted average lending rate (WALR) and private investment activity (GFCF) to a one standard deviation shock to uncertainty8. The results of the model suggest that there is an instantaneous increase in risk premia following an uncertainty shock. Similarly, investment activity also falls by around 2.0 per cent after an uncertainty shock. The increase in risk premia tends to dissipate quickly but the decline in investment activity is prolonged up to four quarters after which the impact is found to be statistically insignificant. The impulse response of investment to lending rates turn statistically significant from second quarter onwards implying the dampening and sustained impact of monetary policy on investment that works mainly through the lending rate channel9. The broad results are found to be similar when other financial market variables, such as change in NSE Nifty Index or India VIX Index, are used in place of risk premia. The overall results, in line with earlier studies (Anand and Tulin, 2014), seem to suggest that uncertainty is negatively associated with investment activity in India. 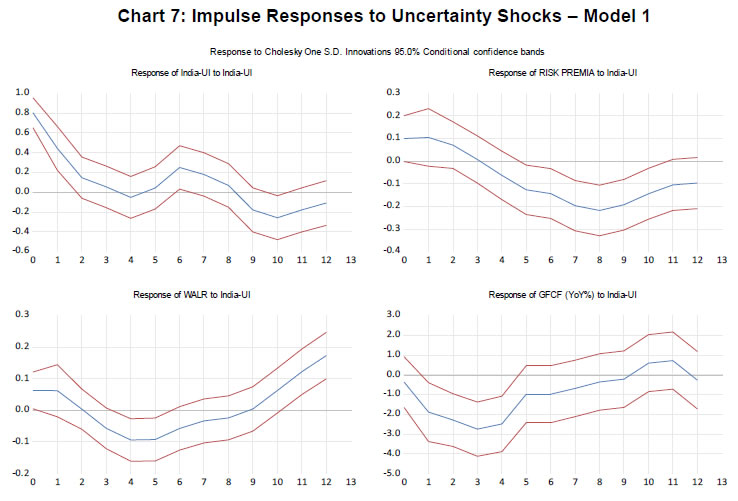 As far as the second model is concerned, Chart 8 shows the response of real GDP growth for India to uncertainty shocks. Like investment, overall economic activity (real GDP) also witnesses a sharp fall in response to an uncertainty shock triggering almost a 0.8 per cent loss in growth. The impact is, however, sustained only till the third quarter. Ghosh et al. (2017) find that uncertainty shocks lead to an increase in inflationary expectations in the economy, captured in the form of survey-based expectations. If inflationary expectations remain high for a sustained period, it is likely to result into an increase in actual inflation. Arguably, in our case, uncertainty shocks also seem to cause an increase in actual inflation, albeit after a prolonged gap of more than a year i.e., in the 5th and the 6th quarter. Thus, we may conclude that, in addition to impacting investment activity, uncertainty also negatively impacts overall economic activity in India. V. Conclusion and Way Forward The importance of uncertainty in the evolution of financial markets and macroeconomic conditions of a country has been highlighted in various studies. In this paper, we aimed to develop alternative uncertainty indices for India. We constructed three uncertainty indices based on newspaper articles, sentiment analysis of news articles and internet search intensity, respectively. To capture overall uncertainty in the economy, a single index was constructed using a principal components approach. This index captures views of news media as well as economic agents and can capture both domestic and international events. The validity of uncertainty index for India is assessed in terms of its impact on financial markets as well as the real economy. As the theory suggests, uncertainty is positively correlated with risk measures while it shows a negative relationship with measures of economic activity in India. Based on granger causality test, financial markets appear to factor-in uncertainty in advance, while uncertainty seems to ‘lead’ the changes in investments and consumption. Using a robust local projections-based econometric framework, we assess the impact of uncertainty shocks on financial markets and the real economy. Results suggest that financial markets, private investment, inflation and overall economic activity are negatively impacted by heightened uncertainty. The findings are in line with results obtained in other country-specific studies. From a policy perspective, our results suggest that policymakers can use the information on uncertainty for devising policy framework and institutional arrangements that foster sound and predictable policies. The creation of a novel dataset and automated algorithms to compute uncertainty indices undertaken for this study should pave way for further research on uncertainty within and outside the Reserve Bank. For instance, it is now possible to create specific indicators on uncertainty related to Trade Policy, Fiscal Policy, Monetary Policy, Regulatory Policy etc., using our dataset and algorithms. It may also be possible to compute state-level indicators of uncertainty, which can be used to study the impact of uncertainty on investment flows and medium-term economic activity at the state-level in India. Lastly, such uncertainty indices can also help strengthen policy simulation exercises to study the impact of low/high uncertainty scenarios and improve near-term projection of macroeconomic variables which exhibit high degree of sensitivity to uncertainty.
References Abel, A. B. (1983). Optimal investment under uncertainty. The American Economic Review, 73(1), 228. Anand, R., & Tulin, V. (2014). Disentangling India’s Investment Slowdown (No. 14-47). International Monetary Fund. Arellano, C., Bai, Y., & Kehoe, P. (2010). Financial markets and fluctuations in uncertainty. Federal Reserve Bank of Minneapolis Working Paper. Azqueta-Gavaldón, A. (2017). Developing news-based economic policy uncertainty index with unsupervised machine learning. Economics Letters, 158, 47-50. Bachmann, R., Elstner, S., & Sims, E. R. (2013). Uncertainty and economic activity: Evidence from business survey data. American Economic Journal: Macroeconomics, 5(2), 217-49. Bachmann, R., & Bayer, C. (2013). ‘Wait-and-See’ business cycles?. Journal of Monetary Economics, 60(6), 704-719. Baker, S. R., & Bloom, N. (2013). Does uncertainty reduce growth? Using disasters as natural experiments (No. w19475). National Bureau of Economic Research. Baker, S. R., Bloom, N., & Davis, S. J. (2016). Measuring economic policy uncertainty. The Quarterly Journal of Economics, 131(4), 1593-1636. Basu, S., & Bundick, B. (2017). Uncertainty shocks in a model of effective demand. Econometrica, 85(3), 937-958. Bernanke, B. S. (1983). Irreversibility, uncertainty, and cyclical investment. The Quarterly Journal of Economics, 98(1), 85-106. Bertola, G., & Caballero, R. J. (1994). Irreversibility and aggregate investment. The Review of Economic Studies, 61(2), 223-246. Bianchi, F., Kung, H., & Tirskikh, M. (2018). The Origins and Effects of Macroeconomic Uncertainty (No. w25386). National Bureau of Economic Research. Bloom, N. (2009). The impact of uncertainty shocks. Econometrica, 77(3), 623-685. Bloom, N., Bond, S., & Van Reenen, J. (2007). Uncertainty and investment dynamics. The Review of Economic Studies, 74(2), 391-415. Bloom, N. (2014). Fluctuations in uncertainty. Journal of Economic Perspectives, 28(2), 153-76. Bonciani, D., & Van Roye, B. (2016). Uncertainty shocks, banking frictions and economic activity. Journal of Economic Dynamics and Control, 73, 200-219. Bonciani, D., & Oh, J. J. (2019). Staff Working Paper No. 802. The long-run effects of uncertainty shocks. Bank of England. Bontempi, M. E., Golinelli, R., & Squadrani, M. (2016). A new index of uncertainty based on internet searches: A friend or foe of other indicators?. University of Bologna Working Papers. Born, B., & Pfeifer, J. (2014). Policy risk and the business cycle. Journal of Monetary Economics, 68, 68-85. Castelnuovo, E., & Tran, T. D. (2017). Google it Up! A Google trends-based uncertainty index for the United States and Australia. Economics Letters, 161, 149-153. Christiano, L. J., Motto, R., & Rostagno, M. (2014). Risk shocks. American Economic Review, 104(1), 27-65. Dzielinski, M. (2012). Measuring economic uncertainty and its impact on the stock market. Finance Research Letters, 9(3), 167-175. Eberly, J. C. (1994). Adjustment of consumers' durables stocks: Evidence from automobile purchases. Journal of political Economy, 102(3), 403-436. Ghirelli, C., Pérez, J. J., & Urtasun, A. (2019). A new economic policy uncertainty index for Spain. Economics Letters, 182, 64-67. Ghosh, T., Sahu, S., & Chattopadhyay, S. (2017). Households' inflation expectations in India: Role of economic policy uncertainty and global financial uncertainty spill-over (No. 2017-007). Indira Gandhi Institute of Development Research, Mumbai, India. Gilchrist, S., Sim, J. W., & Zakrajšek, E. (2014). Uncertainty, financial frictions, and investment dynamics (No. w20038). National Bureau of Economic Research. Government of India, GOI. (2019). Economic Survey 2018-19. Ministry of Finance, Government of India, New Delhi, India. Hartman, R. (1976). Factor demand with output price uncertainty. American Economic Review, 66(4), 675-81. Jordà, Ò. (2005). Estimation and inference of impulse responses by local projections. American Economic Review, 95(1), 161-182. Jurado, K., Ludvigson, S. C., & Ng, S. (2015). Measuring uncertainty. American Economic Review, 105(3), 1177-1216. Kimball, M. S. (1990). Precautionary Saving in the Small and in the Large. Econometrica, 58(1), 53-73. Knight, F. H., (1921). Risk, Uncertainty, and Profit. Boston, MA: Hart, Schaffner & Marx; Houghton Miffl in Company Leduc, S., & Liu, Z. (2016). Uncertainty shocks are aggregate demand shocks. Journal of Monetary Economics, 82, 20-35. Loughran, T., & McDonald, B. (2011). When is a liability not a liability? Textual analysis, dictionaries, and 10‐Ks. The Journal of Finance, 66(1), 35-65. Nakamura, E., & Steinsson, J. (2018). Identification in macroeconomics. Journal of Economic Perspectives, 32(3), 59-86. Nyman, R., Kapadia, S., Tuckett, D., Gregory, D., Ormerod, P., & Smith, R. (2018). News and narratives in financial systems: exploiting big data for systemic risk assessment. Bank of England. Novy, D., & Taylor, A. M. (2014). Trade and uncertainty (No. w19941). National Bureau of Economic Research. Ocakverdi, E., (2016). Impulse Responses by Local Projections. EViews Blog, 23 June 2016. Available at: http://blog.eviews.com/2016/06/impulse-responses-by-local-projections_43.html. Oi, W. Y. (1961). The desirability of price instability under perfect competition. Econometrica: Journal of the Econometric Society, 58-64. Pindyck, R. S. (1993). A note on competitive investment under uncertainty. The American Economic Review, 83(1), 273-277. Saltzman, B., & Yung, J. (2018). A machine learning approach to identifying different types of uncertainty. Economics Letters, 171, 58-62. Scotti, C. (2016). Surprise and uncertainty indexes: Real-time aggregation of real-activity macro-surprises. Journal of Monetary Economics, 82, 1-19. Stein, L., & Stone, E. (2012). The effect of uncertainty on investment. Hiring and R&D: Causal Evidence from Equity Options. Stock, J. H., & Watson, M. W. (2012). Disentangling the Channels of the 2007-2009 Recession (No. w18094). National Bureau of Economic Research. Tobback, E., Naudts, H., Daelemans, W., de Fortuny, E. J., & Martens, D. (2018). Belgian economic policy uncertainty index: Improvement through text mining. International journal of forecasting, 34(2), 355-365. Xie, F. (2020). Wasserstein Index Generation Model: Automatic generation of time-series index with application to Economic Policy Uncertainty. Economics Letters, 186, 108874.
Appendix A: Results | Table A1: Granger Causality Tests | | Hypothesis | Lag 1 | Lag 2 | Lag 3 | Lag 4 | | VIX does not granger cause India-UI | 7.444
(0.007) | 5.598
(0.005) | 3.774
(0.012) | 3.550
(0.009) | | India-UI does not granger cause VIX | 0.384
(0.536) | 1.157
(0.317) | 0.394
(0.757) | 0.228
(0.922) | | NSE NIFTY does not granger cause India-UI | 3.599
(0.059) | 2.609
(0.076) | 2.901
(0.036) | 3.059
(0.018) | | India-UI does not granger cause NSE NIFTY | 0.019
(0.889) | 0.354
(0.701) | 1.010
(0.389) | 0.755
(0.555) | | USD-INR does not granger cause India-UI | 0.014
(0.906) | 10.582
(0.00) | 7.698
(0.00) | 5.676
(0.00) | | India-UI does not granger cause USD-INR | 0.290
(0.591) | 0.036
(0.964) | 0.094
(0.963) | 0.556
(0.695) | | GFCF does not granger cause India-UI | 0.098
(0.755) | 0.417
(0.662) | 0.395
(0.757) | 0.308
(0.871) | | India-UI does not granger cause GFCF | 7.078
(0.010) | 3.385
(0.042) | 2.732
(0.055) | 1.933
(0.123) | | PFCE does not granger cause India-UI | 3.122
(0.083) | 1.893
(0.162) | 1.524
(0.221) | 1.102
(0.368) | | India-UI does not granger cause PFCE | 4.261
(0.044) | 3.825
(0.029) | 2.978
(0.041) | 1.936
(0.122) | | GDP does not granger cause India-UI | 0.491
(0.486) | 1.302
(0.281) | 1.405
(0.254) | 1.006
(0.415) | | India-UI does not granger cause GDP | 8.495
(0.005) | 4.602
(0.015) | 3.014
(0.040) | 2.036
(0.107) | | Note: F-statistic for the test are reported. P-value in parentheses. | 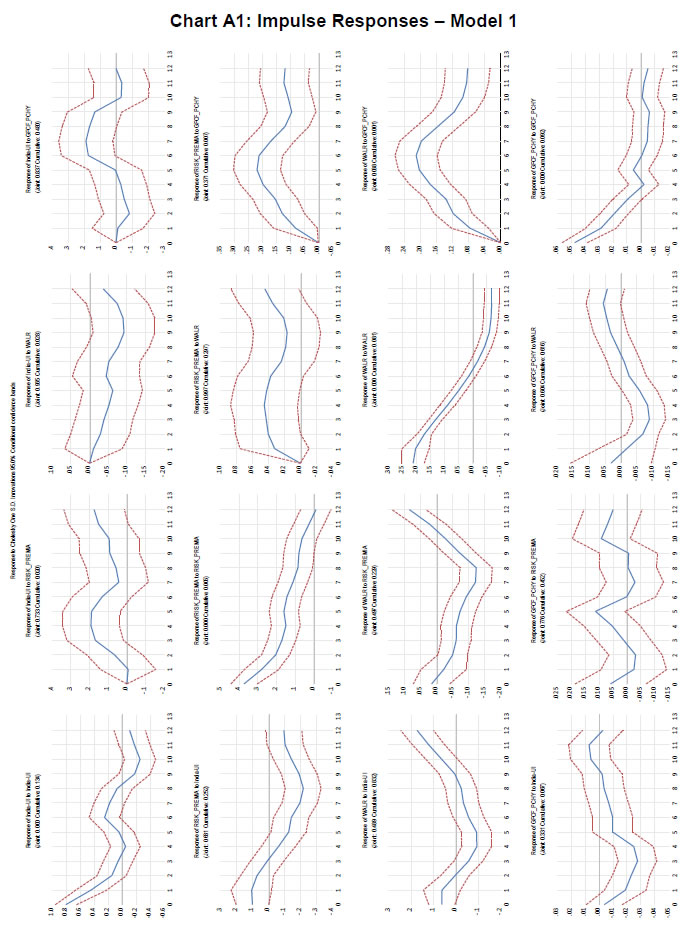 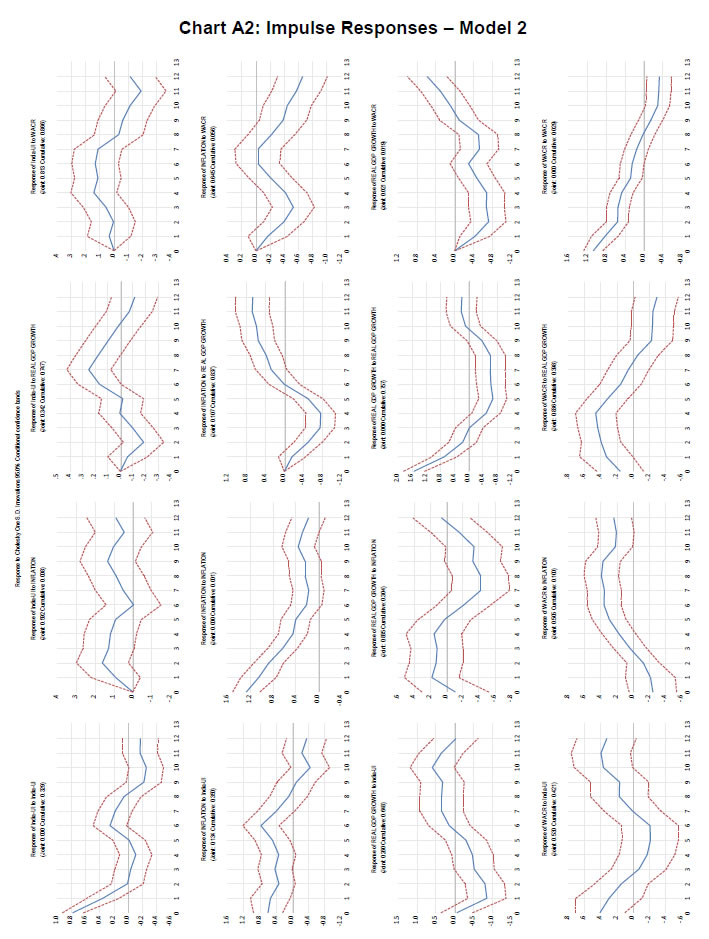
Appendix B: Keyword Lists for Newspaper-based Index EPU index is constructed following Baker et al. (2016) approach by searching for certain keywords in each newspaper article. Each news article was then classified by them as signaling uncertainty if it contained at least one keyword each from sets Economic (E), Policy (P) and Uncertainty (U) given below: | Table B1: List of Keywords used in EPU | | Category Name | Category Keywords | | E | "economic", "economy" | | U | "uncertainty", "uncertain" | | P | "fiscal policy", "monetary policy", "central bank", "rbi", "reserve bank", "regulation", "deficit", "legislation", "reform", "parliament", "finance ministry", "policy makers", "finance minister", "lawmakers", "niti aayog", "economic advisor", "prime minister's office", "pmo", "pmeac", "lok sabha", "tax", "taxes", "taxation", "excise duties", "custom duties", "gst" | Internet search intensity (via Google Trends) based uncertainty index for India (GUI) is constructed using internet search intensity of different set of keywords pertaining to Trade, Monetary and Fiscal policies (Table B2). Irrelevant topics are removed by ‘-’ operator. | Table B2: List of keywords used in GUI | | Category Name | Category Keywords | | Trade | "custom duty", "custom duties", "government subsidies", "government subsidy", "wto - what is", "trade treaty", "trade agreement", "trade act", "trade policy", "anti dumping", 'gatt' | | Monetary | "Reserve Bank of India - recruitment", "RBI - recruitment - job", "money supply", "monetary policy", "open market operations", "omo", "rbi policy", "policy repo", "repo rate", "reverse repo rate", "central bank", "governor - state", "rbi governor", "exchange rate", "rupee dollar", "usd inr rate", "deputy governor", "CRR", "SLR - camera", "money market rate", "liquidity", "liquidity adjustment facility", "marginal standing facility", "inflation", "rate cut", "federal reserve", "monetary policy committee" | | Fiscal | "tax rates", "tax rate - calculator", "taxation", "taxed", "government budget", "union budget", "india budget", "fiscal deficit", "government debt", "government expenditure", "revenue deficit", "india fiscal deficit", "fiscal stimulus", "corporate tax", "excise duty", "service tax", "custom duty", "GST", "goods and services tax", "double taxation", "tax slab", "tax slabs - calculator" |
Appendix C: Computation of Internet search intensity-based Index |